Pattern Trading
The new financial year has arrived and for those following on from last month’s discussion, you will know I am seeing a strong trader’s market currently with a huge amount of opportunity for the prepared. The backdrop to markets is just a reflection on the human condition and we see that currently with markets making fresh highs in the US and Australia but the average person in those economies may not be feeling that level of exuberance around their own circumstances.
As we talk about the cycles that exist, I was reminded of research that measures cycles in all things, there is some solid research on the impact the Olympics has on financial markets and how in turn this plays out at the announcement, delivery and post the Olympics in local and global economies. It’s fair to say that the Olympics provides some distraction from the daily news that we consume, and markets typically experience a bump during the games. Again, the human condition may just be a little less pessimistic at the time and the bulls gain control. These measurable moves are all simple patterns in history that we as students of history can measure, observe and build systems around.
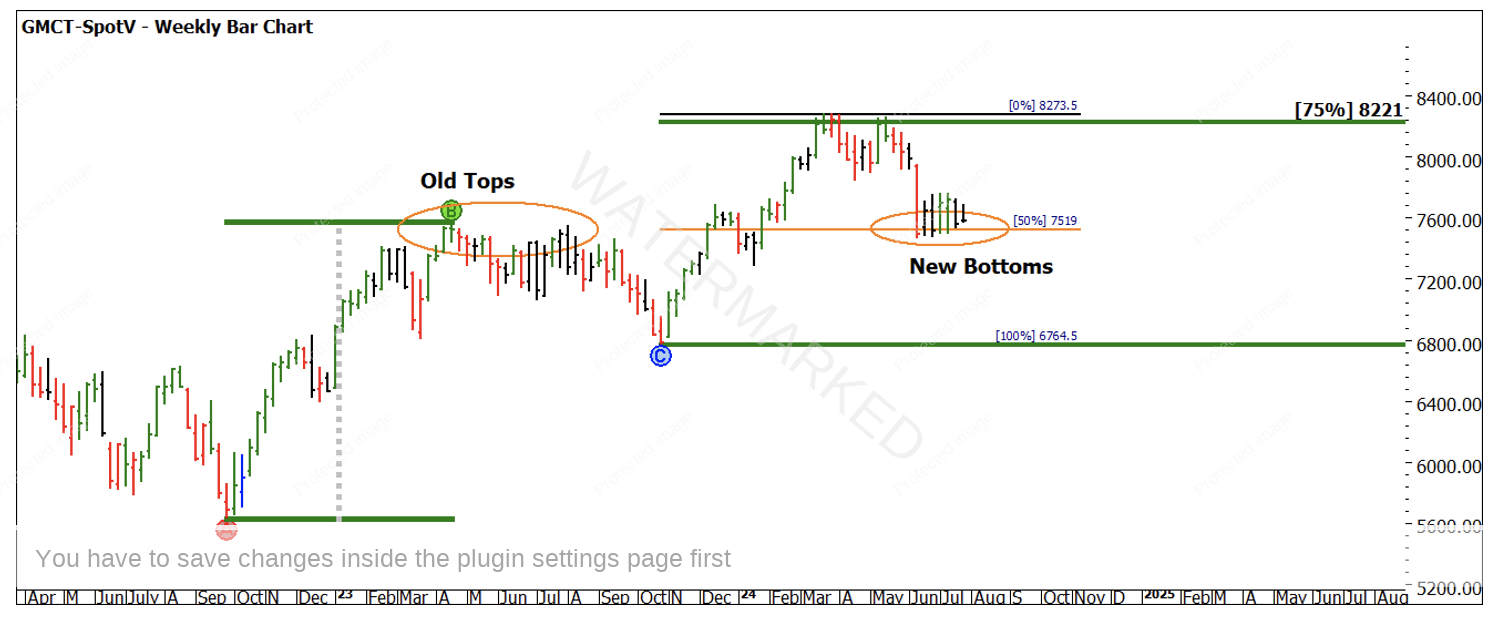
A quick dive into the CAC 40 (the French stock index) shows us some familiar patterns and if we removed the name labels and price axis it could be any market. Chart 1 shows a few patterns and pressure points that jump out as potential opportunities for us as traders. Keep in mind that the CAC 40 has futures and no doubt CFD contracts that could be utilized.
The current sideways pattern that commenced in June 2024 has seen the market consolidate to now be sitting on the 50% of the last major range. This is also the area of the old tops in 2023. Gann’s saying of old tops become new bottoms holds here.
The current all-time highs from last year sit nicely at 75% of the 2022/2023 range.
Chart 1- CAC-40 Weekly Bar Chart
By training ourselves to identify, test and confirm patterns, we are able to quickly pick up new opportunities and if required action them. I am not suggesting we all become specialists in the French index market because of the Olympics, but this could be a good test case market to watch and stalk a little closer to see if there are any breakout opportunities be that long or short in the coming period.
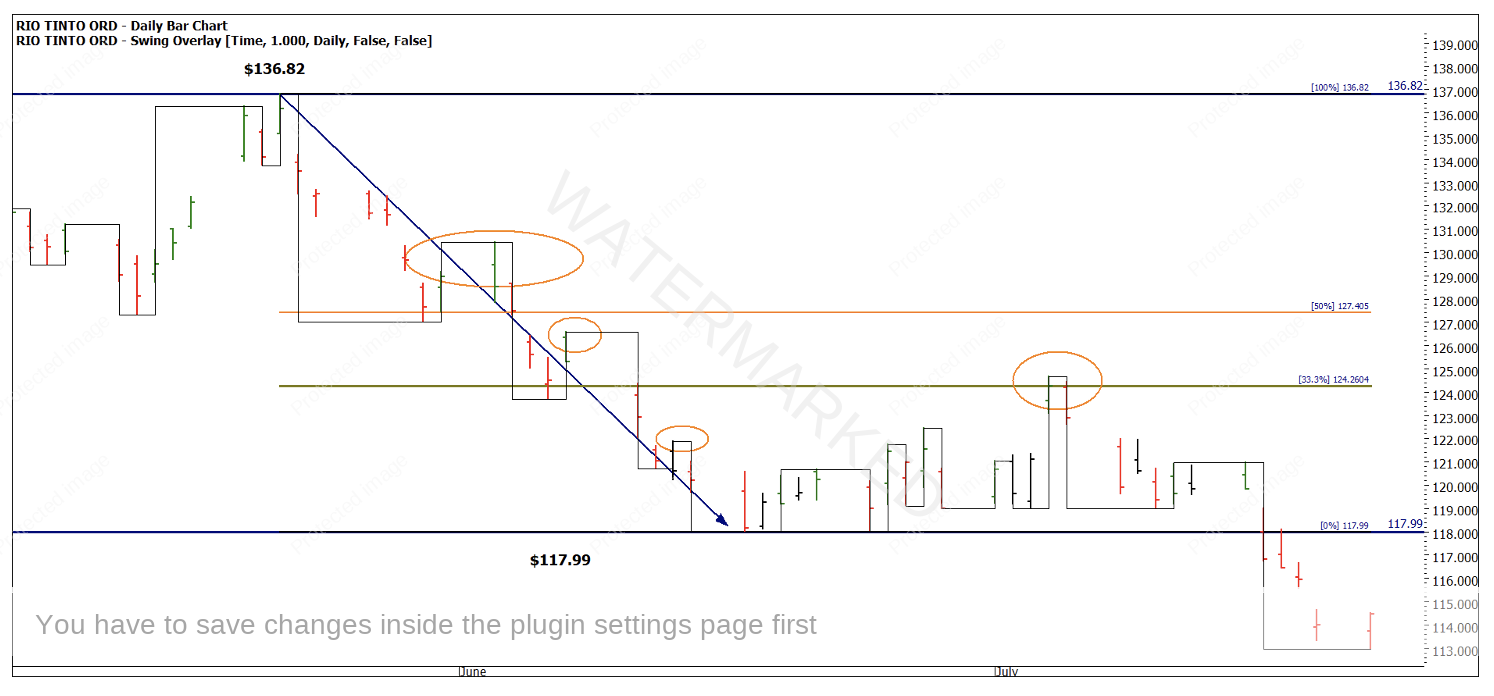
Back to last month’s discussion on Rio Tinto. The analysis showed a compelling case for the double top producing downside pressure. The May top produced a $16 short move that was quite sharp and made somewhat challenging for entries if you were not set around the area of the high.
Chart 2 shows the top followed by lower swing tops on the 1-day swing chart. Entries could have been achieved just following swing rules, however, just under 50% of the move had occurred before the first lower swing top had formed so this is a clear case as to why entering around the major turns should be the aim of traders as we sharpen our skills to do so.
Chart 2 – RIO.ASX Daily Bar Chart
I have also noted the early July swing top as another entry area. The market moved from 17 June to 4 July in a nominal sideways pattern and was not productive be it to the long or short side. This can often be seen after a strong move that the time must catch up to price.
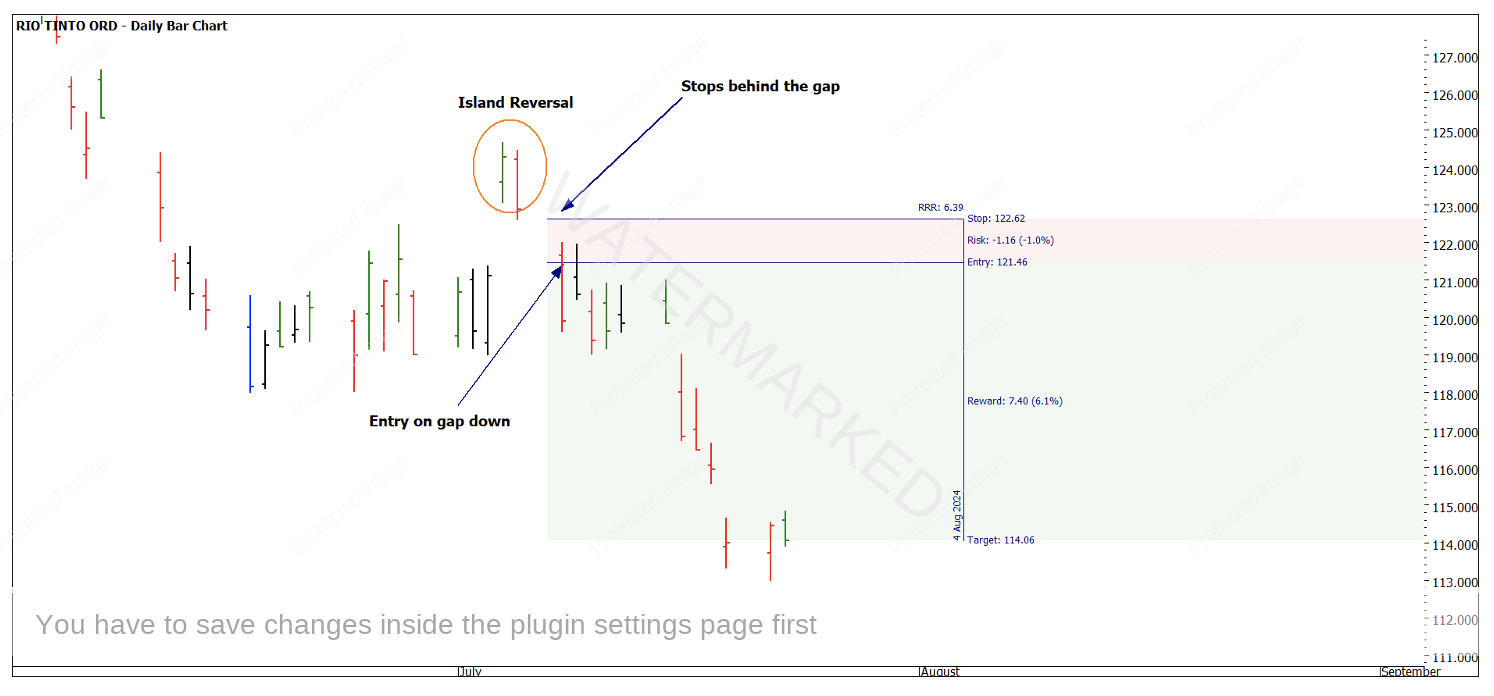
One of the best patterns I have found on RIO and other stocks that have dual listings in overseas markets and trade in a volatile area like commodities is that they tend to gap a lot and form the pattern known as Island Reversals.
A quick review of your home study material will get you up to speed, however the pattern alone is not enough to trade on, we are always looking to confirm with other reasons to trade. The 4th/5th July exhausted the bulls as the market gapped up out of the sideways range. This was followed by a gap down on the 8th of July.
You should review your charts as there was Time by Degrees, angles, time counts and Resistance Cards that were all suggesting that island had some harmonies. Chart 3 shows the entry that could have been utilised by trading off the island reversal pattern confirmation.
The entry is aggressive and requires us to enter on or around the open, in this case the 8th of July. Followed by placing stops behind the gap just created. This gap was not threatened, so as the short trade developed over the next week, we should be looking to move stops to entry plus commission as soon as practicable.
Chart 3- RIO.ASX Daily Bar Chart
The position remains current as the price action has fallen further. The challenge now is how we can manage this position inside the pattern of the larger double top and time discussion as mentioned in the June article.
Good Trading
Aaron Lynch


