Paving the Way with Afterpay
It is often the subtle signs and historical patterns within a market that allow us to pave the way and understand the overall behaviour of a market. As David Bowden says you should ‘know your market like a cow knows it’s calf’. He was serious when he said that, as it is often the very early days within a trend or history of the market that dictates the future patterns based on the Gann Methodology.
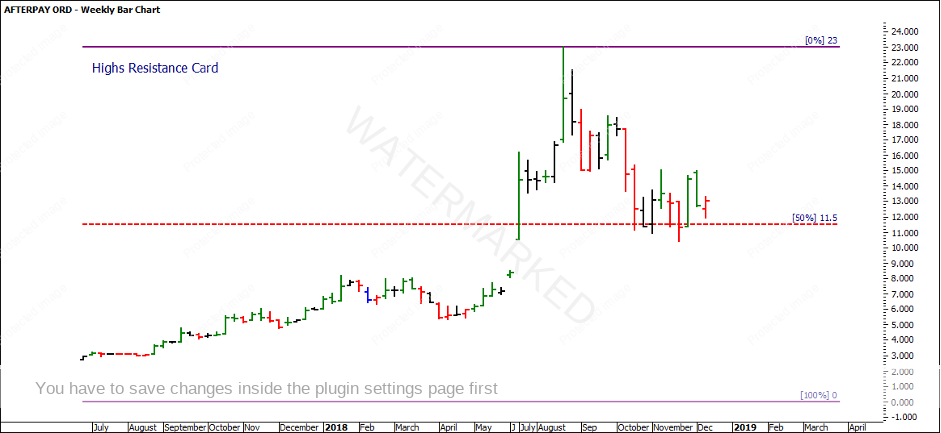
If we review Afterpay Inc listed on the ASX (ProfitSource Code: APT), you can see that the stock was listed in June 2017. It began a very strong rally, making a high at $23 before falling back to its All-Time High’s 50% level. Whilst the market fell through the exact 50% of $11.50, there were multiple weekly lows on the 50% level which show strength in this support area.
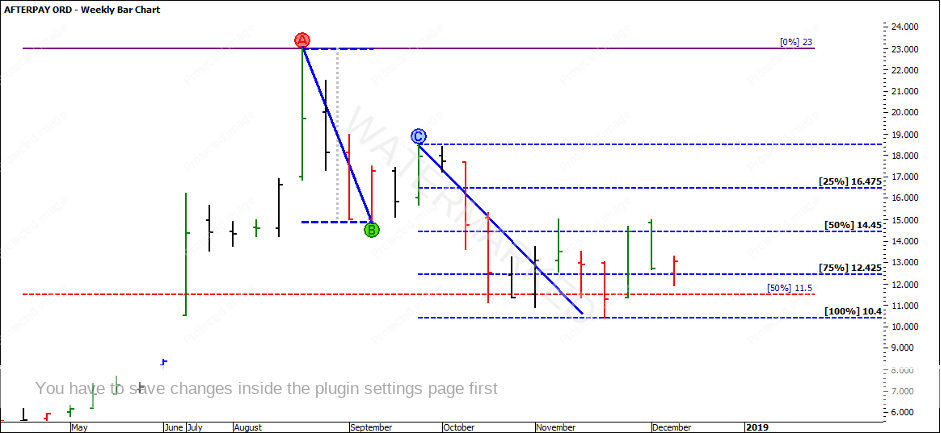
The strength of this level was also defined by the repeating ranges from the All-Time High. The market was able to repeat the FRO from the ATH at 100%, prior to quickly making a higher bottom above this level and rallying to $40.00. Wouldn’t it have been great to have bought at $10!
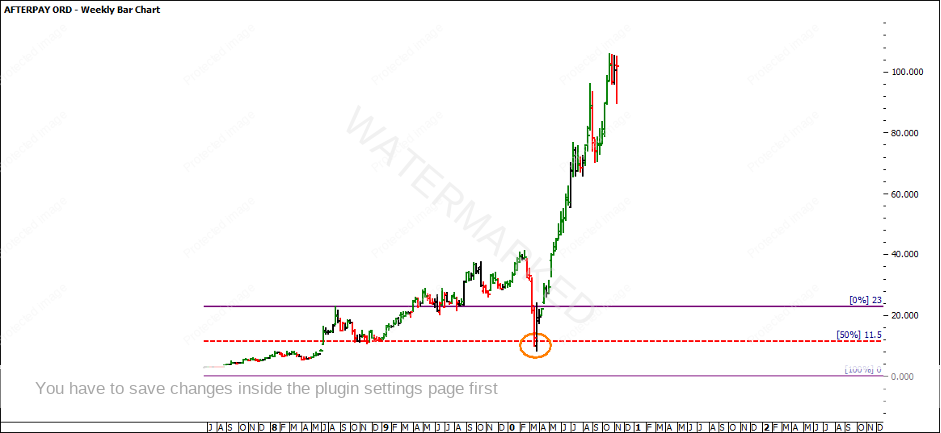
If you missed the above opportunity, the next best opportunity is always around the corner. If you knew this market well, you would know the market was held up on this very strong support level of $11.50 when the COVID-19 crash hit. The market fell back to this support level that we saw in 2018. What was to come was another great rally to follow.
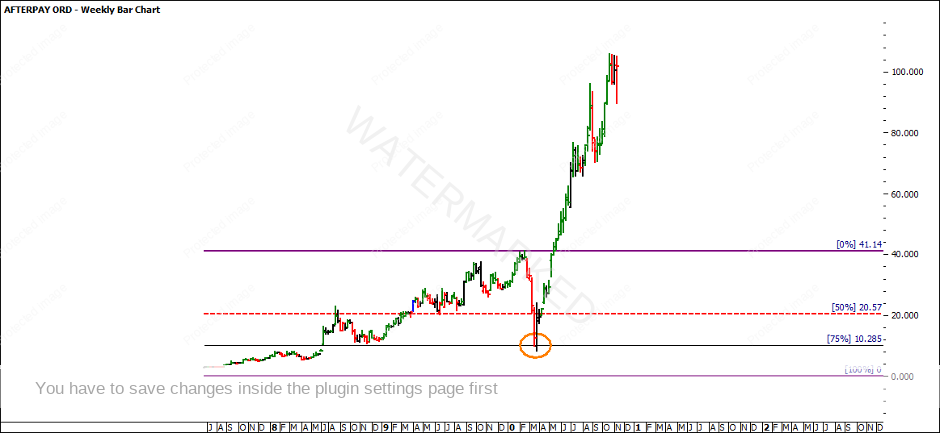
The new 2020 All-Time High was made at $41.14. If you apply a highs resistance card to the All-Time High at $41.14 you can see that the market has a price cluster at 75% of this level.
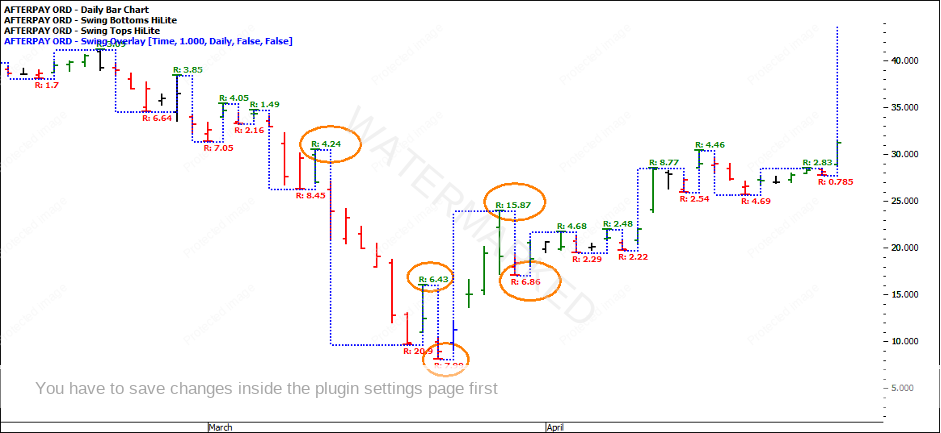
At this stage, it would be time to turn to the swing chart to identify the trading opportunity. As the market pushed out of the COVID low, the range of 6.43 doubled to 15.87 to the upside, showing expansions in the market. The downside ranges were showing contractions, though psychologically you would be hesitant to execute if you didn’t know the market well, and it was during COVID lock down when the world seemed to be shutting down.
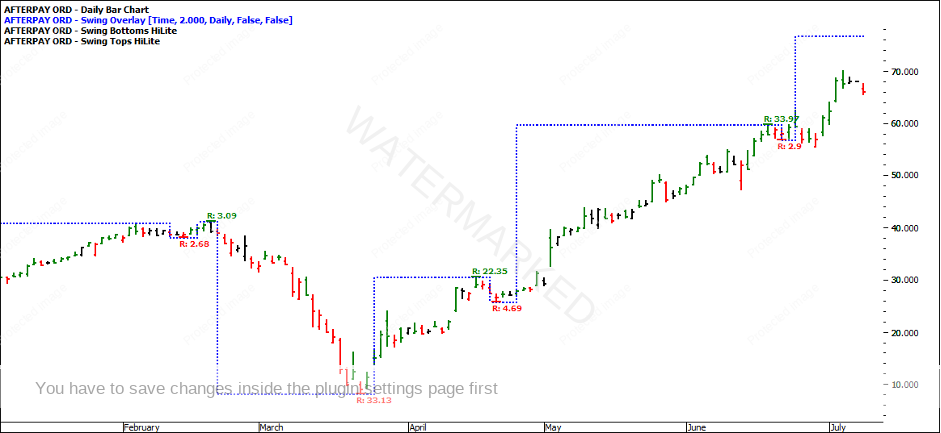
You may have opted for a two-day swing chart to confirm. Similarly, the range of 3.09 more than doubled to a range of 22.35 to the upside, showing expansions in the market. The downside ranges were showing very obvious contractions. As you can see in hindsight the two-day swing chart looked a lot cleaner to trade.
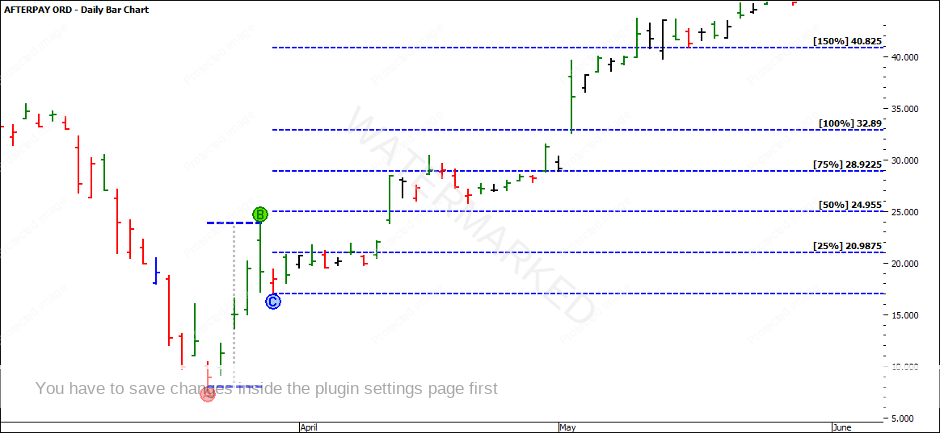
Though, if you followed the trading plan, the First Range Out (FRO), which was the first higher swing bottom, provided an ABC trade long. There were also many multiple ABC trades to follow, but something as simple as combining trailing swings as well as implementing a milestone trading style such as the currency style would have yeilded some very attractive profits.
I encourage you to spend the time to backtest these ABC trades and to compare them to trading a strongly trending market. It is often the strong trend that implies that someone has done well out of the market. Afterpay currently trades over $100. $100 is a psychological level that would be an interesting place to start reviewing the bigger picture.
It’s Your Perception
Robert Steer
