Pay Attention to the Cycles
Stick with me as I offer up one final piece to the conveyor belt for 2019. The year in review is a simple story economically, uncertainty and trepidation remain. We are told economies are strong but seem weak given interest rates are so low. The investment community knows markets are overvalued, dare I say bubble material, however, because they need to be “in” making a return at least on par with their peers, and so the merry go round continues… until the music stops.
Hence, we are better off trading the trend in most cases than trading against it. This year the successes I have seen have come from trading with the main trend and then holding on until a good reason presents to no longer be trading the markets that way. Two things are on my mind at this time of year as I alluded to last month, the Christmas rally and the natural review of the year of that was in terms of your achievements against your goals.
If you didn’t have any goals in 2019 you likely achieved them, if you did have a list of goals for the past year, now is the time to cross check. This to me is like checking your budget to actual in an accounting term. What was the plan, what was the outcome? I suggest placing all of your trades into three piles, winners, break evens and losers. From here you should be able to calculate your win/loss ratio. While this ratio is important, it’s not the be all and end all, it suggests how good you are in trade selection, but the average win and average loss ratios will tell how well you manage trades. On this, if you are not prepared to stack up your trades in the light of day for scrutiny and dare, I say inspection, trading as a business is some ways off for you. The follow on to this as well is it allows us to set goals for 2020 to target the right areas.
Onto markets, last month I discussed the Christmas rally. Up until a few days ago the markets were powering along, and a pullback was not looking likely as the US and Australian equity markets powered to new highs. Then we saw a decline in the SPI200 and the potential for the set up of the low to high run we see in December to January.
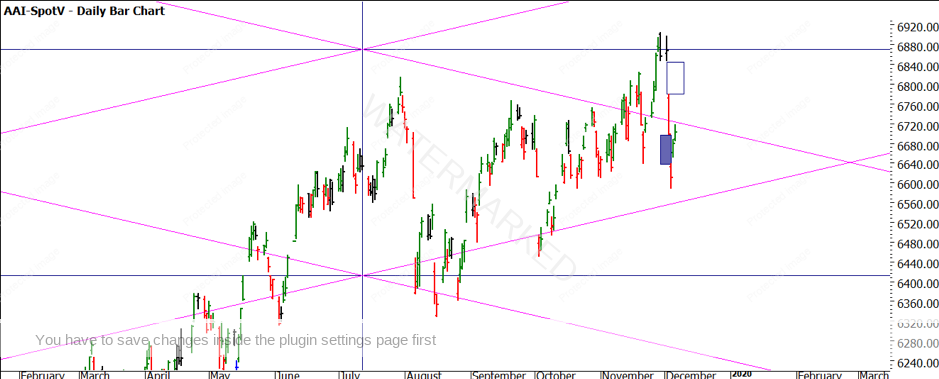
Gann wrote about January 6th – 8th of each year to watch for activity, this can be seen with regularity in market stock index markets. Let’s look at the SPI. We can see in Chart 1 the pullback in early December was within 1 point of repeating the September to October decline earlier this year.
Chart 1 – Daily Bar Chart SPI200
The pull back was quicker in terms of time and also broke the previous swing lows, so in terms of the bears getting an opprtunity to drive markets lower they have had a good opportunity.
It’s also worth noting the gaps in the move, the gap down in the blue shaded box has been filled but we see the gap higher up yet to be tested. This may be an area to watch for resistance.
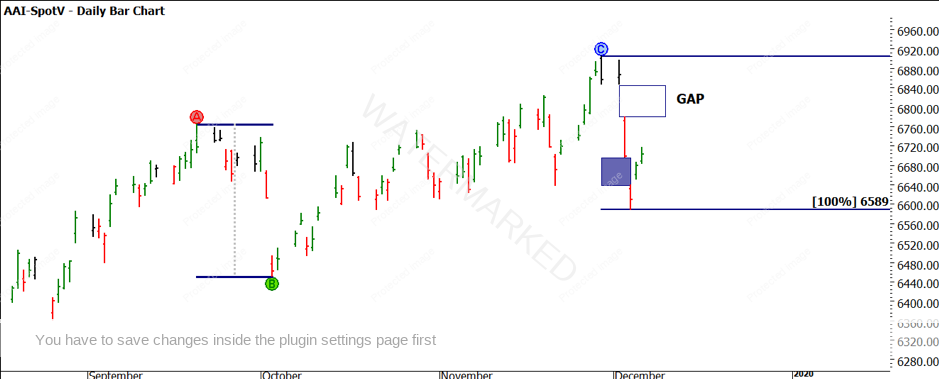
The bigger picture has seen us break the previous all time high of 6880 and now the current high is 6904. It would be prudent to consider a potential double top over 11 years. We are waiting for confirmation that it can be broken.
Chart 2 reflects on the low of 458 back in 1983, a very significant area if you have studied David’s work on the SPI.

Chart 2 – Daily Bar Chart SPI200
Chart 2 shows the blue lines acting as a Lows Resistance Card i.e. multiples of 458, acting as support and resistance, and the diagonal lines used in the sense of a market square. Given the position of the recent high in relation to the square there are several points to consider. Can the market break those highs and will the pink lines act as support or resistance in the coming weeks?
Finally, let me wish you all a fantastic Christmas and New Year period that is safe and enjoyable. I look forward to discussing markets with you again in 2020.
Good Trading,
Aaron Lynch
