Perspective
When volatility and opportunity meet…
When it comes to markets, volatility is a prime ingredient for the “opportunity” to participate and profit. The challenge arrives when volatility increases to such a point that we as traders find it difficult to set or more importantly hold positions. It could be said the last few weeks of market activity, especially in the stock market, has been more volatile due to the latest round of US / China trade tensions.
The main point is, uncertainty in markets creates volatility, as participants become concerned with how they will engage with the markets. Firstly, as David says in the Master Forecasting Course:
“the biggest thing that you’ve got going for you as a trader is that you don’t have to be in the market all of the time”
But for those that do, they are living in interesting times. Two indicators I use to measure volatility are the average range tool and the VIX chart out of the US markets.
Chart 1 shows the average daily range on the SPI 200. We should be familiar with this indicator as we use this for the placement and management of stops. We can see in the month of August that the average daily range has increased by 150% in a short period.
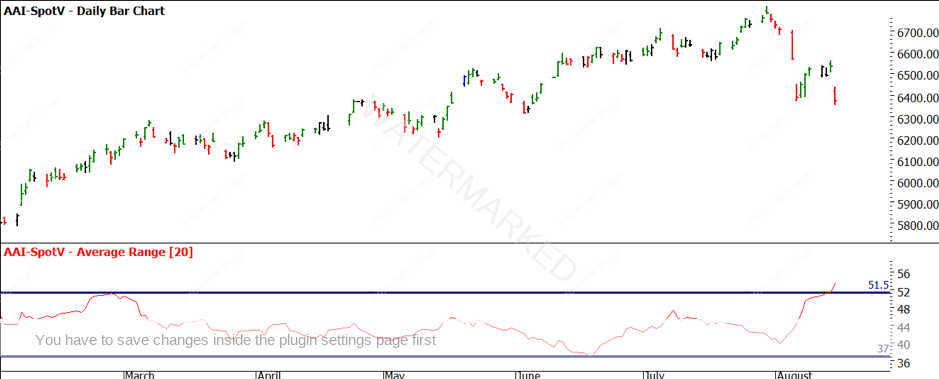
Chart 1 – SPI200 Daily Bar Chart – Average Daily Range
Chart 2 measures the VIX index. It measures the implied volatility on the S&P 500 index options, and it can have many uses. It has often been referred to as the “fear index” and while it can be applied in many ways and can be traded, I am using it purely as a measure of volatility i.e. rising / falling or neutral.
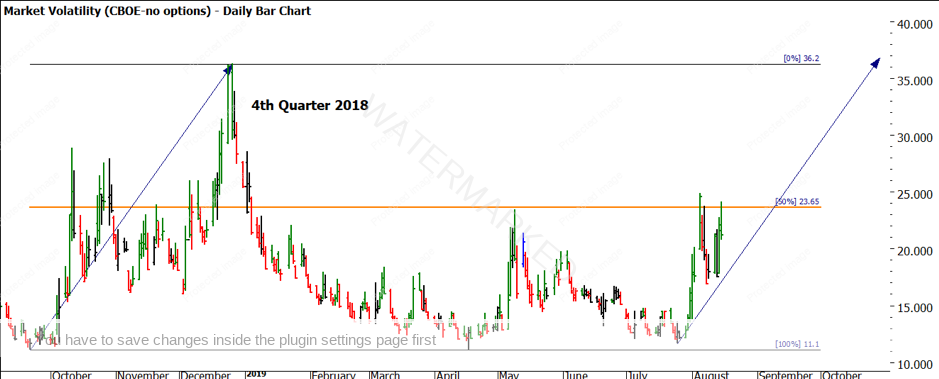
Chart 2 – VIX Index – Daily Bar Chart
The two areas I am comparing relate to the fourth quarter of 2018, where we saw the index markets drop on the trade tensions with China. That run from 21 September to 26 December saw the VIX triple in a short window. We have already seen 50% of that movement in the first part of August.
It’s safe to say we have confirmed a rise in volatility and a general concern over ‘where to next’ for the markets. We as traders now must adapt to these conditions, or another choice is to sit out until markets resume to normal levels of volatility. Therefore, I have named the article “Perspective”; we need to change our perspective and I mean specifically the time frames we trade off. The choice we have is simple as I see it, we can either reduce the time frame we analyse i.e. we could move from daily charts to 4 hour bar charts, this would allow us to reduce the amount of risk we have in the trade in pure dollars and cents and still maintain position sizes that we might normally take.
The downside of this is we need to be nimbler in terms of analysis, setting positions and then managing them. We can also be stopped out more easily as well, given the larger than normal ranges. This method I would recommend for the more experienced trader who has a focus on single markets that they have studied thoroughly and are most likely using time-based techniques to provide greater probabilities around entries.
For the more mechanical, price-based trader, stepping up your time frames to a weekly chart will enable less entries, more certainty with stops and risk management and may be less effected by the larger price swings. As this type of setup places our entry and stop loss further apart in dollar terms, we see our position sizes are typically smaller.
This may suit your personality (a slower moving trade) or it may not, so a compromise is to look at 2 and 3-day swing charts to act as a filter for extra noise but also keeps us close enough to the market. Chart 3 again details the SPI200 and the 1-day swing bottoms since December 2018. We can see that the current decline in price has seen several swing bottoms cleaned out (7 in fact). It is important to note as well that the gap down from 5 August has not been filled yet.
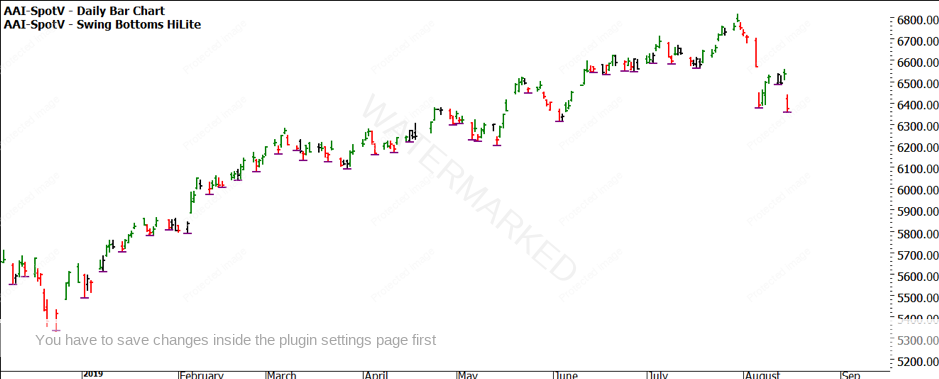
Chart 3 – SPI200 Daily Bar Chart
Let’s suggest for a moment you were looking to short the first lower swing top on the 1-day chart. You would have found that an entry followed by an abrupt exit would have been your outcome. If we look at the two-day swing chart, you will see that there has not been a lower top formed yet, so no harm or reward has been delivered. In cases where ranges are extended, a multi-day swing chart can smooth out false signals.

Chart 4 – SPI200 1 Day /2 Day Swing Charts
I will leave you to review the same period on the US S&P 500 but with the use of a 2-day swing chart, which would have proven useful in the last few weeks, not only in understanding swing ranges contraction and expansion but also setting and managing positions.
The Number One Trading Plan from David is such a rich text of information and often the area of 2- and 3-day swing charts can be glossed over as just a flow on from 1-day charts. Market conditions dictate what time frames to trade off, too many traders go to intra day charts in search of results when they are not yet ready for that speed up environment. Now is the perfect time in markets to watch in real time the benefits of changing your perspective.
I would encourage you to review the use of 2-day swing charts on the current position of Oil (CL-Spot1), as well as the recent moves in Gold, Silver and the US Dollar.
Good Trading,
Aaron Lynch