Point Perfect
Every so often a cluster will be hit exactly to the point, then turn, which recently happened on the SPI200. These types of setup make for a great trading plan, not just on this market but all markets.
The setup is a 2-Day Overbalance in Price out of the 1 November low, followed by a contracting range into a Re-test or Price Cluster on 13 November. See Chart 1 below.
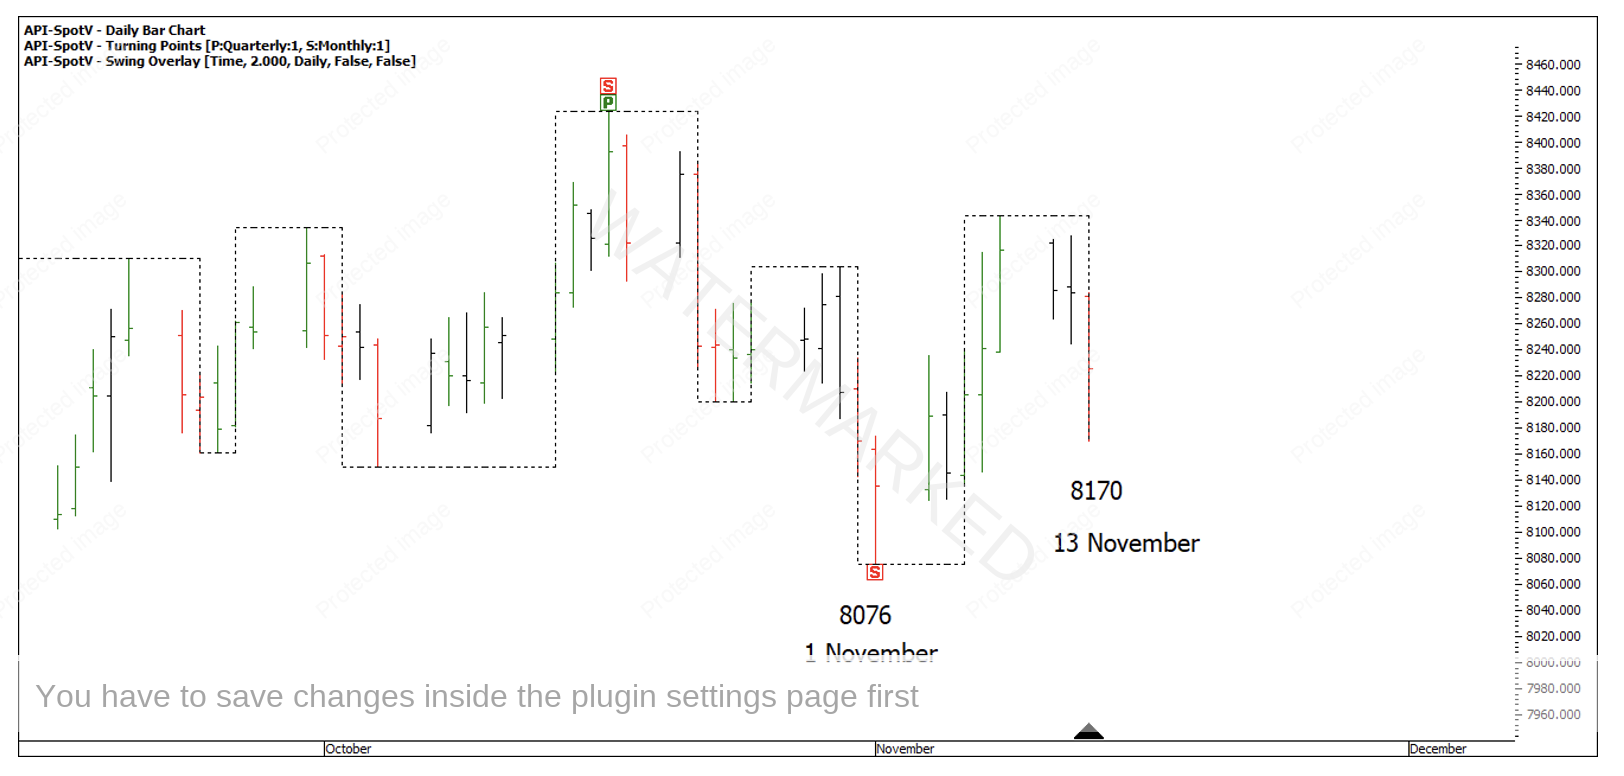
Chart 1 – 2 Day Overbalance in Price and Retest
You want to see evidence of price support at Point A. In this instance the main support points were a 100% repeating 2 day swing range into a 62.5% retracement, sitting on old tops.
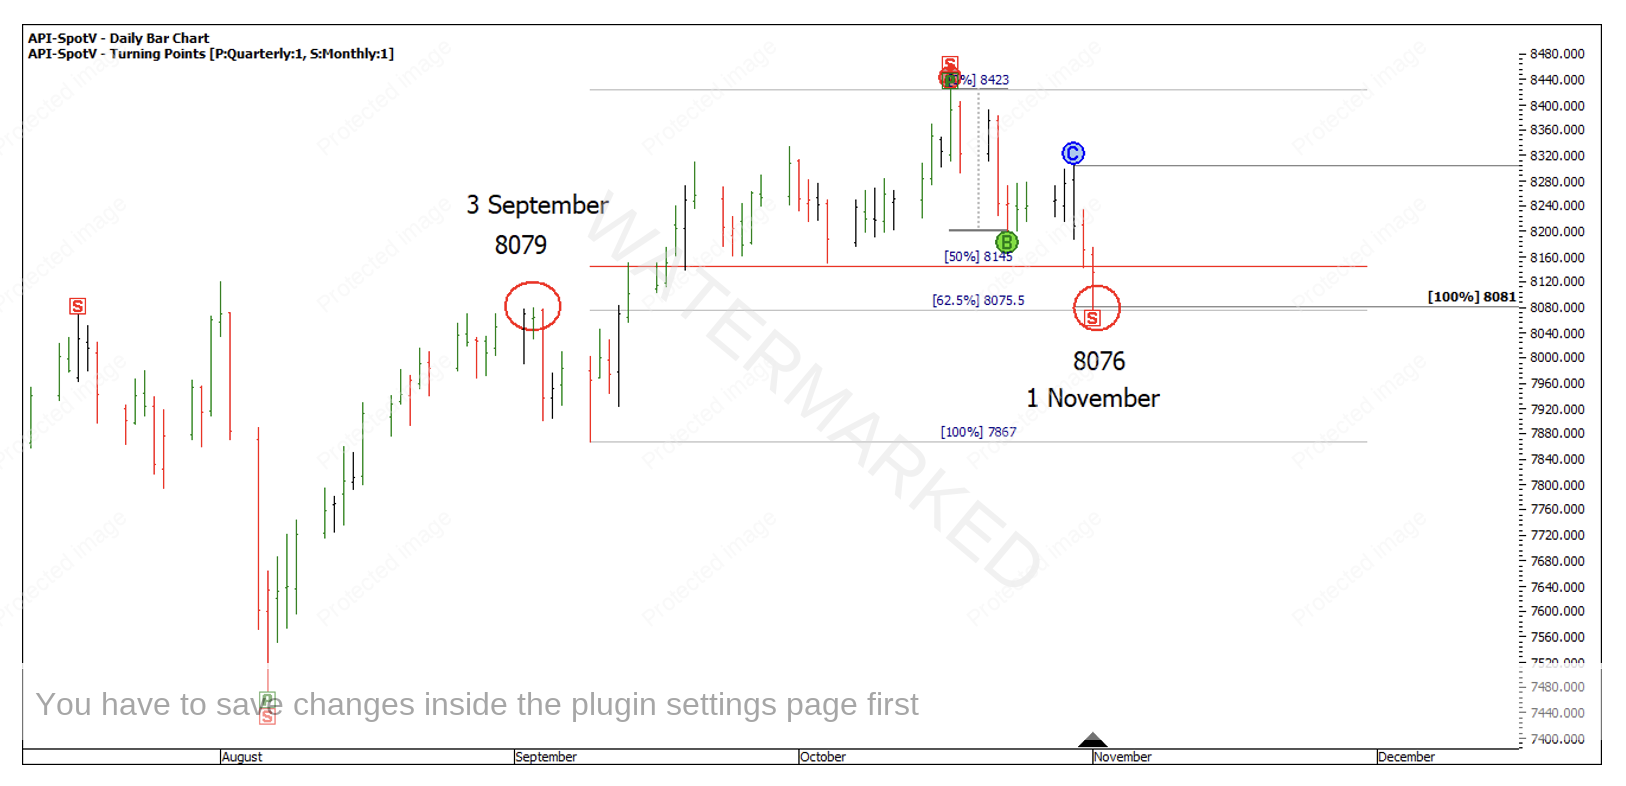
Chart 2 – 1 November Price Support
There’s also evidence here of smaller picture/ bigger picture expansion that is discussed in the Active Trader Program Online Training under the Advanced Ranges Resistance Cards section.
The first weekly swing found support on the 33.3% retracement level.
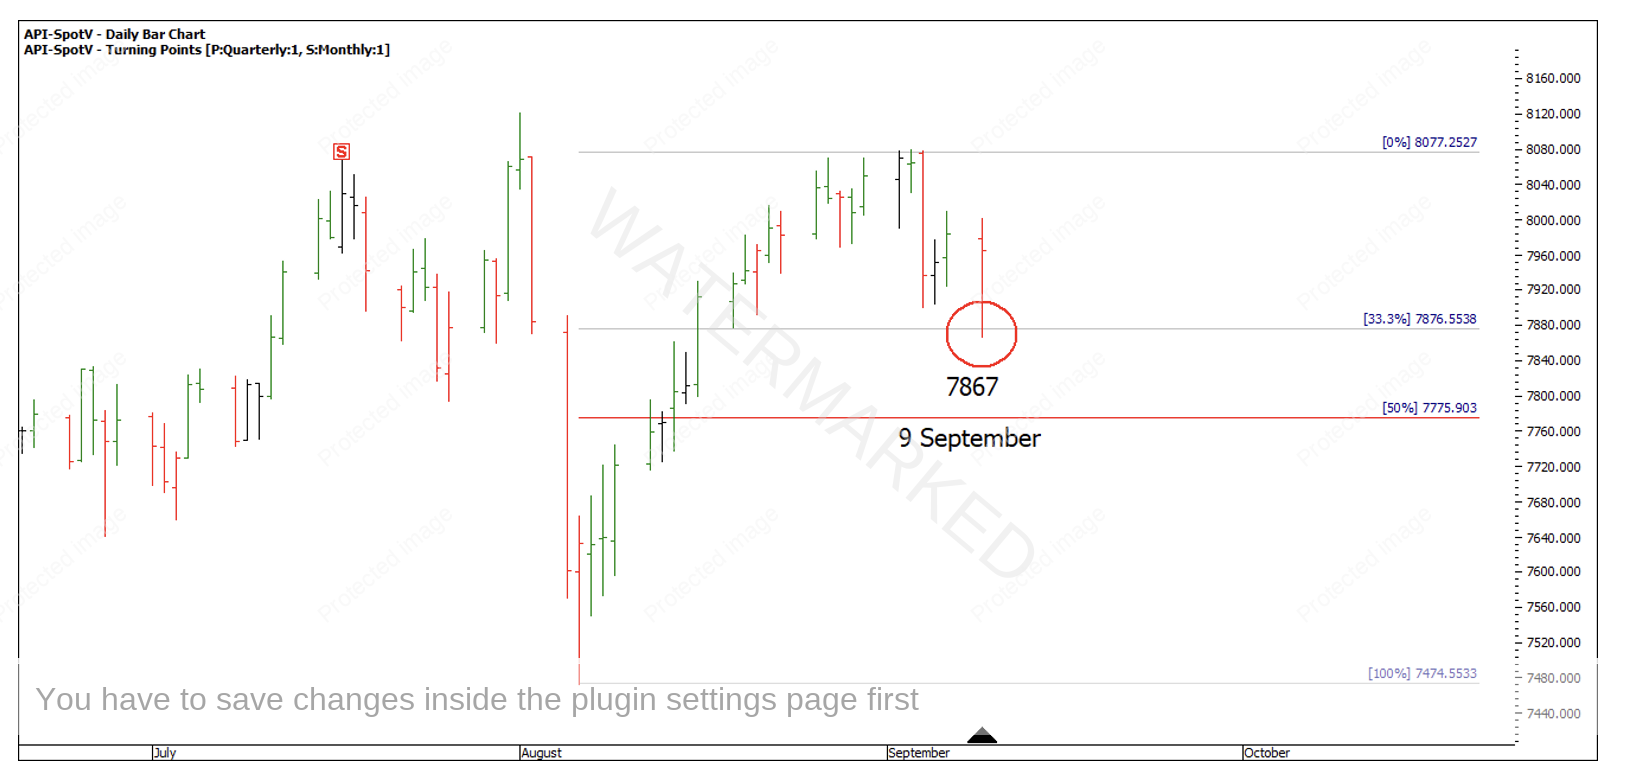
Chart 3 – Weekly Swing Retracement
The bigger picture monthly swing also found support on the 33.3% retracement level.
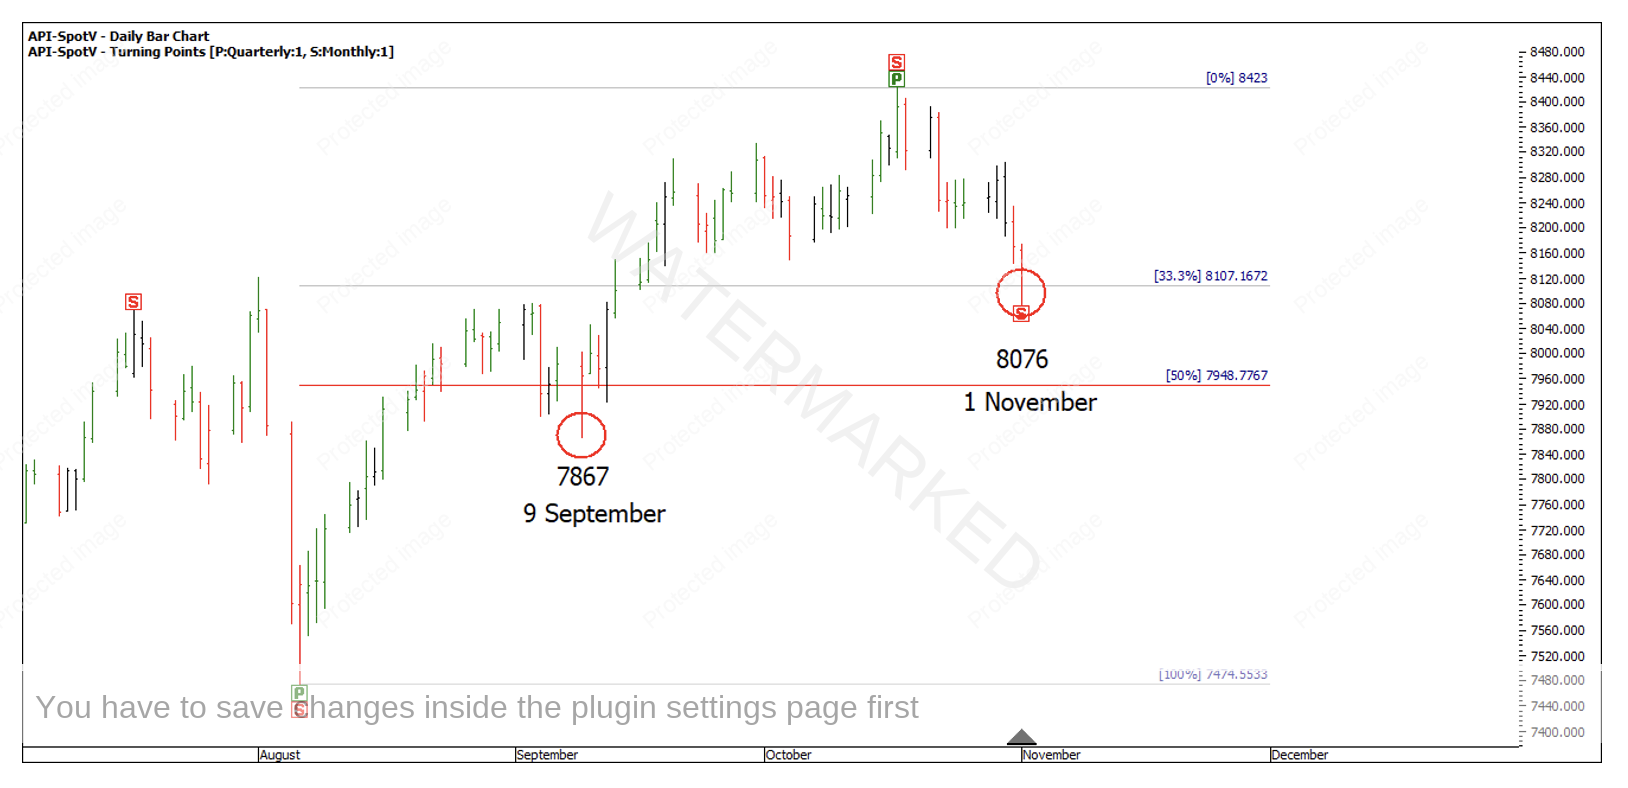
Chart 4 – Monthly Swing Retracement
This is potentially enough to have you keeping your eyes on the market even though the weekly swing chart was looking very bearish at this point.
After the 1 November low, the SPI put in a 2-Day Overbalance in Price followed by a contracting range into 13 November which we can analyse for price support and what type of entry was achievable.
The 13 November low was 8170. Looking at Chart 5 below, 50% of the previous weeks swing range was 8169.5.
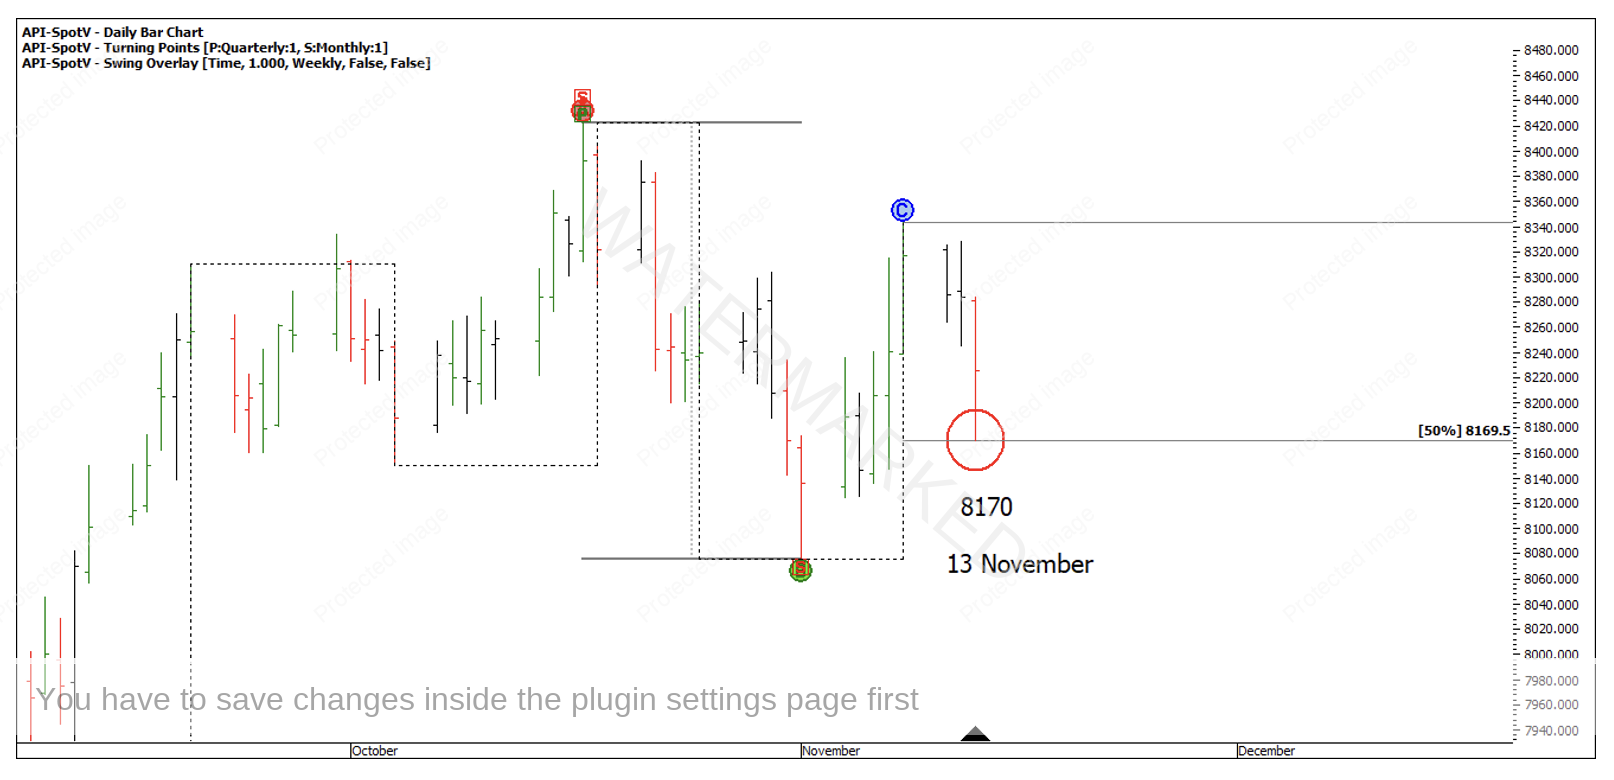
Chart 5 – SPI Retest Cluster
200% of the daily First Range Out gave 8170, to the point! There was also a 62.5% retracement at 8176.
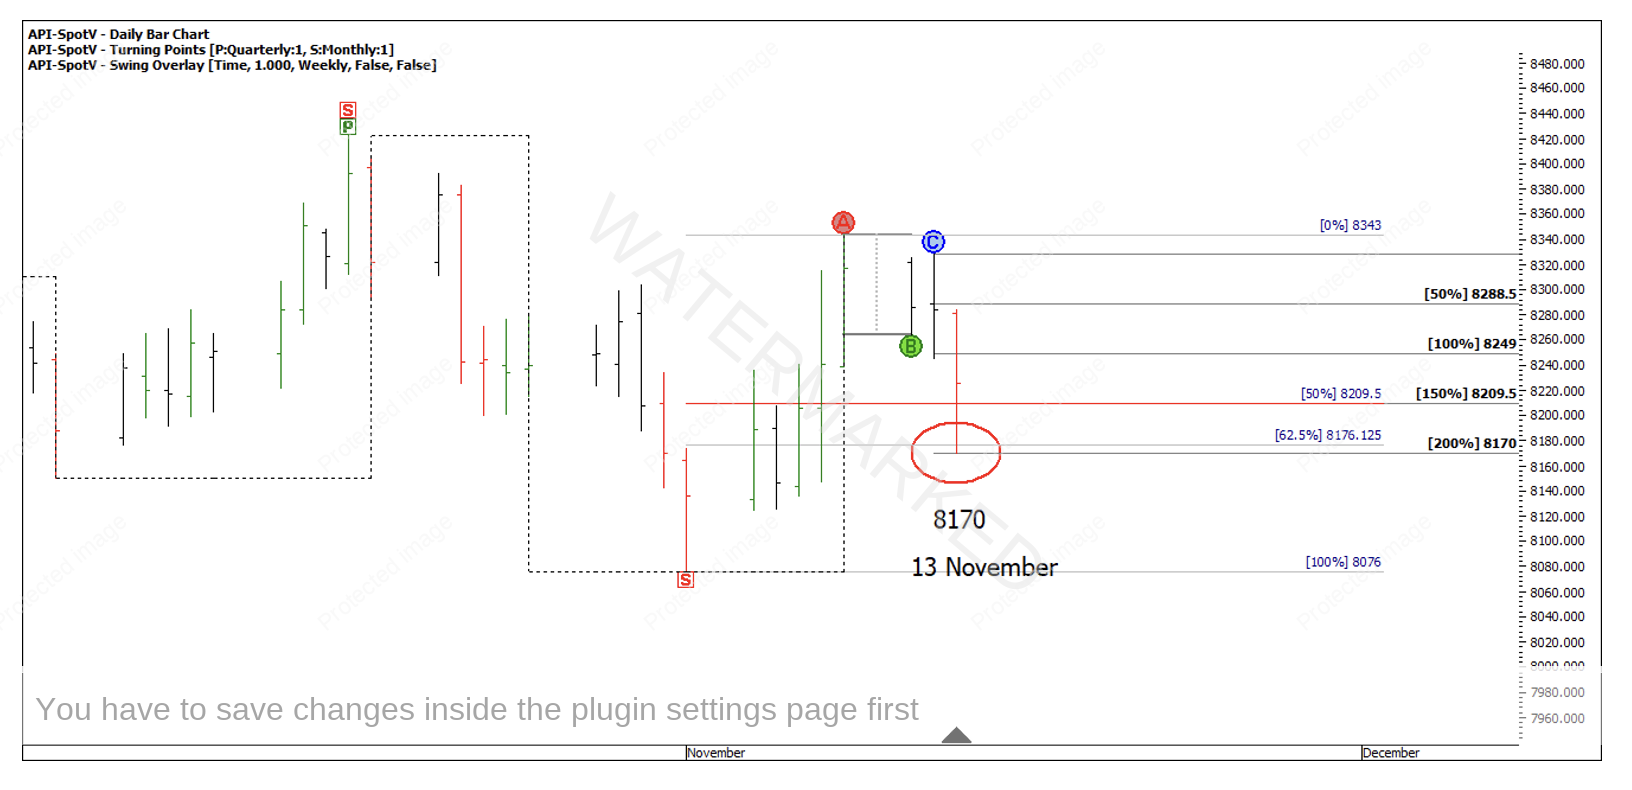
Chart 6 – SPI Retest Cluster
If we look at the 4 hour bar chart, I can break down the last daily swing range and look for further milestones to add to the cluster. You can see the 4 Hour First Range Out, was also the daily First Range Out that went to 200%.
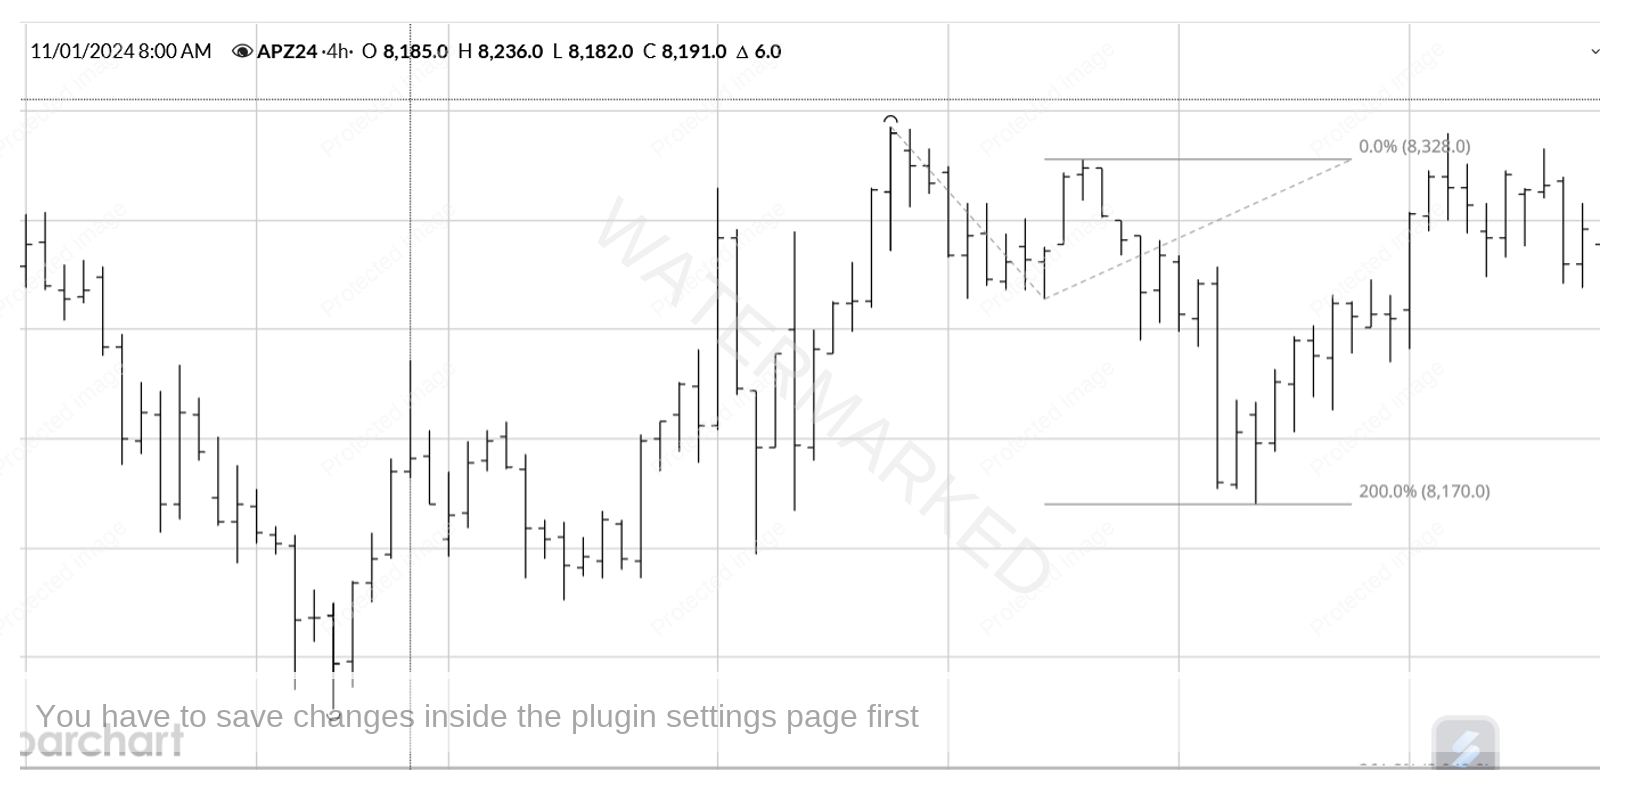
Chart 7 – 4 Hour Bar Chart
The last 4 hour swing into the low went to 125%, a slightly expanding range. This is a clause I have written into my trading plan, either the 4 hour swing chart has to be equal or contracting into Point C or 200% of the First Range Out (like above). This then allows me to take a trade as the 4 hour swing chart turns up.
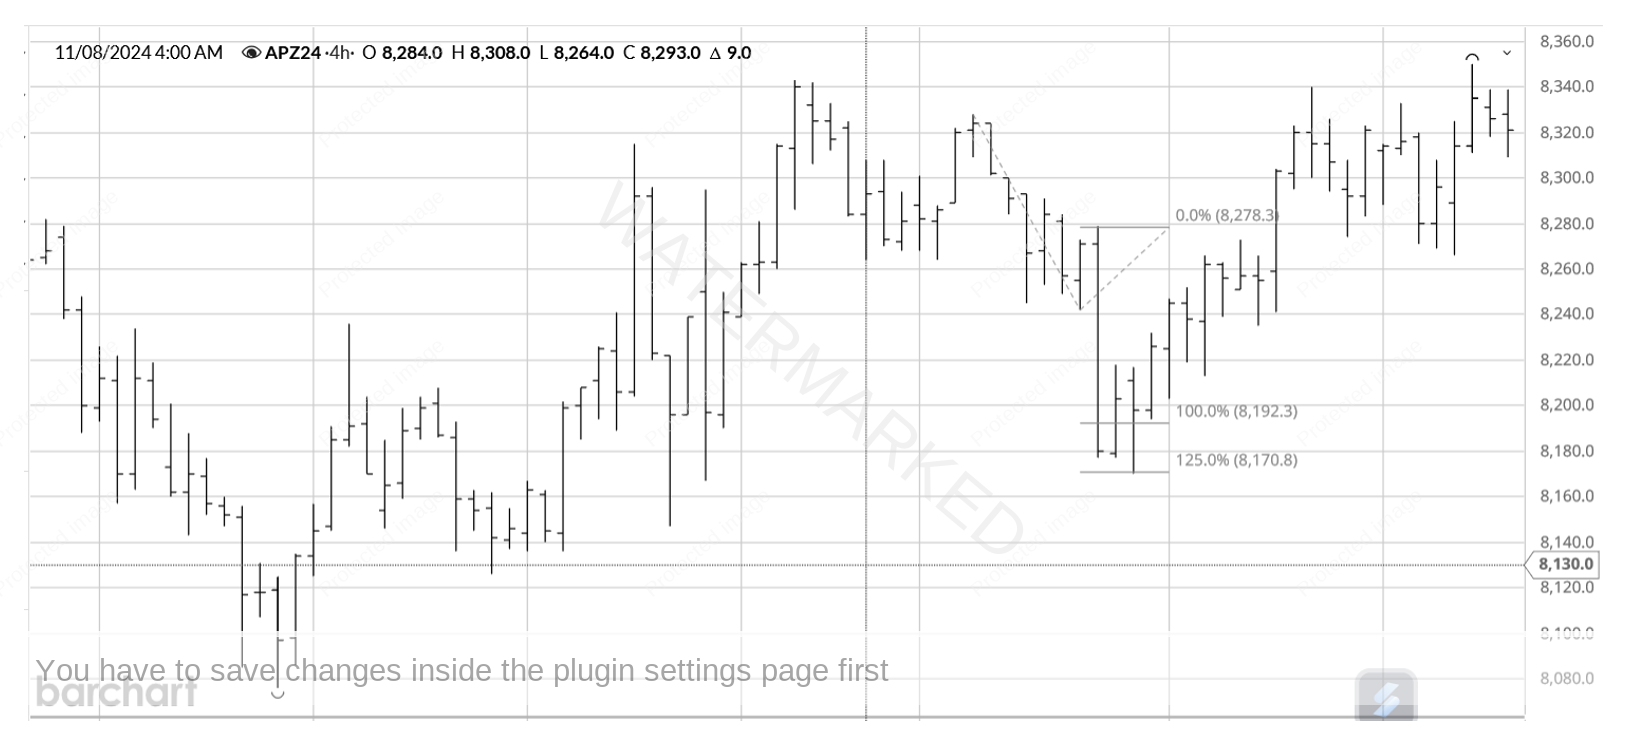
Chart 8 – Last 4 Hour Swing Range
If the above criteria is met, then I can drop down another time frame into a 1 hour chart and break down the last 4 hour range for further signs of completion. There were two sections into the low with the second pulling up just short of the 50% milestone, a good sign for the bulls.
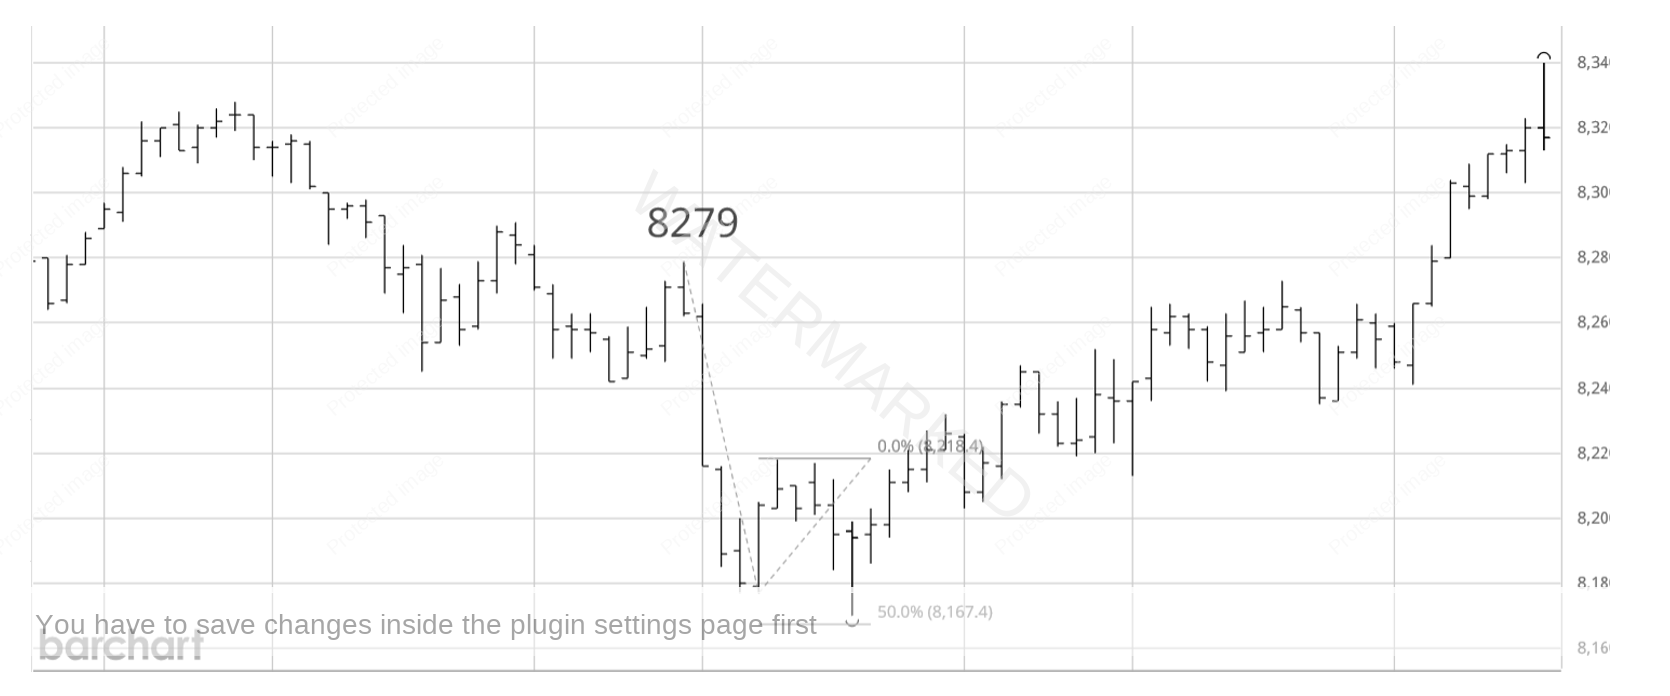
Chart 9 – 1 Hour Bar Chart
However, there was also a little 1 hour First Range Out that shows a 250% milestone at 8169.5!
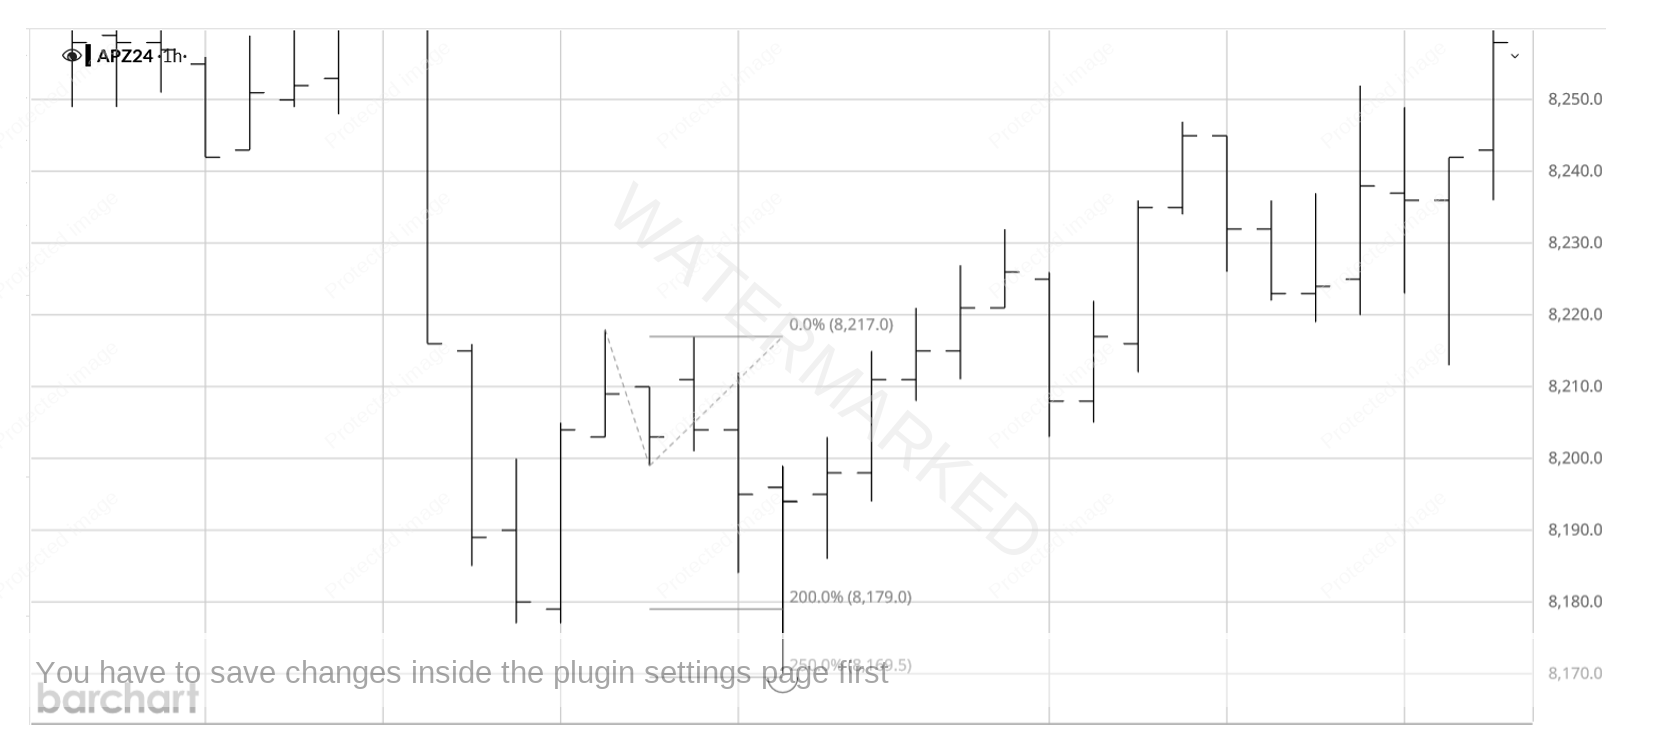
Chart 10 – Last 1 Hour Swing Range
My trading plan says I can take an entry on the turn of the 1 hour swing chart if there is either an equal or contracting 1 hour swing range into the turn OR 200% (or more) of the First Range Out. In my experience and testing, the further past 200% of the First Range Out the market goes, the higher the probability of a turn.
With an entry at 8200 and a stop at 8169, the 1 hour entry would give you 31 points of risk.
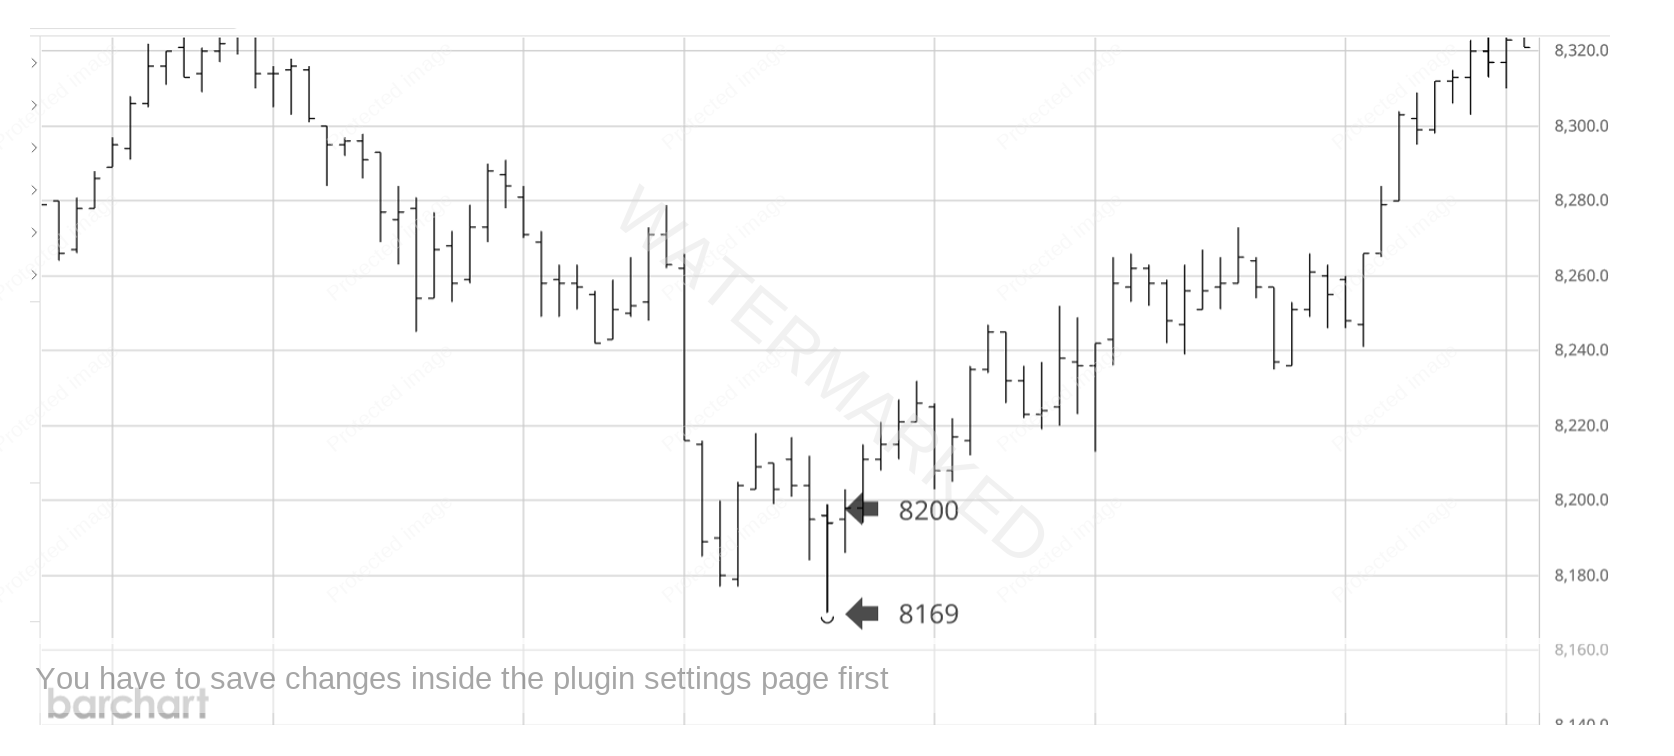
Chart 11 – 1 Hour Entry bar
Breaking down the last 1 hour swing you can see it was made up of two, 15 minute swings, with the last swing range falling 2 points short of the 100% milestone and making it a contracting range. You could legitimately take an entry as the 15 minute swing turned up at 8189 and a stop at 8169 with 20 points risk.
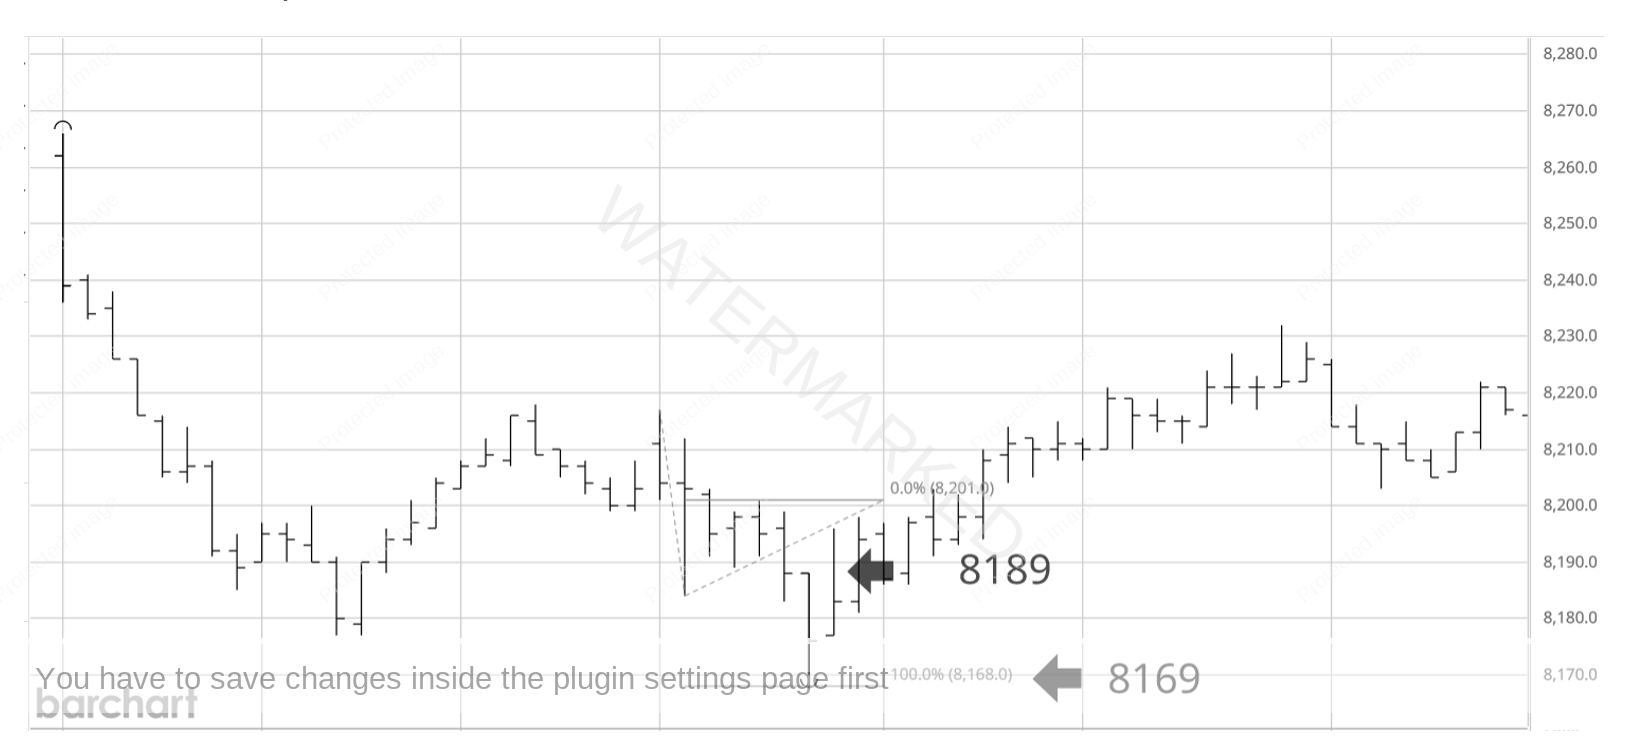
Chart 12 – 15 Minute Entry Bar
Because the last 15 minute swing is contracting, you could drop down to a 4 minute chart and look for further signs of completion or a contracting range to take an entry with a smaller risk.
I shall stick with an entry on the 15 minute swing chart, because you could easily achieve greater than a 10 to 1 Reward to Risk Ratio if exiting at the old top at 8423, or lock in good profit and let the market do its thing.
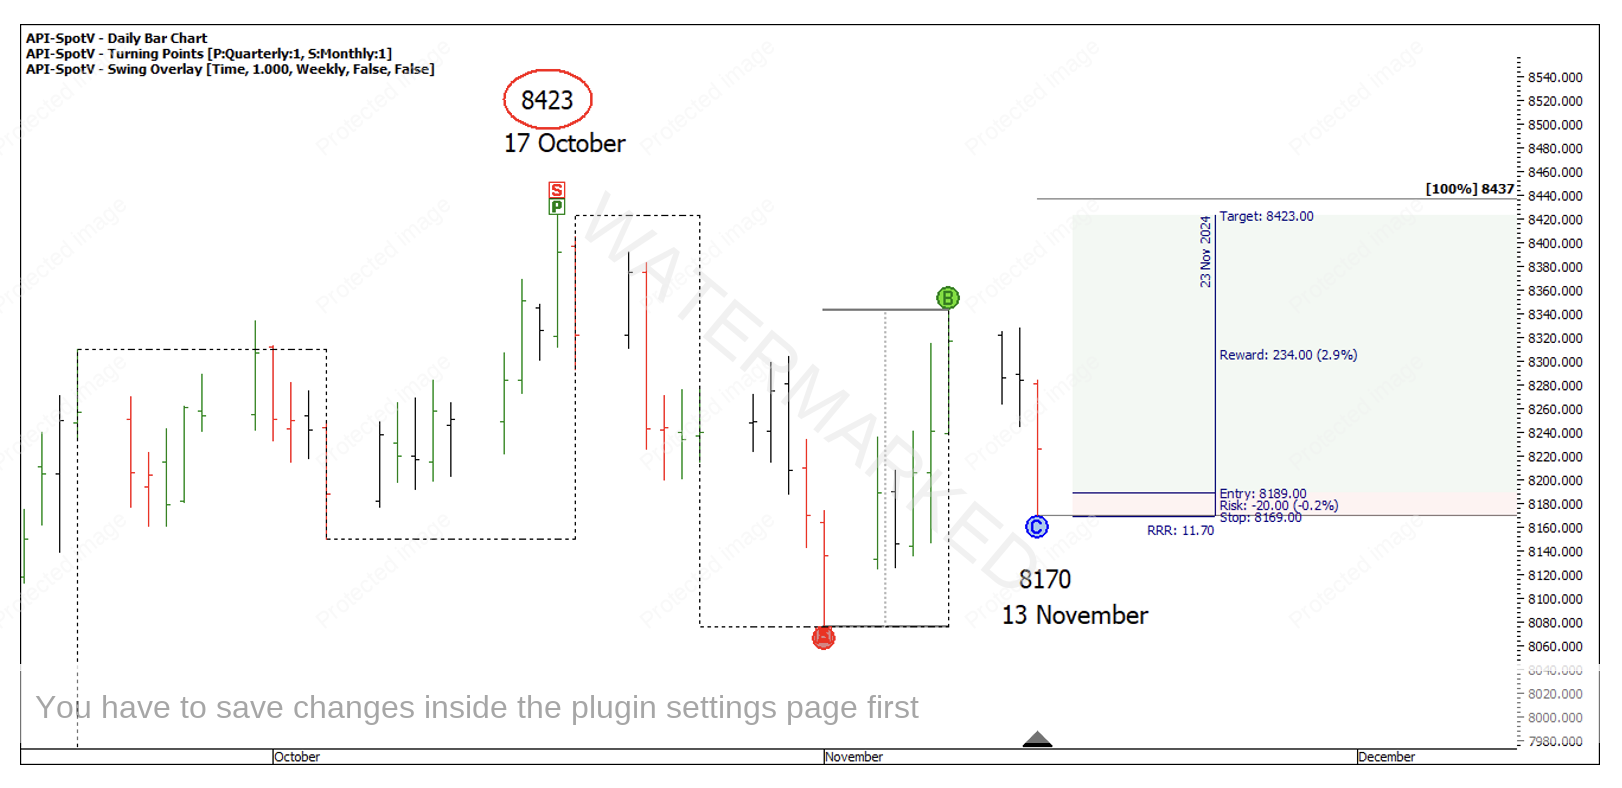
Chart 13 – 15 Minute Entry Reward To Risk Ratio
Happy Trading,
Gus Hingeley