Potential on the Nasdaq
In last month’s article ‘The Magic of Milestones’, I wrote about double tops on Gold that consisted of two 200% milestones that formed part of the cluster. In this month’s article, I’ll be looking at another market that has a potential cluster that also includes two 200% milestones.
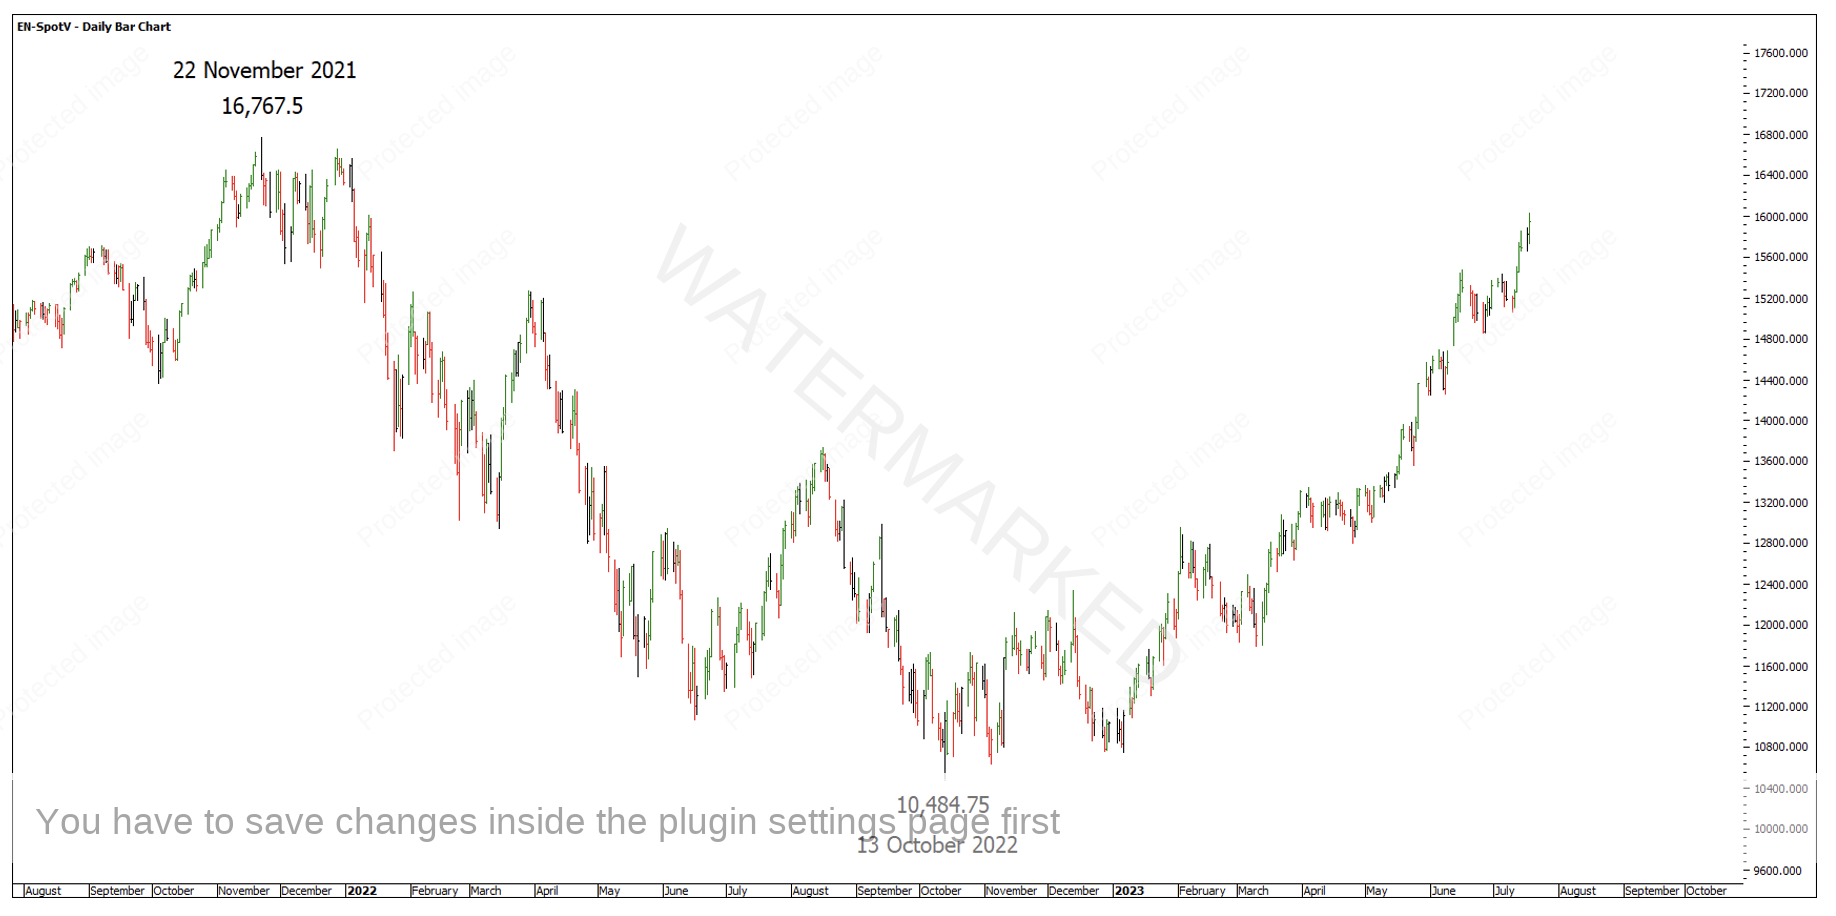
Chart 1 below shows the current position of the E-Mini Nasdaq 100 (EN-SpotV in ProfitSource) and the nicely trending market it has been during 2023.
Chart 1 – Nasdaq 100 – EN-SpotV
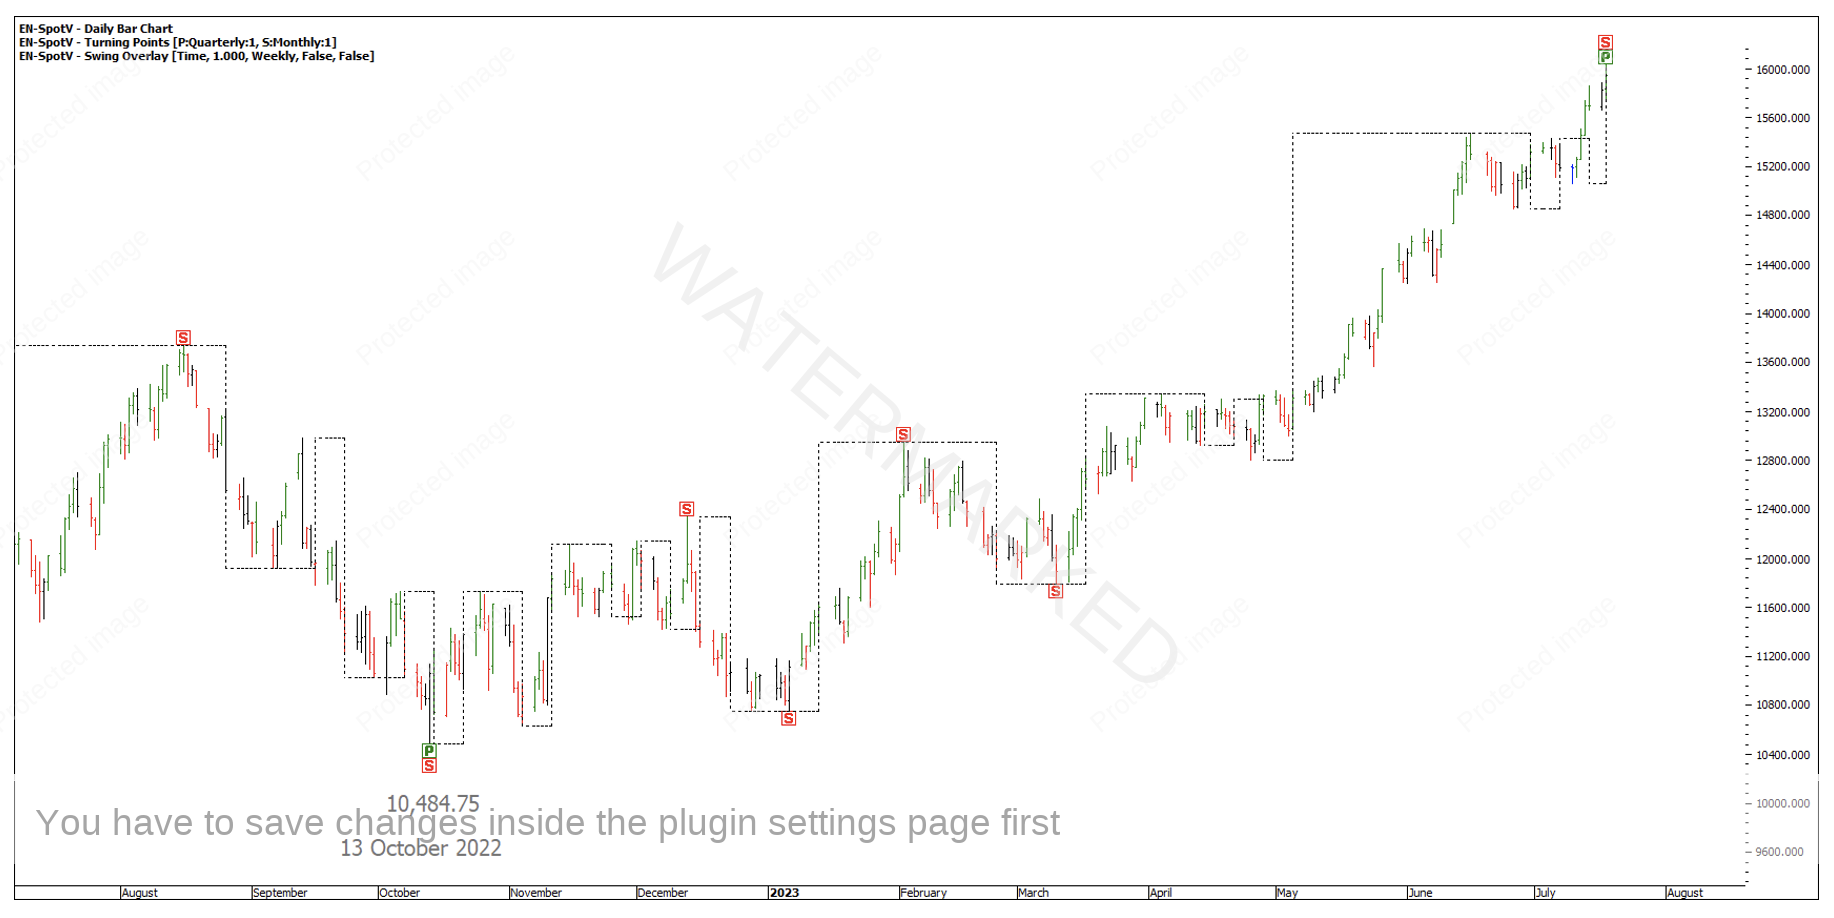
By layering on the quarterly and monthly turning points, followed by the weekly swing overlay, I get a good picture of the position of the market and can start measuring the ranges using the ABC Pressure Points tool in ProfitSource. This is shown in Chart 2 below.
Chart 2 – Nasdaq 100 Turning Points and Weekly Swing Overlay
At this point, I’ll leave you to find the following swing ranges for yourself, although I have left the clues below.
- 200% of a ………..…… swing range = 16,192.5
- 50% of a ………………. swing range = 16,191.25
- 200% of a ………..…… swing range = 16,220.25
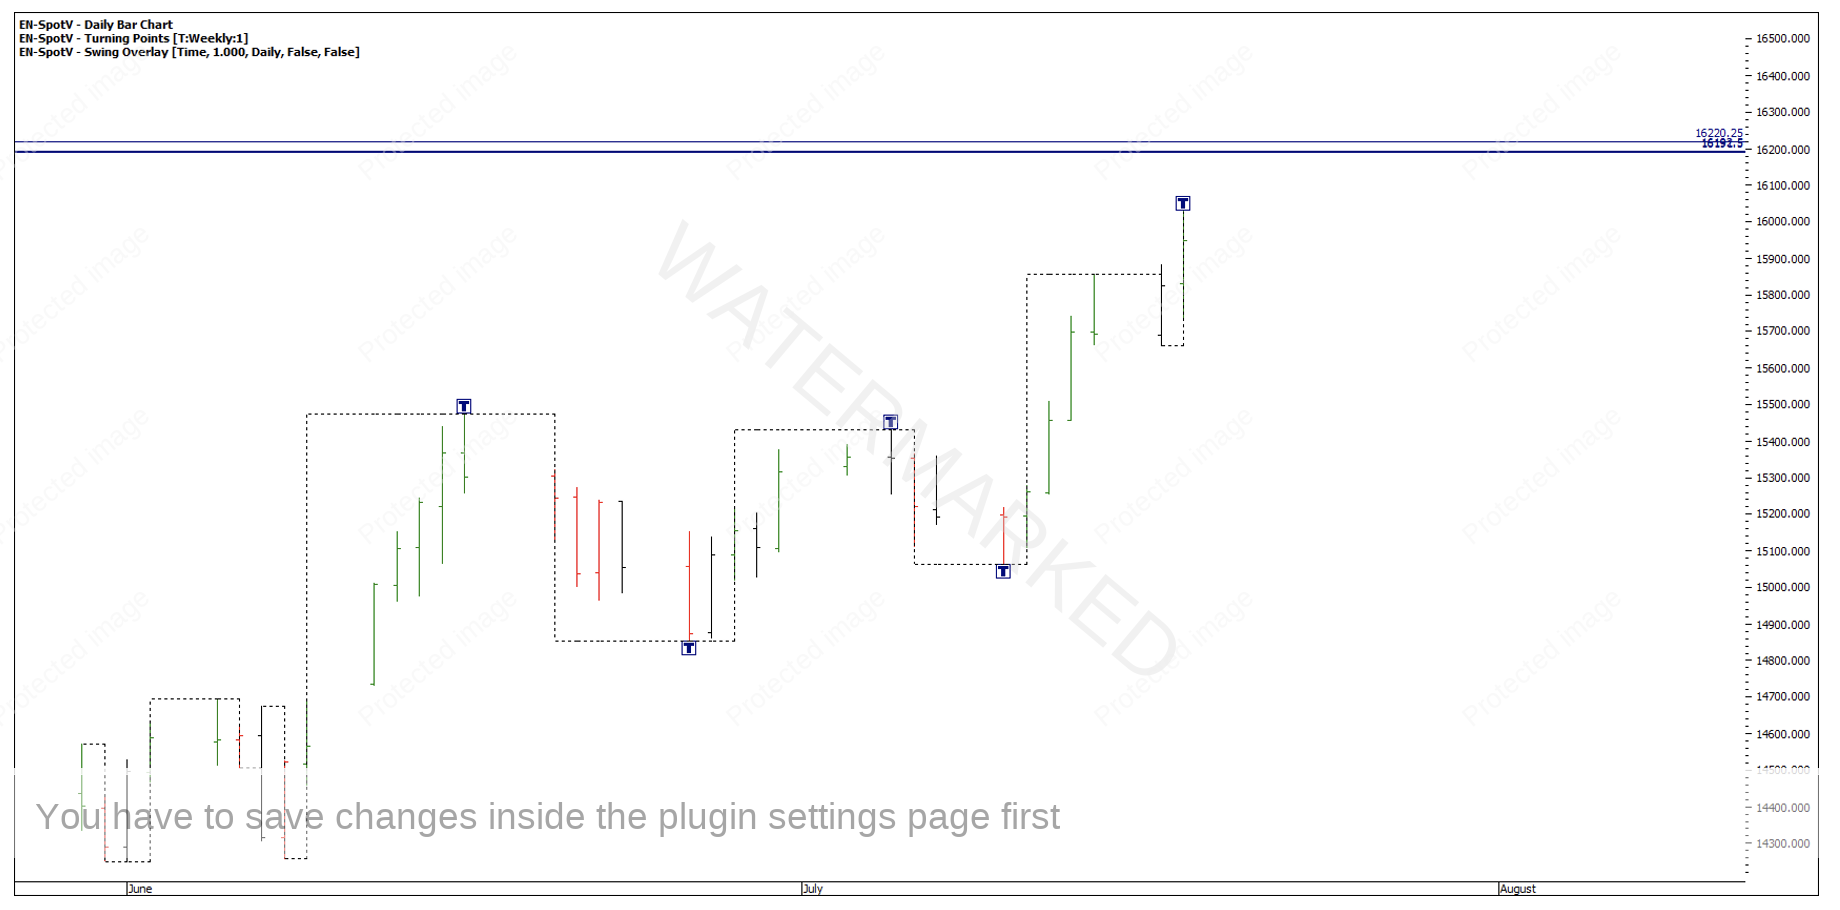
None of the above are tricky. All swing ranges are on a monthly, weekly or daily time frame! However, we are at present trading very close to this cluster. If I now put the weekly turning points on and the daily swing overlay, we can see that we are in a second daily swing leg up within a second weekly swing range up.
Chart 3 – Weekly Turning Points and Daily Swing Overlay
Before I go on, I want to make my disclaimer! This is only a potential setup but is one we can all watch as it unfolds. However, as always, the market has the ability to unfold in a variety of different ways. Some examples of how it might play out include:
- The cluster doesn’t get hit.
- The market goes straight through the cluster.
- The market reacts off the cluster for a short duration then breaks back through it to the upside.
- It reacts off the cluster for a weekly swing pull, breaks back up through the cluster as a false break, then continues on down.
- Hits the cluster and goes painfully sideways for a length of time.
- Hits the cluster and gives a great trading opportunity.
If you’re someone who really struggles to pull the trigger to take a trade, then I hope the above potential scenarios haven’t given you negative feelings towards finding a setup. If you are on the opposite end of the trade-entering spectrum and only require the market to be open to take a trade, then the above is a gentle reminder that no cluster is a guaranteed trade by any means. This is just a potential cluster that may call the end of the monthly swing and will be fun to watch and discuss in this month and next month’s article.
Moving on, the analysis is not done yet. I would like to see at least one more milestone, if not another two or more milestones lining up for added evidence that this is a cluster worth trading.
Then you need to decide, what needs to happen before you either take a trade or let this one go? Either way, this is a good case study to watch unfold as it has the base components of a potential setup. However, it still needs a bit more in my opinion. So, ask yourself, what do you need to see happen before you would consider trading this setup if at all?
For me I would like to see:
- A major milestone from the last daily swing up to add to the cluster and/or,
- A contracting daily swing with at least one major milestone from the 4-hour swing chart adding to the cluster and/or,
- At least one contracting 4-hour swing into the cluster.
You must have your own reasons for taking a trade and your own specific trading plan.
If nothing happens here, then no harm done. It’s just one setup that didn’t come to fruition, which there are plenty of. However, this is a very important part of the business, stalking trades and being right on top of them at the critical time. The goal is to weed out the better setups, rather than trade every potential setup that comes along.
Happy Trading,
Gus Hingeley


