Power Ranges
I’m not referring to the American superhero franchise, although the power of ranges never ceases to amaze me. Ranges, combined with Gann’s Sections of the Market can be a powerful trading combination.
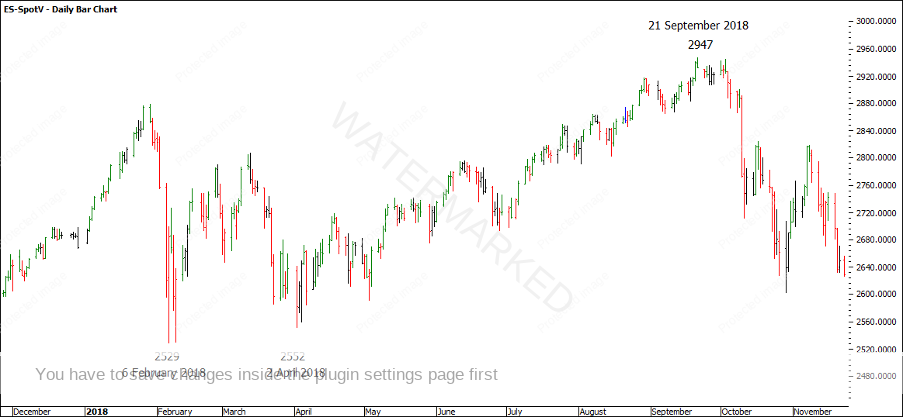
Take for example the run up into the 21 September 2018 top on the S&P500, ES-Spot V in ProfitSource.
Chart 1 – 21 September 2018
Looking at the ranges of this move above is yet again a wonderful example of ranges repeating and multiples of ranges calling a yearly top. I won’t spoil the fun and label them all for you but I’ll give you a few clues that you could verify for yourself:
- 150% = 2943
- 100% = 2947.25
- 200% = 2948.5
- 100% = 2937.75
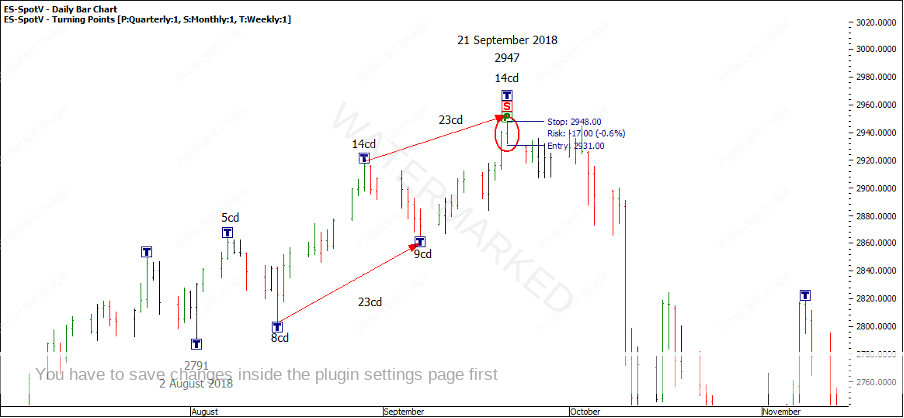
21 September is also one of our key seasonal dates, but I also notice a nice balancing of time on the weekly swing chart. To top it off, the market gave a clear signal bar and a very low close.
Chart 2 – Balancing Time
If we look to enter as the daily swing chart turns down with an entry at 1 point below the low of the day at 2931 and a stop at one point above the high of the day at 2948, it would give a total risk of 17 points on the trade.
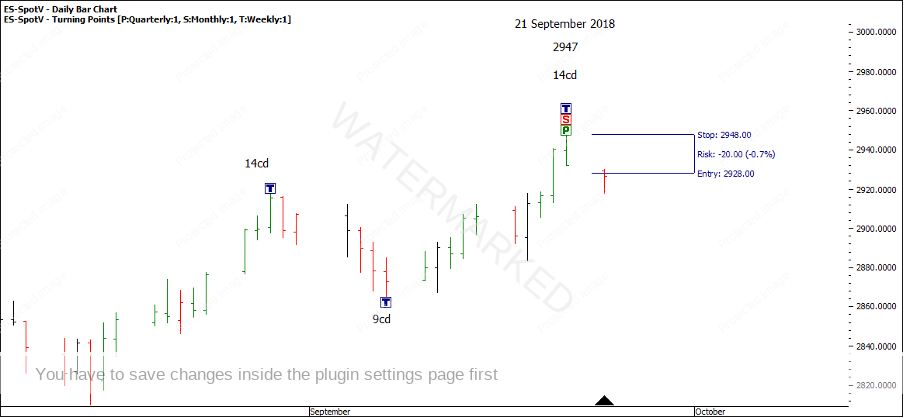
The market gapped down the next day on entry and opened up at 2929.5 points. If you were watching the open, you could have entered short the openers rule. I’ll use an entry figure of 2928 which would now be a 20 point risk for this trade.
Chart 3 – Short the Openers Rule
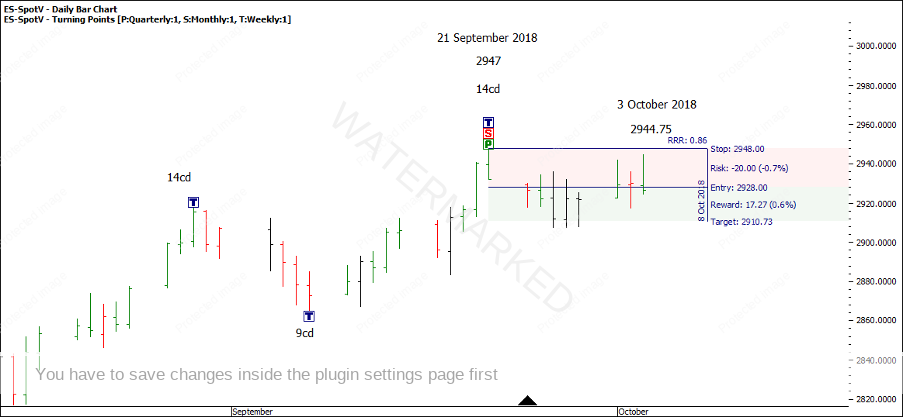
Nearly 2 weeks later, the market has only managed to go sideways. However, on 3 October another signal bar presents itself, only this time after a contracting daily swing up. This would also be a legitimate place to enter.
Chart 4 – Signal Bar
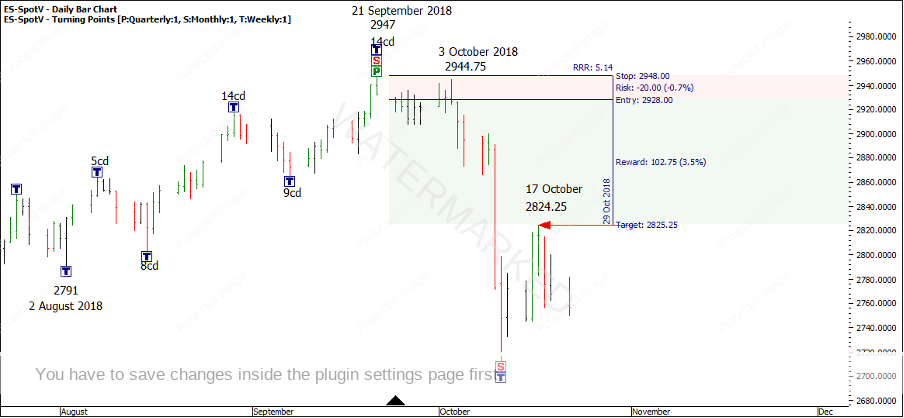
Once the market moves away from our point of entry, we could look to manage stops on a 2 day swing chart.
On 22 October, a 2 day swing top is confirmed triggering us to move our stop down 1 point above the high of the 2 day swing at 2825.25, locking in a 5:1 Reward to Risk.
Chart 5 – Confirmed 2 Day Swing Top
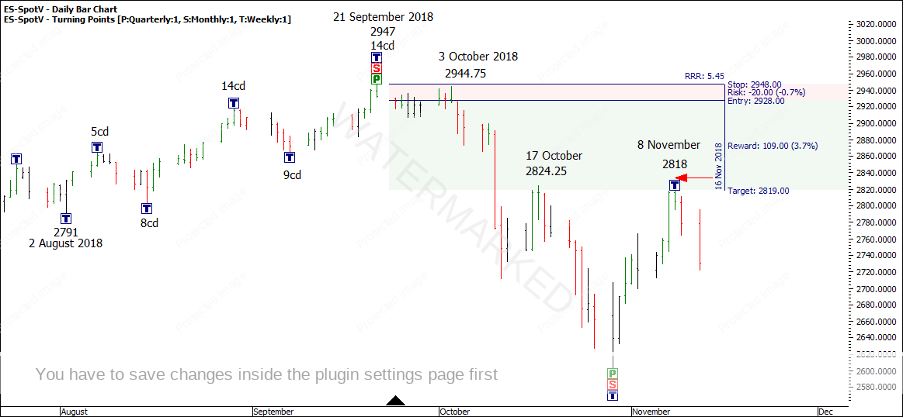
On 12 November after another confirmed 2 day swing top, you can again move your stop down one point above the high of the 2 day swing top to 2819, locking in only a marginally better 5.45:1 Reward to Risk.
Chart 6 – Confirmed 2 Day Swing Top
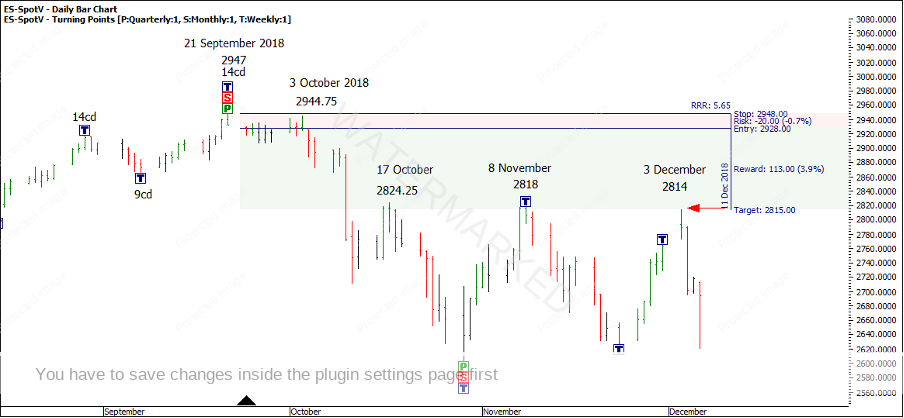
On 6 December you can once again move your stop down above the 2 day swing top to 2815 locking in a 5.65:1 Reward to Risk.
Chart 7 – Confirmed 2 Day Swing Top
By this stage you may be feeling a little disappointed with your trade, that after nearly 2 months you still have only locked in less than a 6:1. This highlights a great point that large Reward to Risk Ratio trades are easier to take when we look to enter on a smaller time frame than a daily swing such as 4 hour or 1 hour bar.
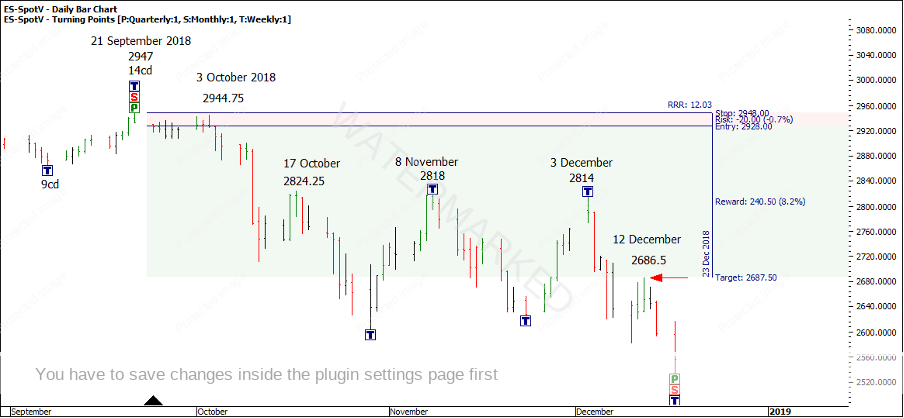
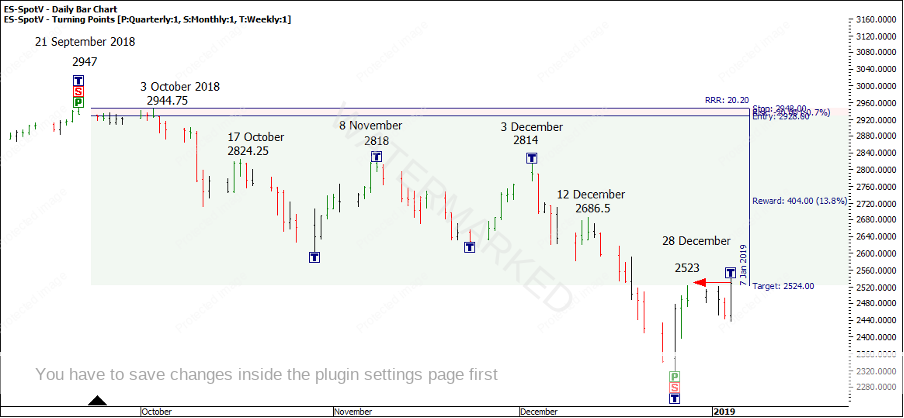
Fast forward to 17th December, the next 2 day swing top is confirmed you could move your stop down to 2687.5 locking in a 12:1 profit.
Chart 8 – Confirmed 2 Day Swing Top
On 3 January 2019, the market gave you another 2 day lower swing top, therefore you could move your trailing stop to 2524 and now locking in a 20:1 Reward to Risk Ratio. On 4 January, the market put in a large outside day and you would have finally been stopped out of your trade.
Chart 9 – Stopped Out
An estimated entry of 2928 and exit at 2524 gave a total of 404 points of profit. Assuming a $10,000 account and risking 2.5%, gives us an allowable risk of $250 to calculate the position size. However, we need to take into consideration we’re buying in US dollars.
At the moment, roughly $1US = $1.3422 AUS. So to recalculate your risk into $US, $250 x 1.3422 = $335.55! This now exceeds our 2.5% risk and therefore, we need to divide $250 by 1.3422 to adjust risk which equals $186.26.
$186.26 divide by 20 points (risk on the trade) = 9.3. Assuming most brokers offer $1 per point you could now trade using $9 per point as your position size.
To check this, 9×20 = $180. $180×1.3422 = $241.59
Therefore, a total of 404 points x 9 = $3636 x 1.3422 = $4,880.23 profit.
Happy trading,
Gus Hingeley
