ProfitSource Tutorial
Saving Charts
Mastering a new software program can be a little daunting, but taking some time to learn the basics always pays off. This article focuses on some charting basics which are essential for all ProfitSource users – saving and (later) accessing a chart page. Let’s learn how to do this by way of an example. There are some easy and definitive steps, so let’s jump straight into it:
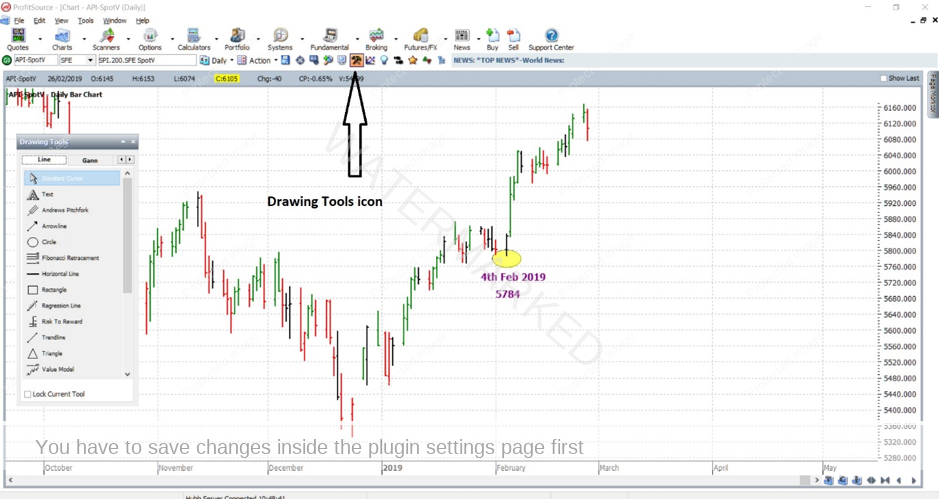
Charts -> New Price Chart -> Symbol: “API-SpotV” (this is the ProfitSource Symbol for the SPI futures chart page). Click OK.
Now, to make the chart your own, all you need to do is add something to it. How about some text for a recent turn in the market? To do this: Click on the Drawing Tools icon, which you will find in the toolbar above the chart page. This will bring up the “Drawing Tools” box. Then select “Text”. Then click anywhere back on the chart page, and start typing. As an example, I have added text for the date and price of the early February low. I have also added a circle – which can also be found in the Drawing Tools box. If you have done everything right so far, you will have seen something like the chart below:

So now that you have created it, what about saving it? There are two ways to do this:
Action -> Save Chart Page, or simply click on the adjacent “Disk” icon.
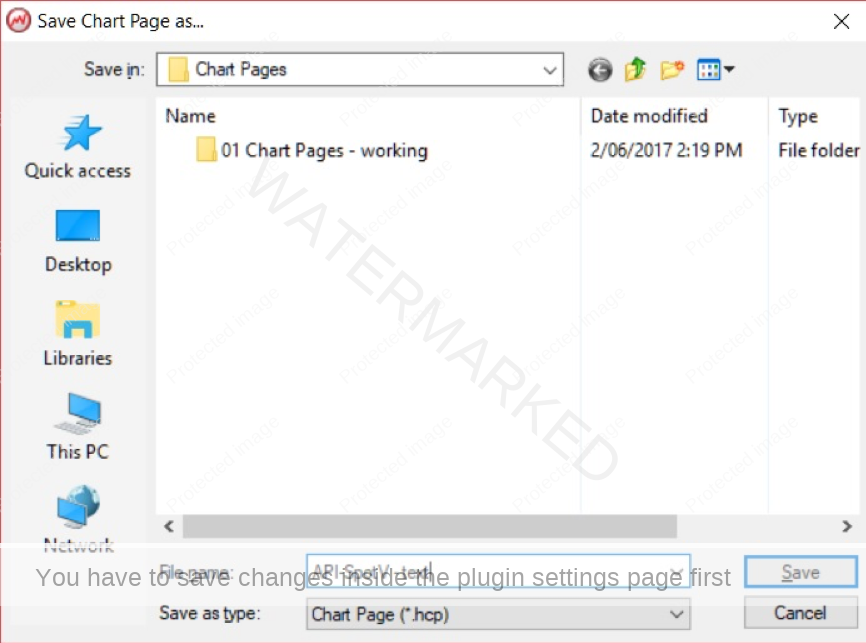
This will then bring up the “Save Chart Page as…” window. By default, it should have us at the “Chart Pages” folder – i.e. one of the folders on your computer’s hard drive, under your ProfitSource installation. It is worth noting that you are able to create your own subfolders and save/group charts into them to suit your own needs. But more on that later! For now, let’s give our new little chart a name – call this one “- text”. Click “Save”.

So now that you have saved a chart and closed
- Charts -> Open Price Chart. Select API-SpotV- text.hcp and click Open
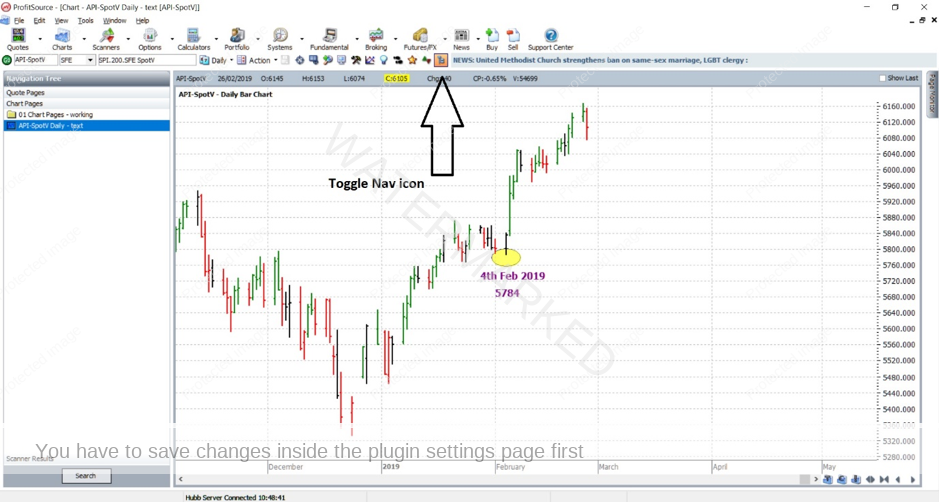
- The Navigation Tree. First time around, this one is a bit more complicated. To access this you first must have a fresh chart page open.
Any one will do: Charts -> New Price Chart. Enter any symbol (e.g.FXADUS ) and click OK. Then to access the Navigation Tree: click on the “Toggle Nav” icon which you will find in the middle of the toolbar directly above the chart page. This should bring up the Navigation Tree on the left-hand side of the chart page. There, click on “Chart Pages”. From there you should be able to easily navigate to and access your saved chart – in this case by double-clicking on “API-SpotV – text”.

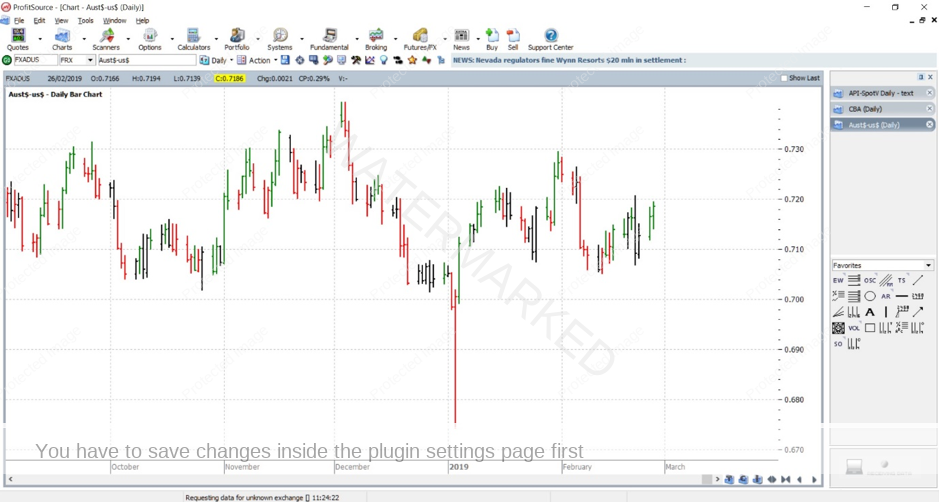
- The Page Monitor. You will access this from the right-hand side of the screen. It is very useful when you have more than one chart page open. In the image below, there are other chart pages open, and the Page Monitor is “Pinned” open. You can “Unpin” it (a little icon in the very top right corner) so that it only comes into view when you hover the mouse over it, saving you a little chart space to work with.

Work hard, work smart!
Andrew Baraniak