ProfitSource – Which Chart?
This month’s article takes the Cocoa futures market and helps us determine which ProfitSource chart to use for analysis, and which chart to use for trading. It can act as an example for chart selection in other markets.
For analysis, we generally use the SpotV chart. Each bar on this chart takes price data from the contract which is trading with the highest volume on that trading day. For example, let’s take a look at some of the data from the trading day which was the 11th August 2020 (the day before writing this article). Here are the volume figures for that day for the more “current” Cocoa futures contracts:
- September 2020 contract – volume of 16,025
- December 2020 contract – volume of 31,245
- March 2021 contract – volume of 11,220
- May 2021 contract – volume of 3,775
- July 2021 contract – volume of 2,251
- September 2021 contract – volume of 300
So obviously the Cocoa futures contract that traded with the highest volume on the 11th August 2020 was the December 2020 contract – this was 31,245 contracts. So, the SpotV chart, for the 11th of August, would have its price data for that trading day taken from the December 2020 contract.
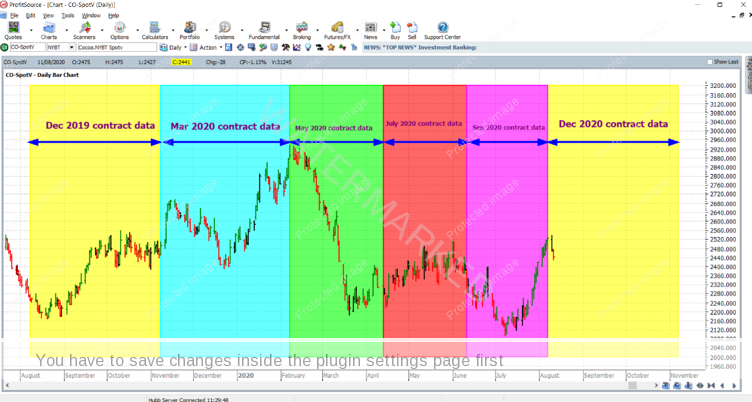
Now, this doesn’t mean that every day a different contract is trading with the highest volume. In fact here is the approximate contract volume pattern for the Cocoa contracts each year:
- From the 8th August to the 7th November the December contract will trade with the highest volume
- From the 8th November to the 7th February the March contract will trade with the highest volume
- From the 8th February to the 10th April the May contract will trade with the highest volume
- From the 11th April to the 10th June the July contract will trade with the highest volume
- From the 11th June to the 7th August the September contract will trade with the highest volume.
Below is an illustration of the above in the SpotV chart, CO-SpotV:
So how do we confirm, if not determine for ourselves this information about volume? What if we wish to observe likewise for another market? The answer is to go to the individual contract charts. For Cocoa:
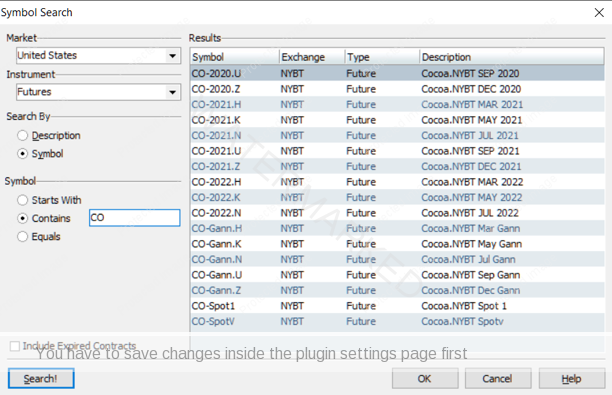
- For the July 2020 contract, the chart symbol was CO-2020.N
- For the September 2020 contract, the chart symbol is/was CO-2020.U
- For the December 2020 contract, the chart symbol is CO-2020.Z
- For the March 2021 contract, the chart symbol is CO-2021.H
- For the May 2021 contract, the chart symbol is CO-2021.K
- For the July 2021 contract, the chart symbol is CO-2021.N
…and so on. To reveal a list of such chart symbols we can use the Symbol Search window: Charts -> New Price Chart, click Search, then enter criteria as in the following example:
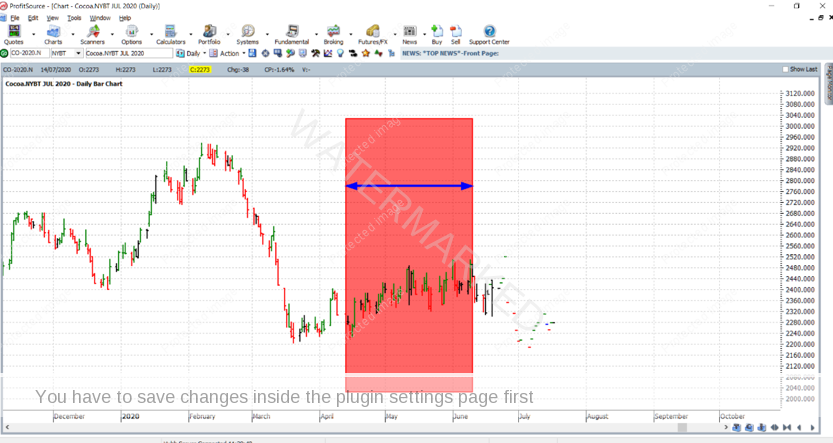
As an example, the chart below shows data which was solely for the July 2020 contract chart (CO-2020.N), and hi-lighted in red is the period for which this chart contributed data to the SpotV chart.
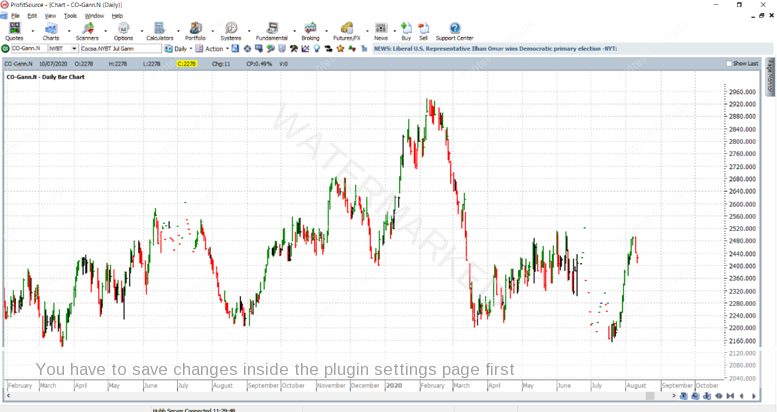
While the above chart for the July 2020 contract stopped providing trading data (as Cocoa for that contract has already physically exchanged hands), there is another type of chart for July Cocoa generally speaking – the July Cocoa Gann chart. Its chart symbol is CO-Gann.N and it is a continuous chart for all successive July Cocoa contracts, linked from one year to the next. There is also a similar chart for the other Cocoa contracts.
Notice above the periods where price data really thins out – this is right before the July contract within a given year completely expires and the Gann chart rolls to the July contract of the following year.
So obviously we have some charts at our disposal for analysis purposes, but what about the actual trading? The answer is similar. With the usual objective being to trade the contract with the highest volume, we can use the individual contract charts to help us make sure that we are choosing the right contract to trade when we are placing our orders. Don’t use the SpotV for your entry and exit parameters without double-checking them in the individual contract chart.
A few things to note:
Sometimes there can be a delay for confirmed volume figures to arrive in ProfitSource. This can be up to a day or two for many futures contracts.
ProfitSource is designed so that SpotV charts roll from one contract to the next only after three successive days of higher volume from the next contract. This is a safeguard against any anomalies in the usual volume relationships between the contracts currently available in a given futures market.
Work hard, work smart!
Andrew Baraniak


