Ready for Take Off
One of the many powerful tools I’ve used when it comes to setups is WD Gann’s 50% retracement rule.
Gann said:
“After an initial, sustained price move, either up or down, prices retrace to 50% (4/8) of their initial move. If the retracement exceeds 50%, prices should continue to the 62-1/2% (5/8) level, before a reaction occurs.”
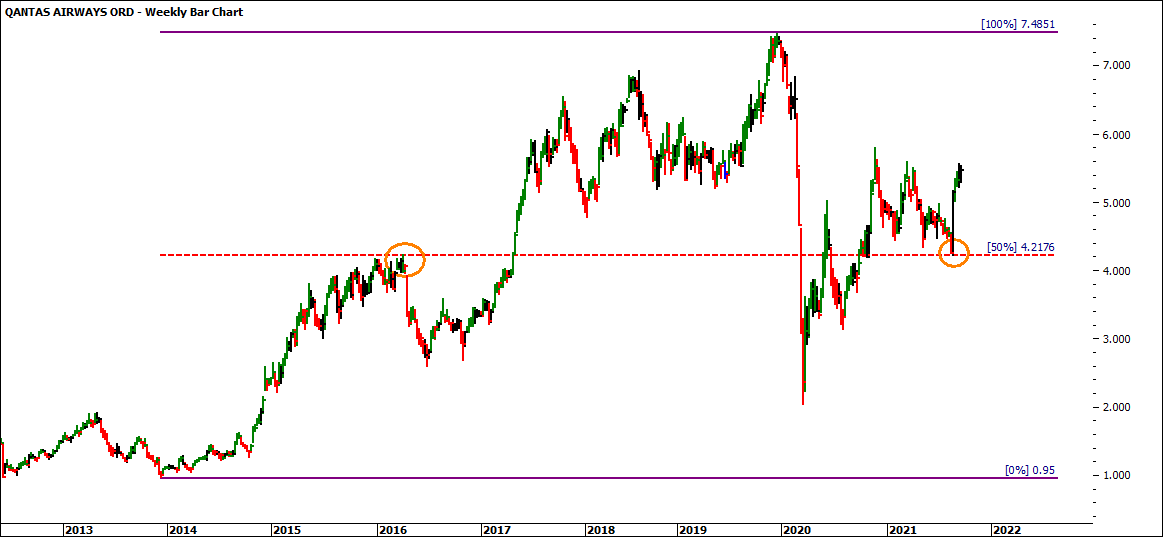
If we turn our attention to the weekly chart on Qantas listed on the ASX (ProfitSource Code: QAN), we can apply a major Ranges Resistance Card to the chart. The All-Time Low was in December 2013 at a price of $0.95. The All-Time High was 6 years later in December 2019 at a price of $7.46. This gives us a range of $6.51 ($7.46 – $0.95). That means the 50% level is at $4.20.
As you can see in the chart above the market was able to make an exact low on the 28th August 2021. But how were we meant to know this was going to be a change in trend?
The correct answer is we don’t know, but we can apply our wisdom and knowledge to the markets to have a high probability of being able to trade these setups. Just by knowing that $4.20 was 50% of the All-Time Ranges Resistance Card, it would be a place we should have been watching. From here, it is about having confidence in your other indicators to decide whether or not it is a high probability setup.
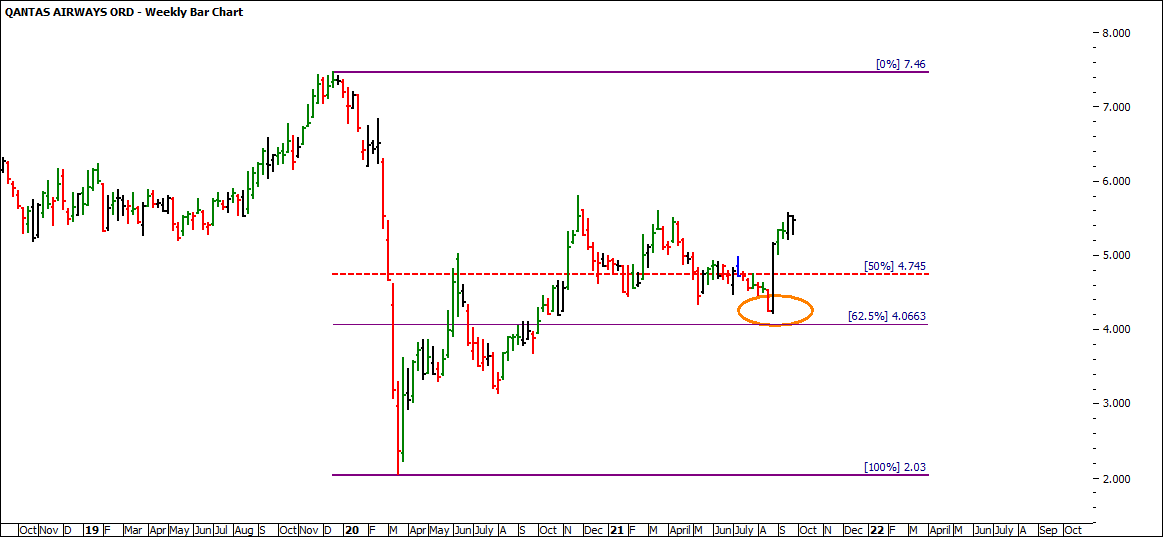
Let’s apply another Ranges Resistance Card to the chart from the All-Time High in December 2019 at a price of $7.46 and the COVID-19 low in March 2020 at $2.03, a range of $5.43 ($7.46 – $2.03). This means that the 50% level is at $4.74. While the market did not stop exactly at the 50% level, as per Gann’s comments:
“If the retracement exceeds 50%, prices should continue to the 62-1/2% (5/8) level, before a reaction occurs.”
In this case the market did not stop at exactly 62.5% or $4.07.
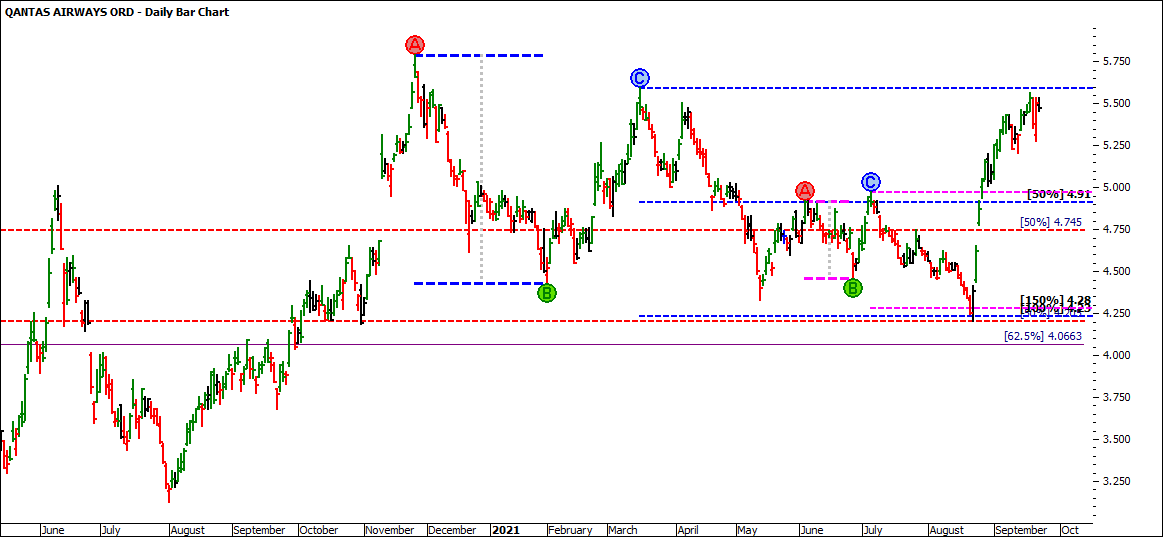
Using the ABC Pressure Points Tool and watching for prominent ranges repeating, the market produced two obvious ones that clustered with the 50% level at $4.20. While these ranges added more evidence to a potential change in trend at this point, the real value for this trading setup is watching potential entry strategies.
As previously mentioned, Gann always said not to get ahead of the market. Don’t guess if it is making a change in trend and be wrong. Wait until it shows a definite change in trend. You will be right when you form your judgment after a definite indication is given according to these rules.
Assuming at the end of trading on the 23rd August 2021 the market produced a reversal signal day. At this point, the above analysis may have represented enough evidence for you to be comfortable to place an entry point 1 point above the 23rd August high at $4.42. The stop loss would have been worthy of being behind the 50% level but someone who is more conservative could have chosen behind the 62.5% level. Therefore, the risk to the trade would have been close to 25-40 cents which is approximately 3x – 5x the Average Range (AR).
As an exercise, it is worth paper trading this set up to identify how you would have traded this low. As the market continues to move higher, what stop strategy would you have used and what was your Reward to Risk Ratio?
It’s Your Perception
Robert Steer


