Runaway Markets
One of the obvious markets of 2025 that has exploded to the upside is Gold. Love it or hate it, it’s a market that has more theories than a murder mystery and its participants can hold a variety of views in terms of what makes it tick.
Chart 1 shows how the upside move has been fast and powerful and has not offered a lot of pullbacks to assist with an entry. In fact, the last weekly up swing consisted of 9 bars.
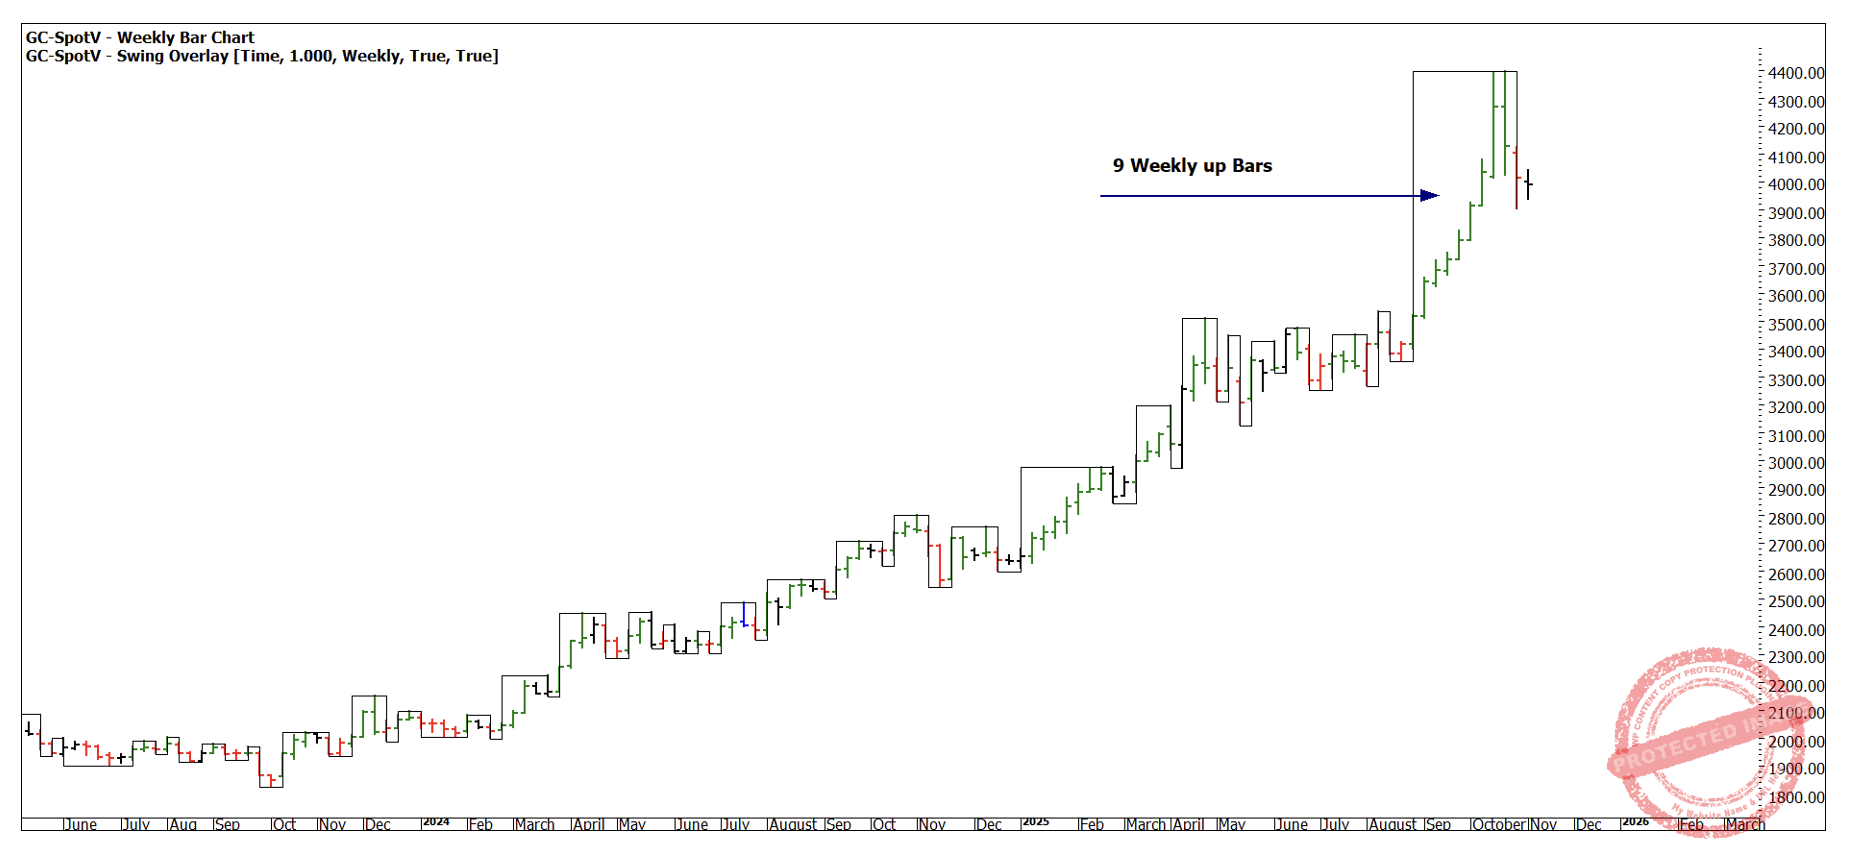
Chart 1 – Weekly Bar Chart GC-Spotv
If we examine the psychology of a market like this, in most cases the overriding emotion is FOMO. The fear of missing out (greed) means that many traders have potentially jumped in and in due course made some profits. This behaviour would not be listed as a high-performance attribute even though in this instance it paid off. I could detail countless examples of where just diving in on a market that’s moving doesn’t pay off but we often bias our thinking towards the most recent example we experience (recency bias).
The question we face now is, after a pullback, is now the opportunity traders have been waiting for? Of course, there will be buyers lined up for this, but our analysis needs to confirm there may be more potential upside to come, otherwise we are just allowing those already long to hand off their position to the weak money at what could be a top?
Chart 2 puts into perspective the two analysis points, using the First Range Out from 2018 into 2020 we see the price action has run 300% and provided what is currently short-term resistance that may or may not develop into something further.
Also of note is some basic time counts, the overall message is that this move has been fast but for those who are working with the Ultimate Gann Course you should see some aspects that warrant some further analysis.
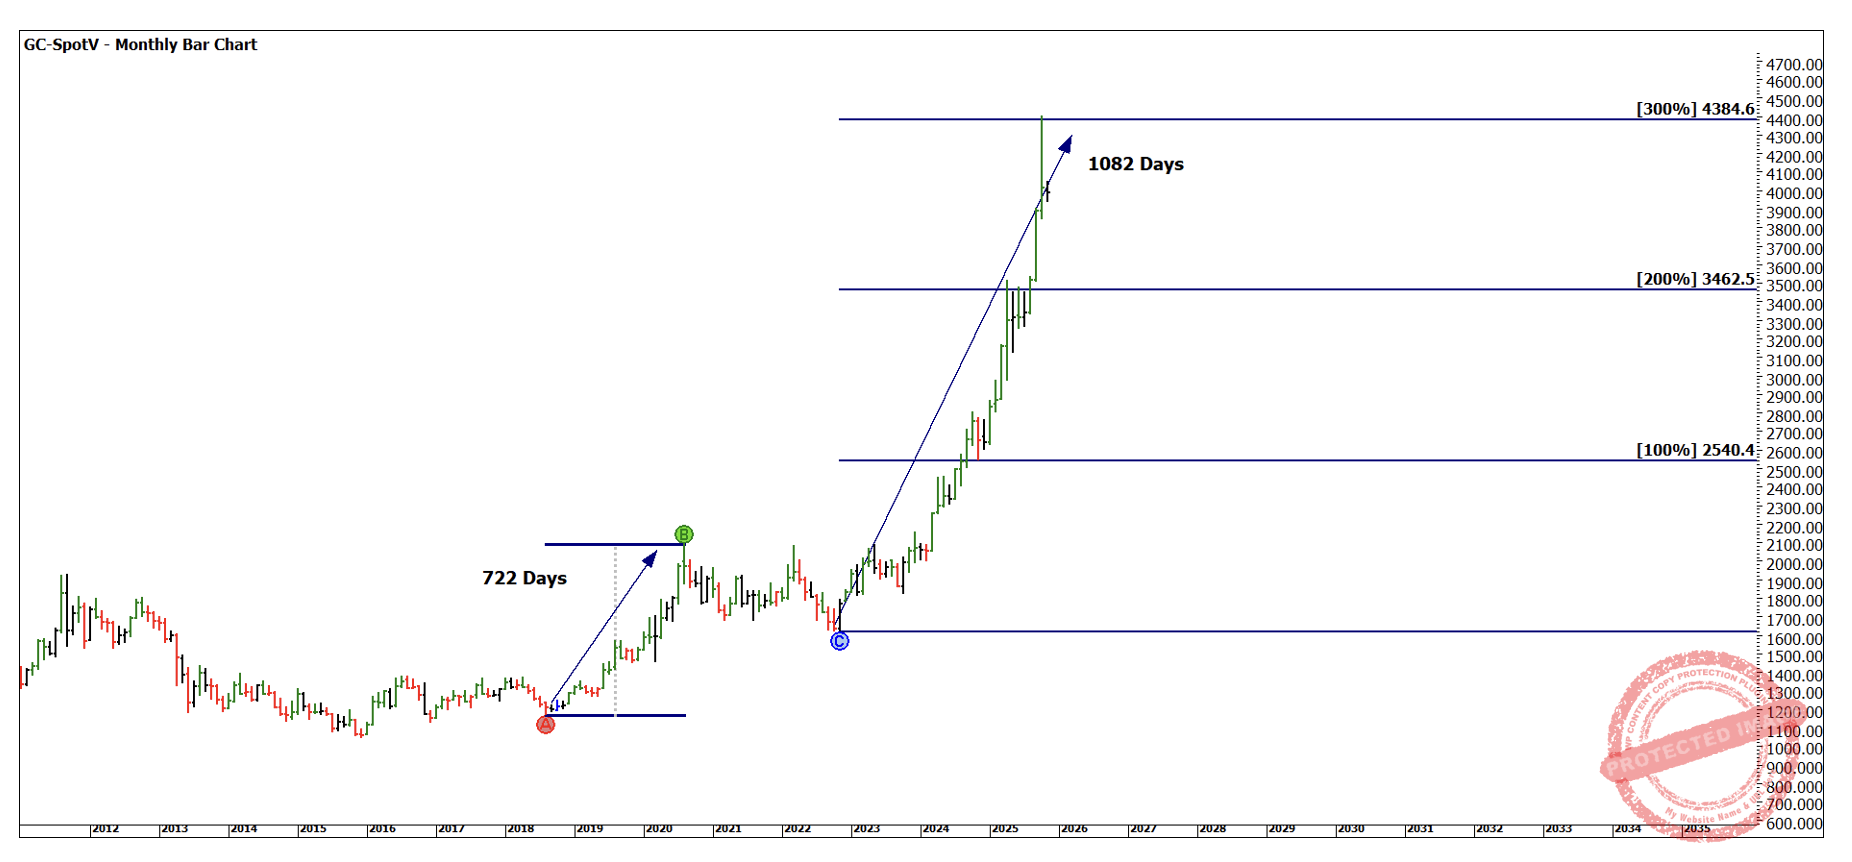
Chart 2– Monthly Bar Chart GC-Spotv
The following charts all look at the use of lows in understanding the current highs. Gann said lows call highs and highs call lows. This is somewhat simplistic but ultimately tells a large part of the story when trying to rate the position of the market.
Ultimately Gold may head higher than its current high in terms of price, but it’s also logical to consider it may need a pullback of some magnitude to ensure it can move higher.
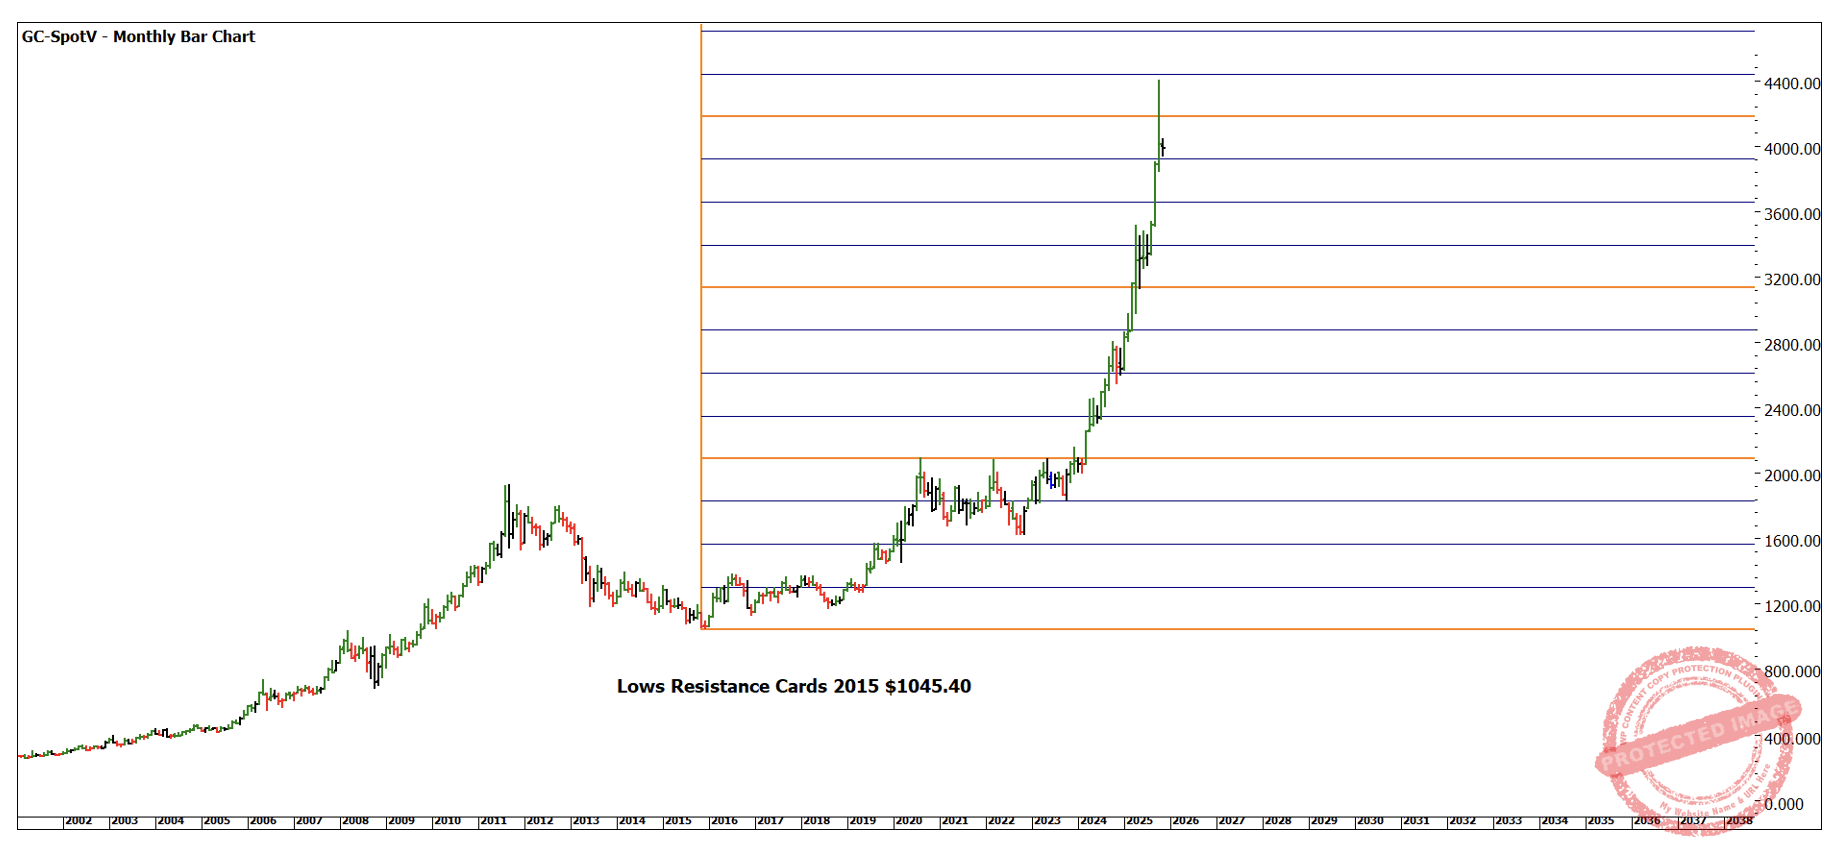
Chart 3– Monthly Bar Chart GC-Spotv
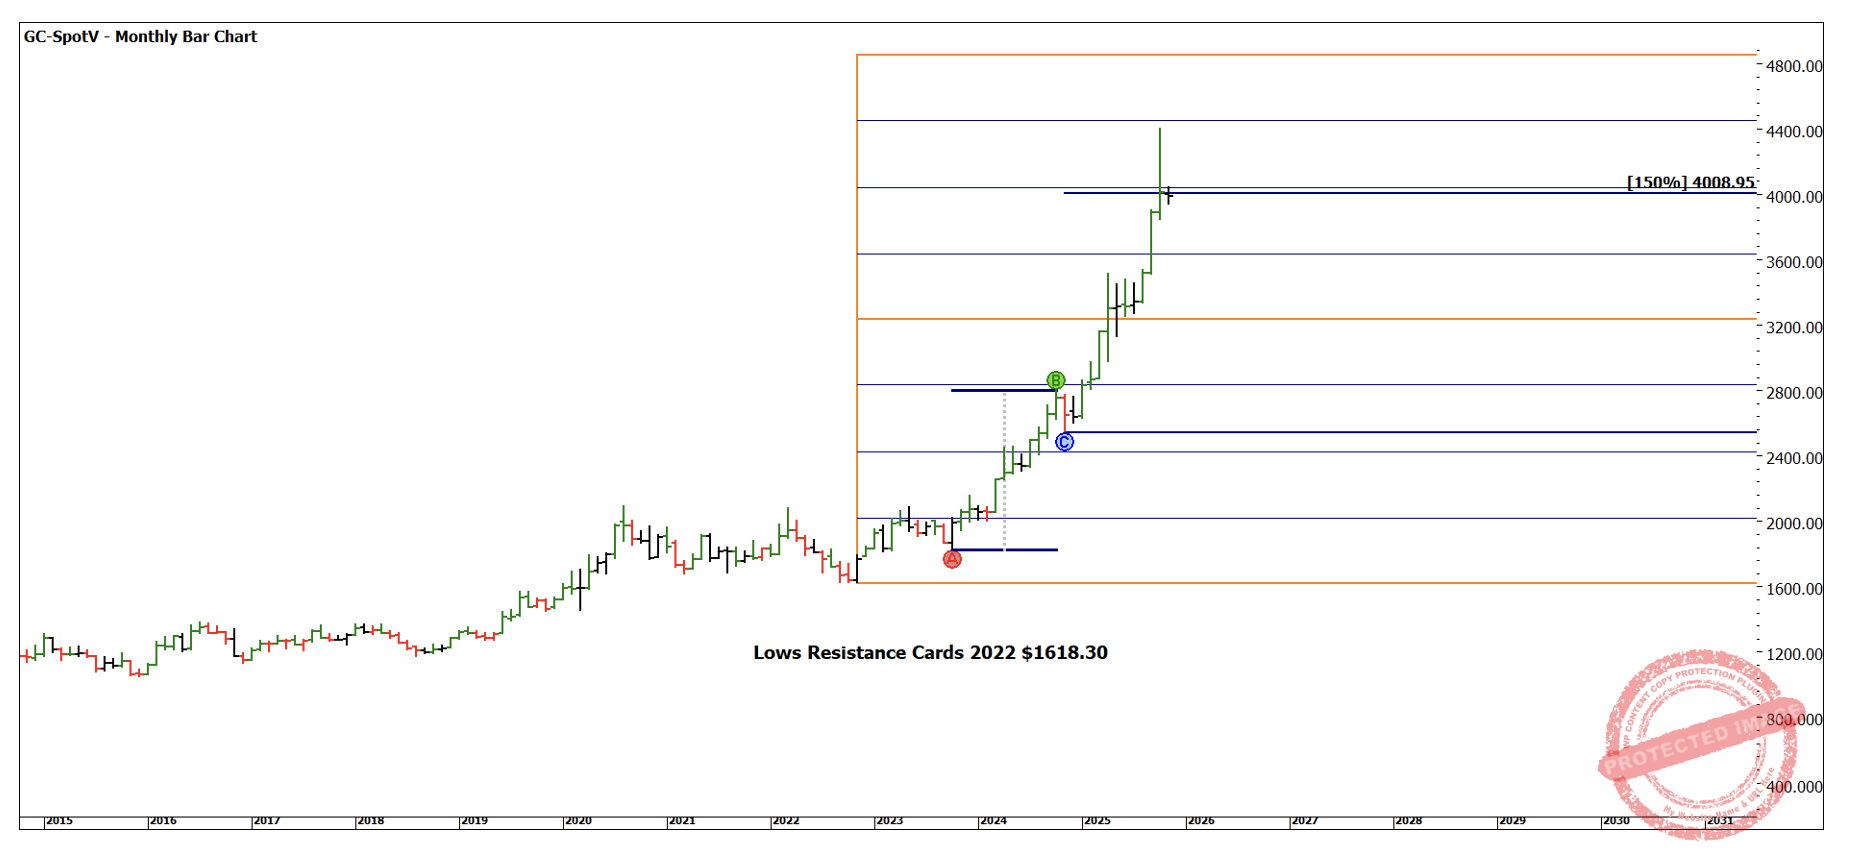
Chart 4– Monthly Bar Chart GC-Spotv
At the end of the day, we are looking to cluster as many price aspects as possible around the current high to form a cluster.
Using the low in 2000 at approximately $255 we see there is again some harmony around our current high. This can be done with a chart as we see below or a calculator by dividing the price of the high you are testing with the value of a historical low. Given a move of $255 is now quite small for Gold it can make the chart very busy to see the detail in.
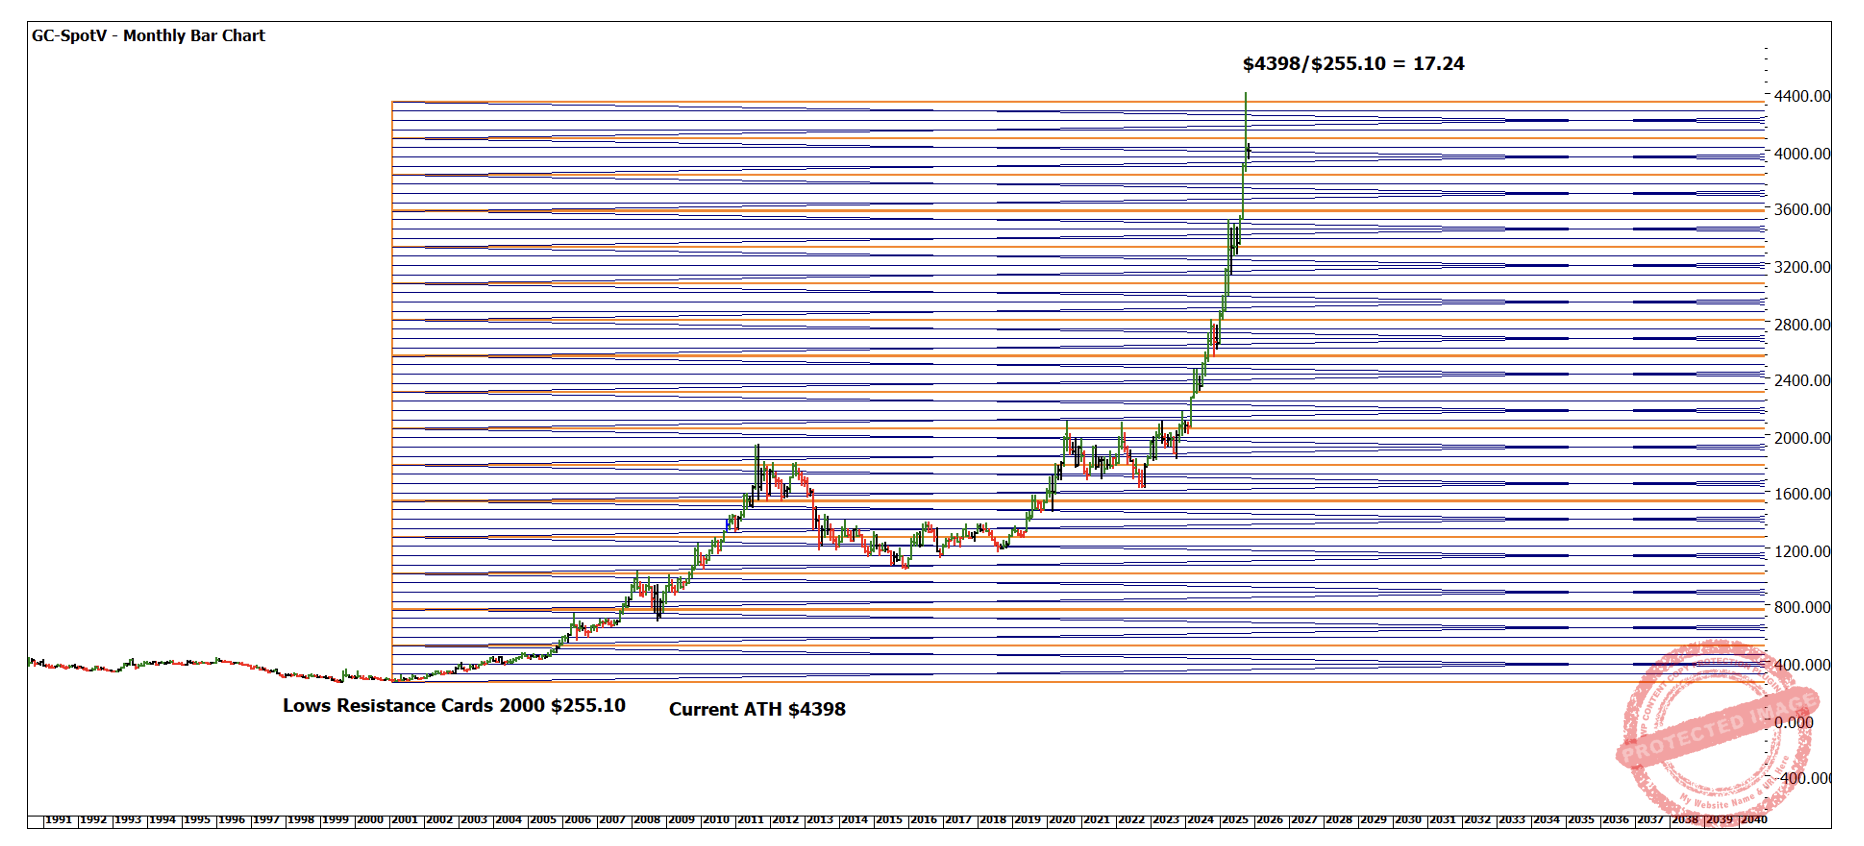
Chart 5– Monthly Bar Chart GC-Spotv
Jumping in at extremes the wrong way due to greed is not a desired path for long term successful traders. Patience is key, a pullback to a price cluster and the use of our swing charts can be a better guide to getting a long trade away on this market.
We can also watch our swing chart develop (in the case of Chart 6) a 2-day swing overlay and the 50% milestone may be good tools to understand what’s next.
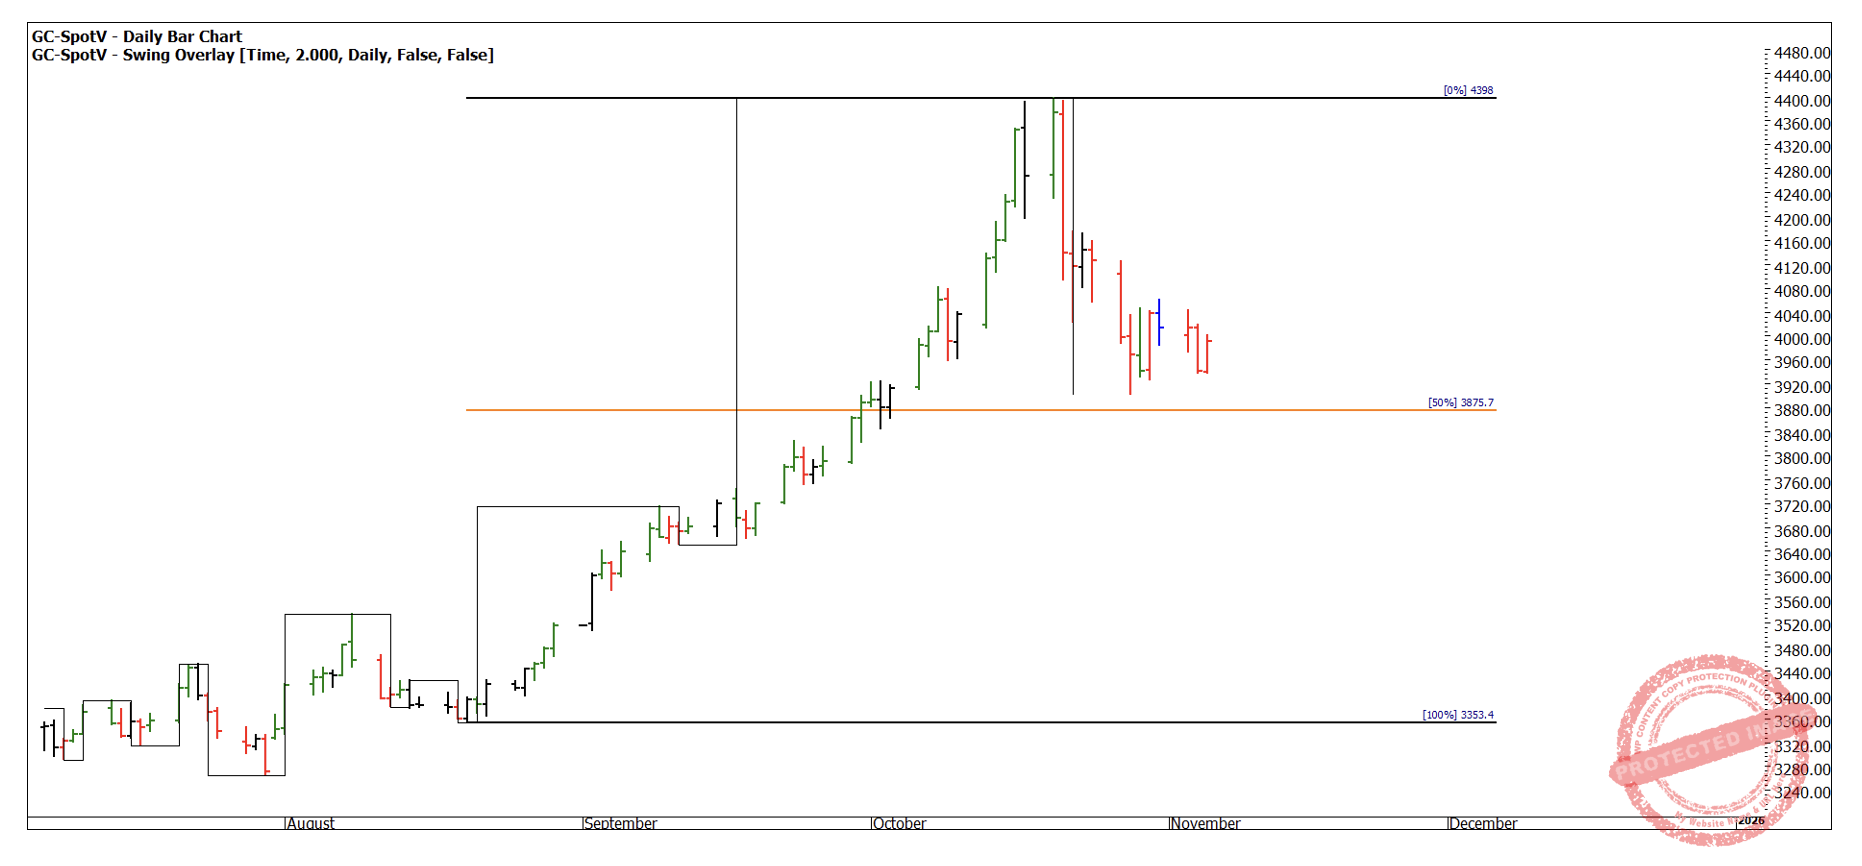
Chart 6– Daily Bar Chart GC-Spotv
Good Trading
Aaron Lynch