Scenarios, Scenarios, Scenarios!
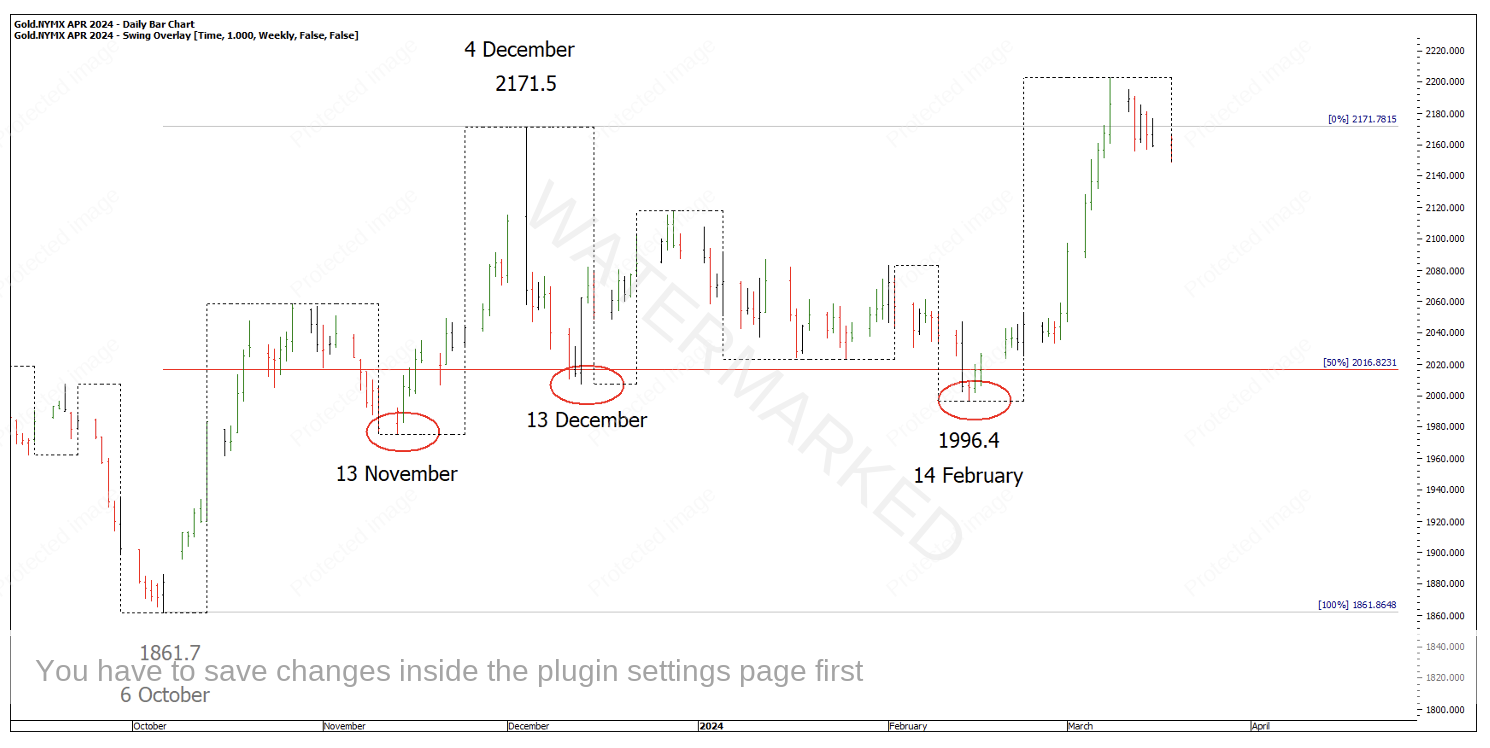
Continuing on from last month’s discussion on Gold, this market has seen a strong run up out of the 14 February low of $1,996.40. Unfortunately, there wasn’t the textbook, high probability entry signal to get long this market, as you would often see. Not to say there wasn’t an entry signal, it just wasn’t as easy as others.
Chart 1 – Gold
However, we can still take a look at the bigger picture swing charts to find the Position of the Market and try to gain an idea of what could be left in this run so that if a setup did present, we would know if a high Reward to Risk Ratio was still achievable.
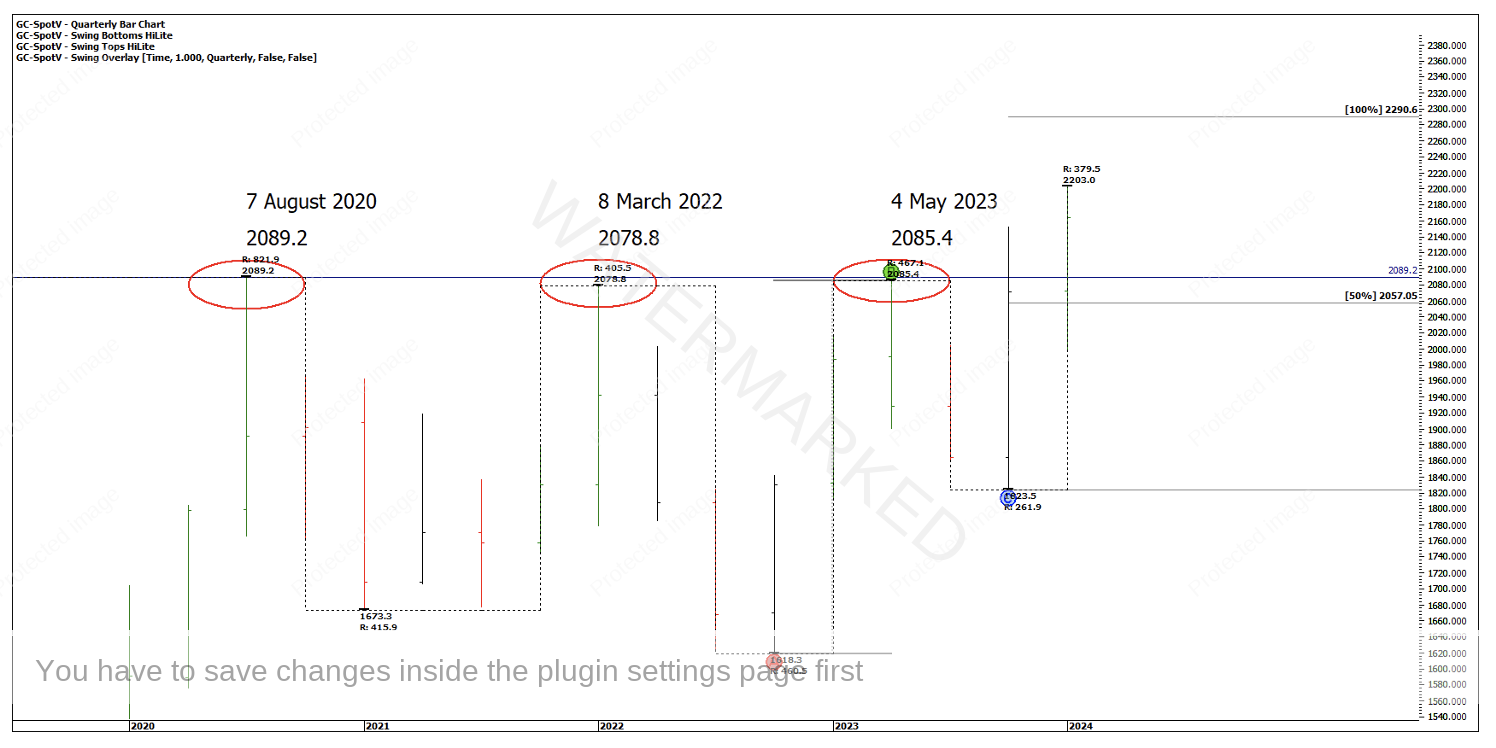
First thing to notice is that Gold is well above all-time highs, with the first one made back on 7 August 2020, 3.5 years ago. On the quarterly bar chart, it’s broken on the fourth attempt, a sign of strength.
Chart 2 – Multiple Bar Chart Tops
The quarterly bar chart above shows a bullish picture with a confirmed expanding up-swing of $467.10 and a contracting down swing of $261.90. The quarterly swing is in the second section out with a 100% target of $2,290.60. The second sections are often the largest of sections and could exceed the100% milestone.
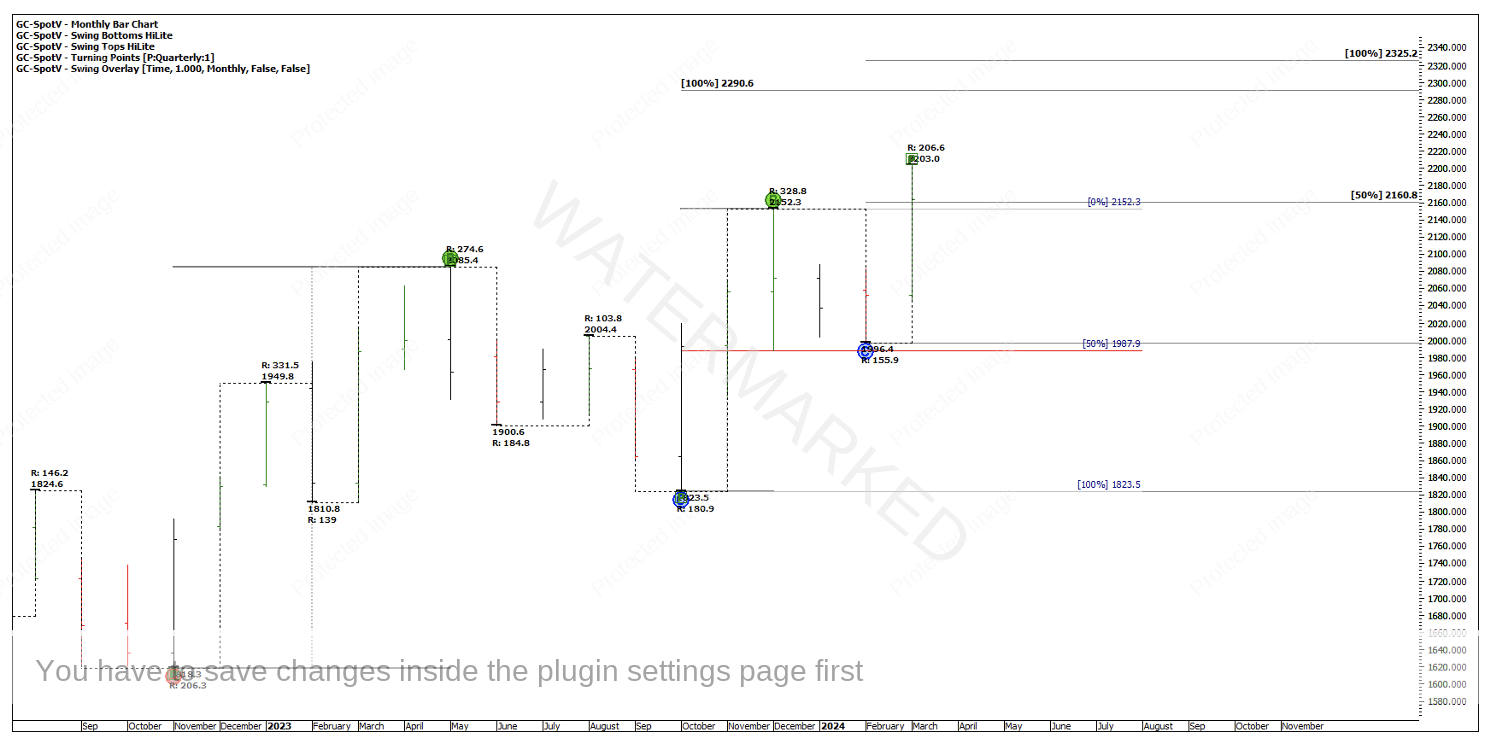
The monthly swing chart is also in a second section coming out of a strong position from a 50% retracement and contracting swing range down. The 100% target is $2,325.20. This could mean there is still the potential for roughly half of this monthly swing to unfold before hitting the 100% milestone.
Chart 3 – Monthly Bar and Swing Chart
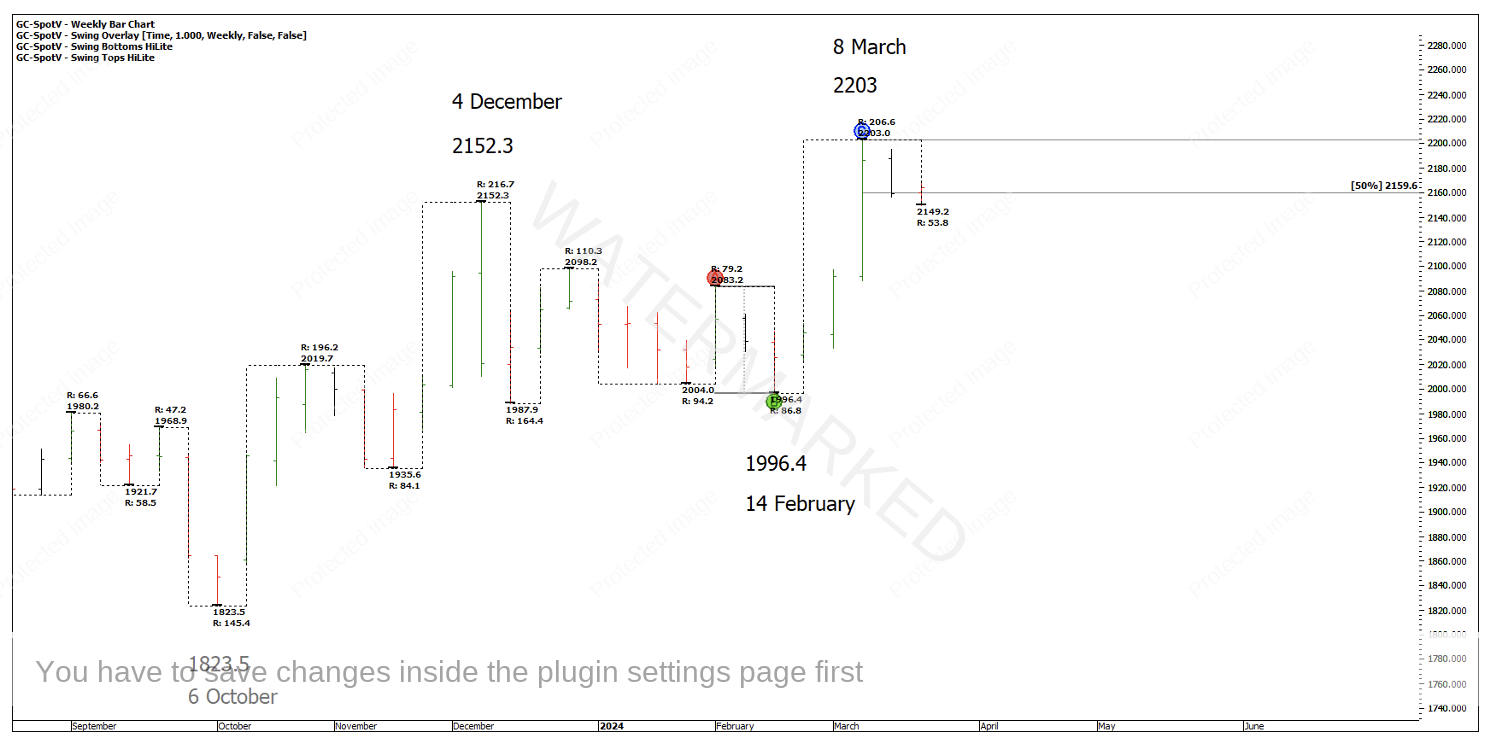
Then we come to the weekly swing chart, and where I feel it becomes a little harder. Gold shows a big weekly Overbalance in Price to the upside. The current weekly swing down sits at the 50% milestone of the previous week and is also sitting on old tops. This is a very small retracement in Price.
Chart 4 – Weekly Bar and Swing Chart
The above Sections of the Market and swing charts suggest there could be more upside on Gold and if you’re looking for just a couple of strong trades for the year, the bigger picture swing charts, combined with a high probability setup on a smaller time frame, can certainly deliver those.
Something that would be worth watching could be a second and contracting weekly swing down into a strong time and price cluster. That may not happen, but if we know what we are looking for then it doesn’t take long to keep up to date with this market.
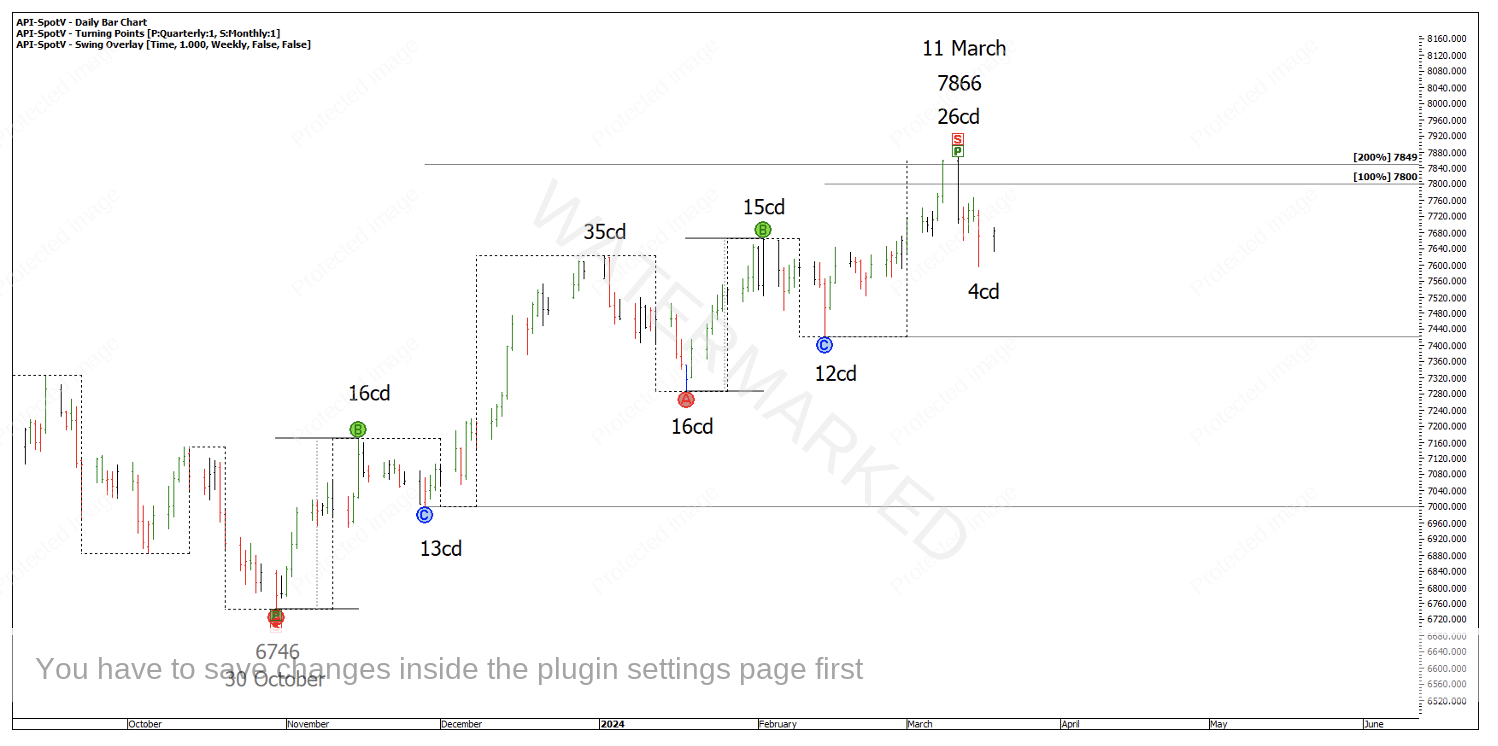
Taking a quick look at the SPI200, it continues to show signs of strength. The SPI200 has reacted off the 200% milestone of the weekly First Range Out at 7,849, however it hit the milestone with an expanding weekly swing range up in Time and Price.
Chart 5 – SPI200
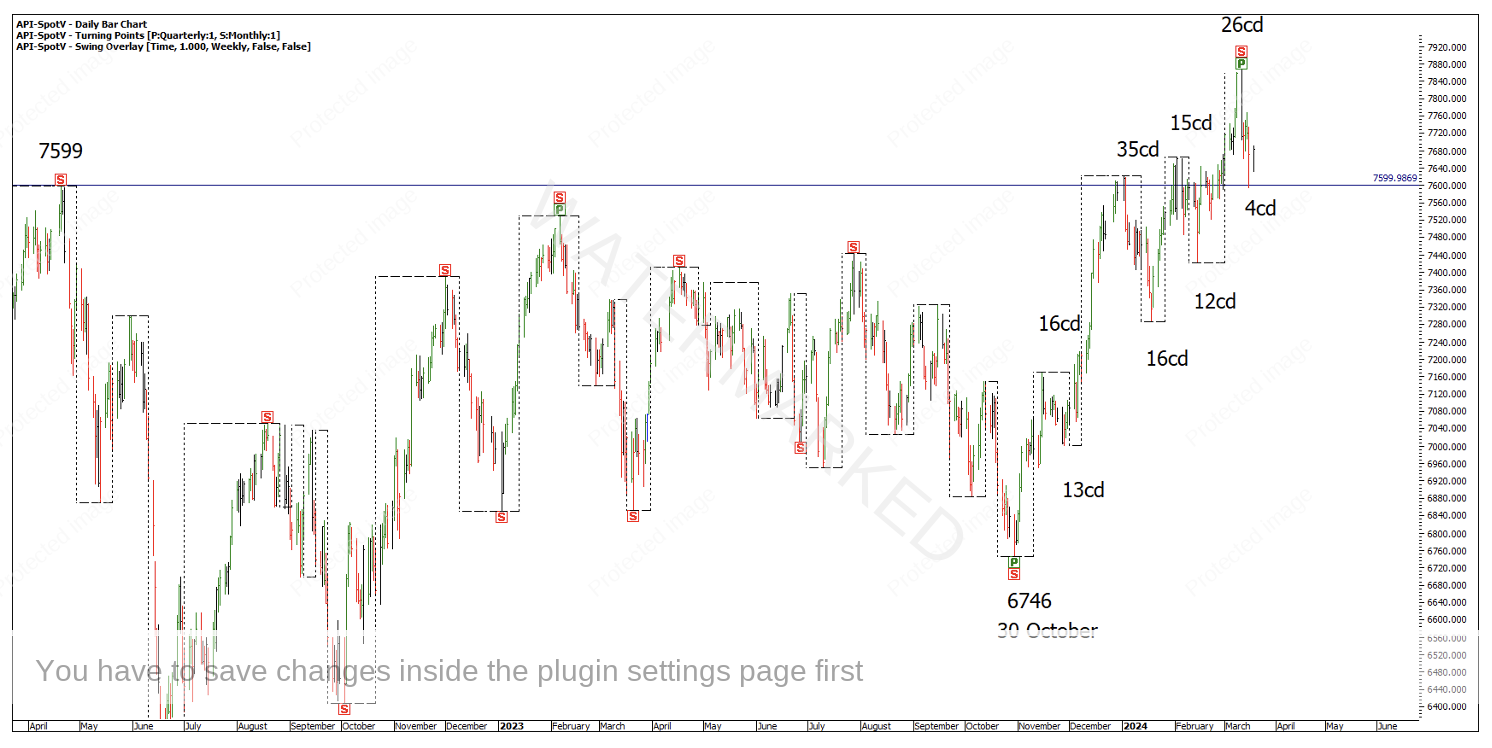
The SPI has now put in a contracting daily swing down which sits on old all-time highs, indicating this weekly swing down could be over and we have another higher weekly swing bottom. This doesn’t have to be the case, but it is now another contracting weekly time swing down of 4 days which isn’t a good sign for more downside.
Chart 6 – SPI200 Contracting Daily Swing
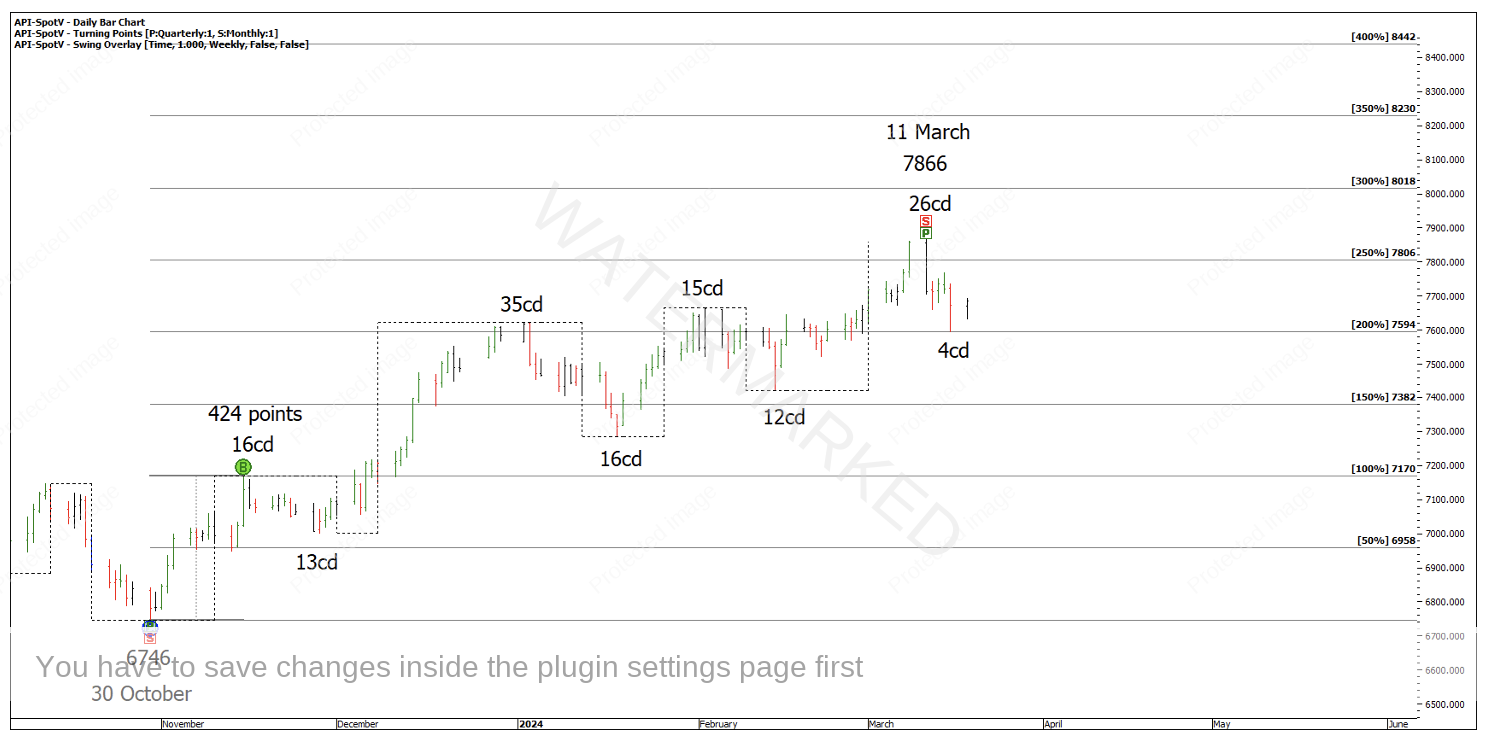
The problem is, the 11 March high would be the end of a 4th weekly swing up which W.D Gann says is the end of the move. So, either that isn’t the correct First Range Out to use or we need to be running multiples of the First Range Out like David Bowden teaches us in the Number One Trading Plan with the 256 point example. Applying multiples of the 424 point FRO, 400% milestone gives a target of around 8,442.
Chart 7 – 4 Multiples of the First Range Out
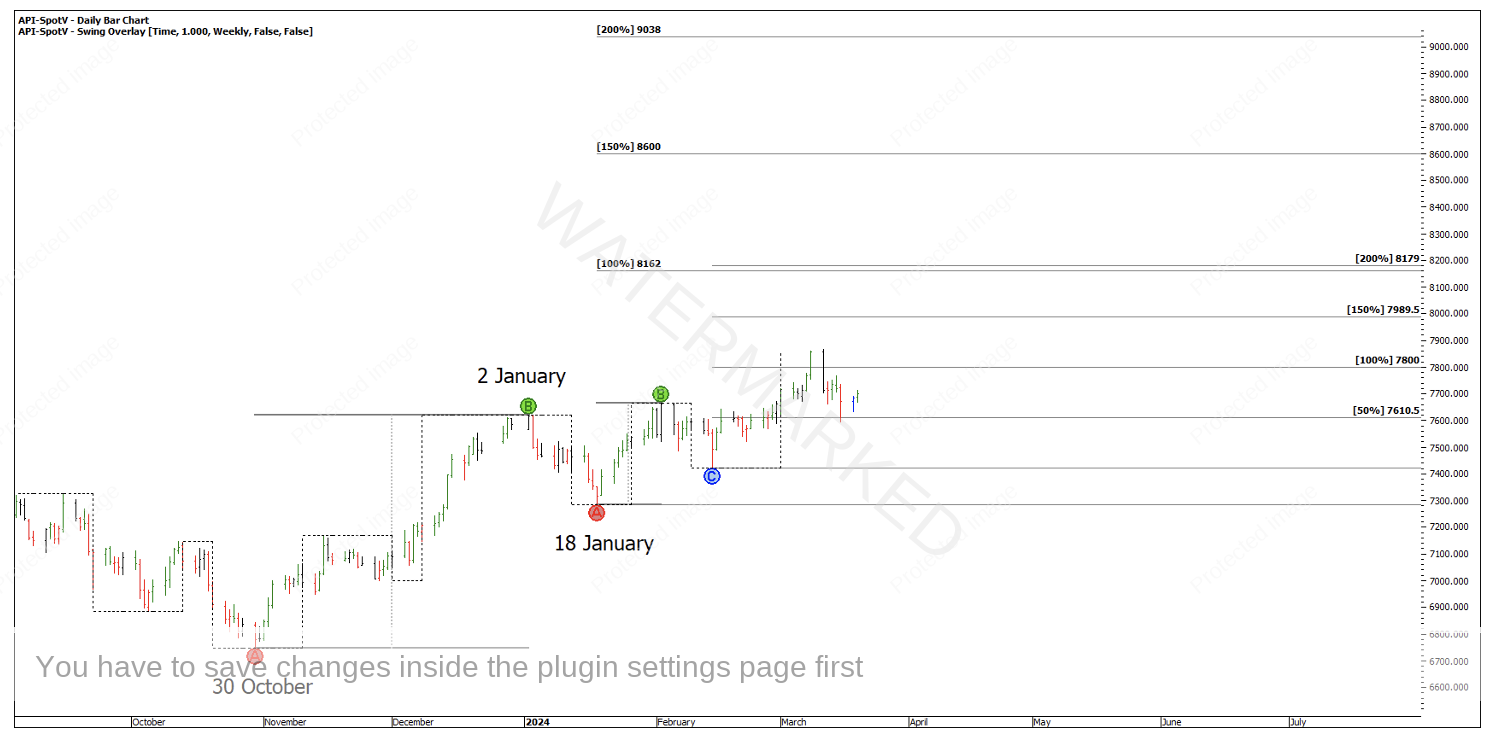
If you use the bigger weekly First Range Out, then we have a completely different set of milestones to watch going forward.
Chart 8 – Bigger Weekly First Range Out
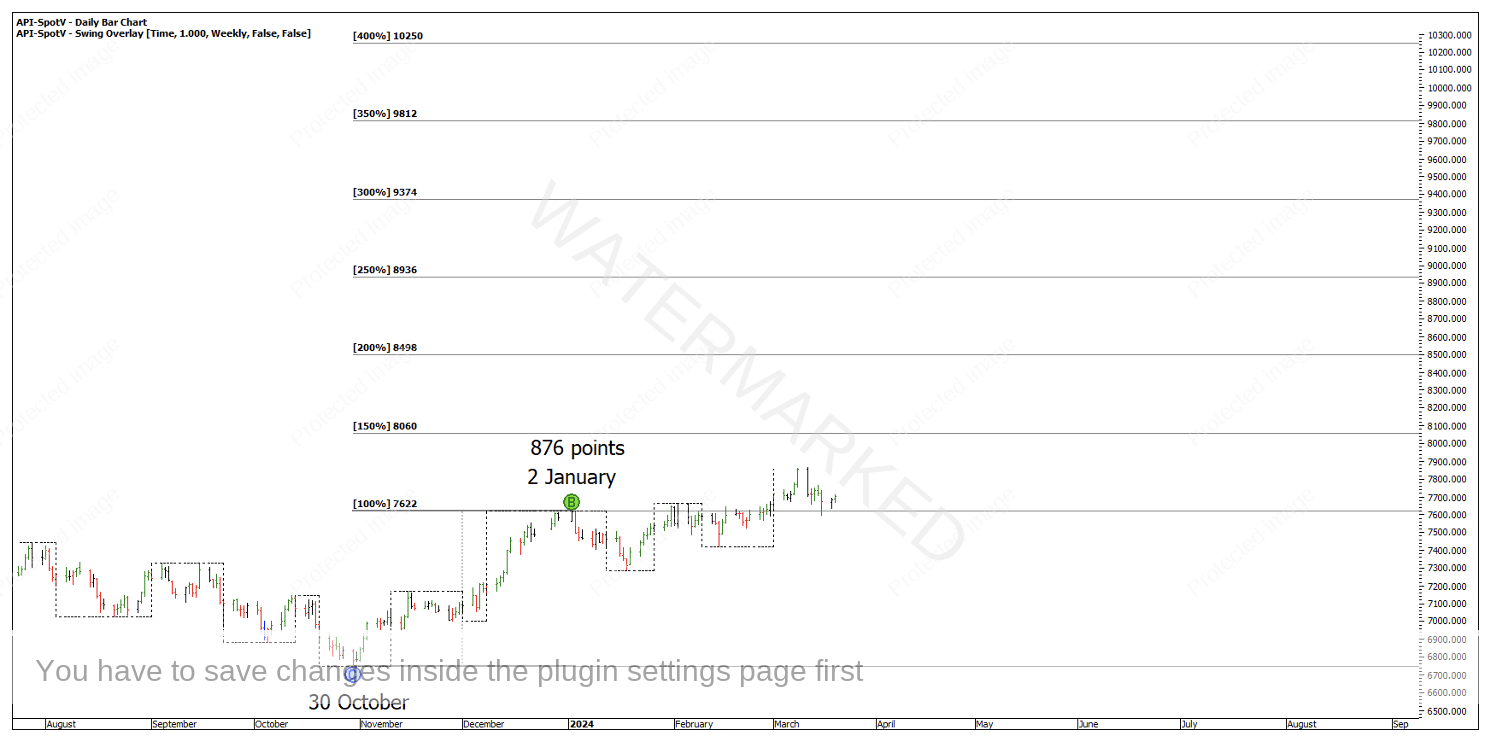
And just because we’re talking First Ranges Out, you could also run 4 multiples of 876 points which would take you up to 10,250.
Chart 9 – 4 Multiples of 876 Point First Range Out
There are multiple scenarios at play on the SPI200 at the moment, although the next trading opportunity may well be a daily retest cluster if one presents.
Happy Trading,
Gus Hingeley
