Seasonal Opportunities
Welcome to this month’s Platinum newsletter, this year continues to deliver in terms of headlines with twists and turns. From my perspective it’s been a tumultuous year on the geopolitical front and markets have shown that sentiment is the driver for a reaction. Things I would have historically thought would move markets haven’t and vice versa. This confirms to me that identifying the news headline that acts as the catalyst is potentially more challenging than just looking to calculate what pressure points in time and price to look for.
I am big fan of seasonal time; it offers a simple way to keep time pressure dates overlaid on market price action to calculate where a classic Gann setup is present. Many markets have been in the sideways spirt that we have seen for several months. This sideways motion makes it hard to confirm the component of volatility when looking at the 5 areas of a Classic Gann Setup. When we look for a turn in the market, we like to see a strong move in and out of time pressure. The issue with a sideways market is it makes it much harder to define if it may be a top or bottom and if any reaction will be noted.
Of the major markets I am following on a regular basis, many are yet to push clear of the sideways motion, and this lends me to be cautious around seasonal time. The September seasonal date could create a short term move for many markets but fair to say we may not be seeing any cycle highs or lows form. That is ok , it may be a simple case of creating a shorter term move and if it delivers a trade of acceptable reward to risk then so be it.
I will continue my analysis on TSLA, this market is in the clearest position in terms of our Classic Gann Setup to consider for a possible change in trend. 2025 has been a wild year for Tesla in terms of day-to-day business with its CEO as well as the theme of electric vehicles having taken several twists and turns. Tesla is potentially no longer top of the pile when it comes to that space.
Chart 1 starts us with the seasonal time aspect and what can be linked to Time by Degrees. Using the 22nd of September (US time) as the anchor, we see some vibrations that relate to seasonal time over the year. The hits are not laser like and alone don’t represent a slam dunk in terms of analysis. I am also very much aware that the birth of contract for TSAL is 29 June so we may yet have a little time for this to develop.
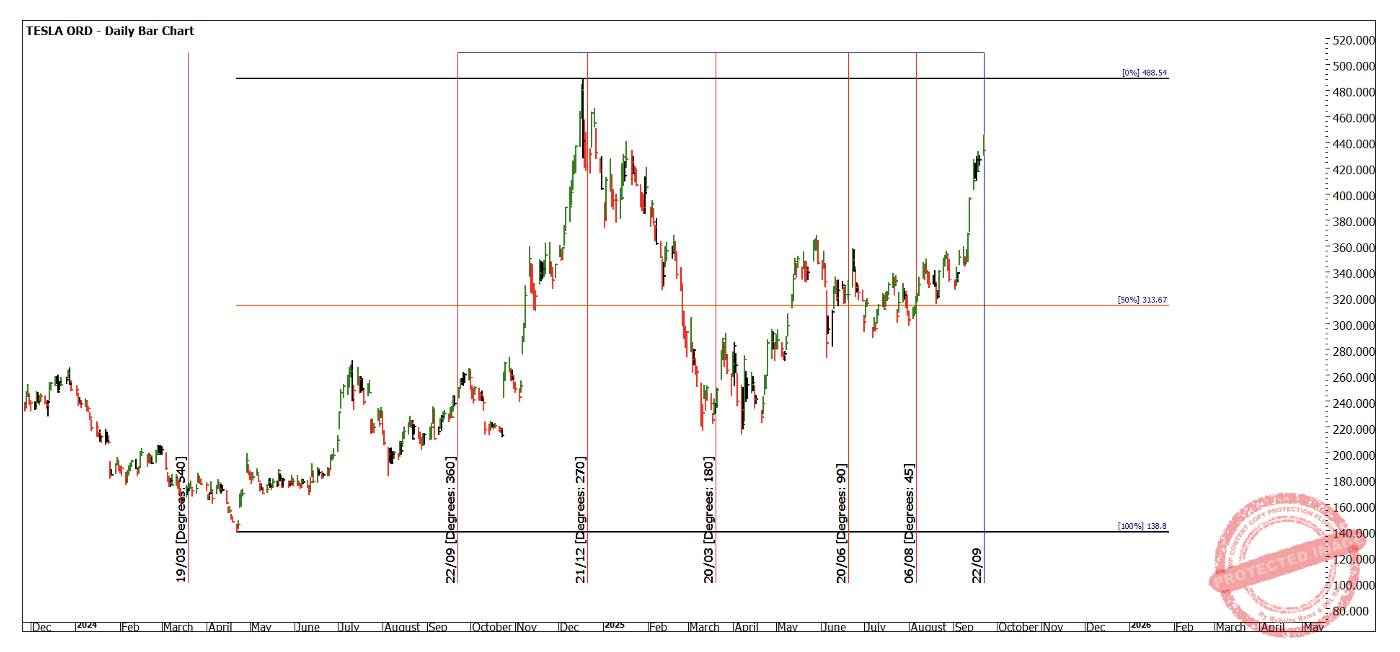
Chart 1 – Daily Bar Chart TSLA
Chart 2 examines September and the role of anniversaries around the same time each year. The month of September has delivered some measurable changes in trend. It’s hard to analyse when the data is compressed, I suggest you recreate this chart again using the most recent data as the anchor and run 1-year intervals. The 2,3,6,8,10,12 and 15-year marks all produce a turn of some merit within tolerance, again some are more impressive than others.
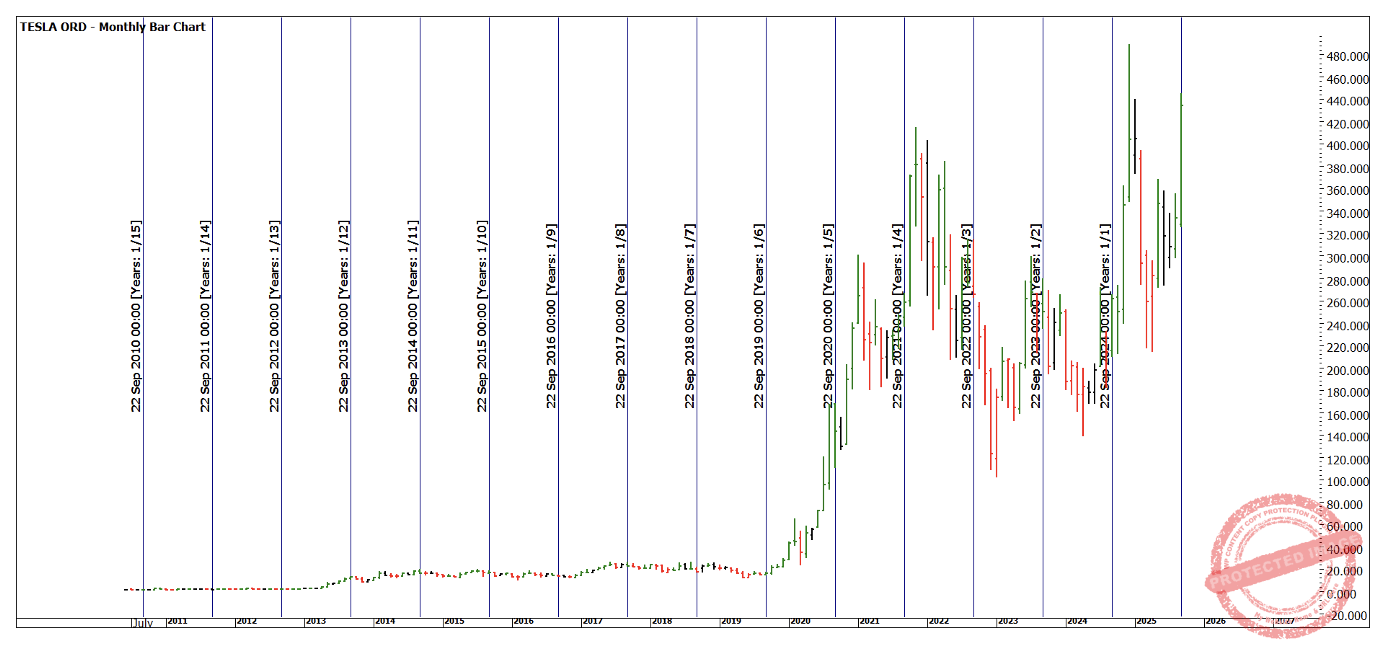
Chart 2 – Monthly Bar Chart TSLA
Chart 3 examines a small picture review of the last 6 months. The price movement in April has been repeated, and we currently sit above the 100% level. This is a sign of strength so we may need to set our trading plan for entries if we can break back under $426.67.There is also an approximate repeat of the 52 days’ time frame (in this case double, then add to this a 2 x 1 trading day angle) squaring the current top. Please note this angle uses $1 per day as the point size. If we run a time frame from the April low, we are currently 168 days from that turn.
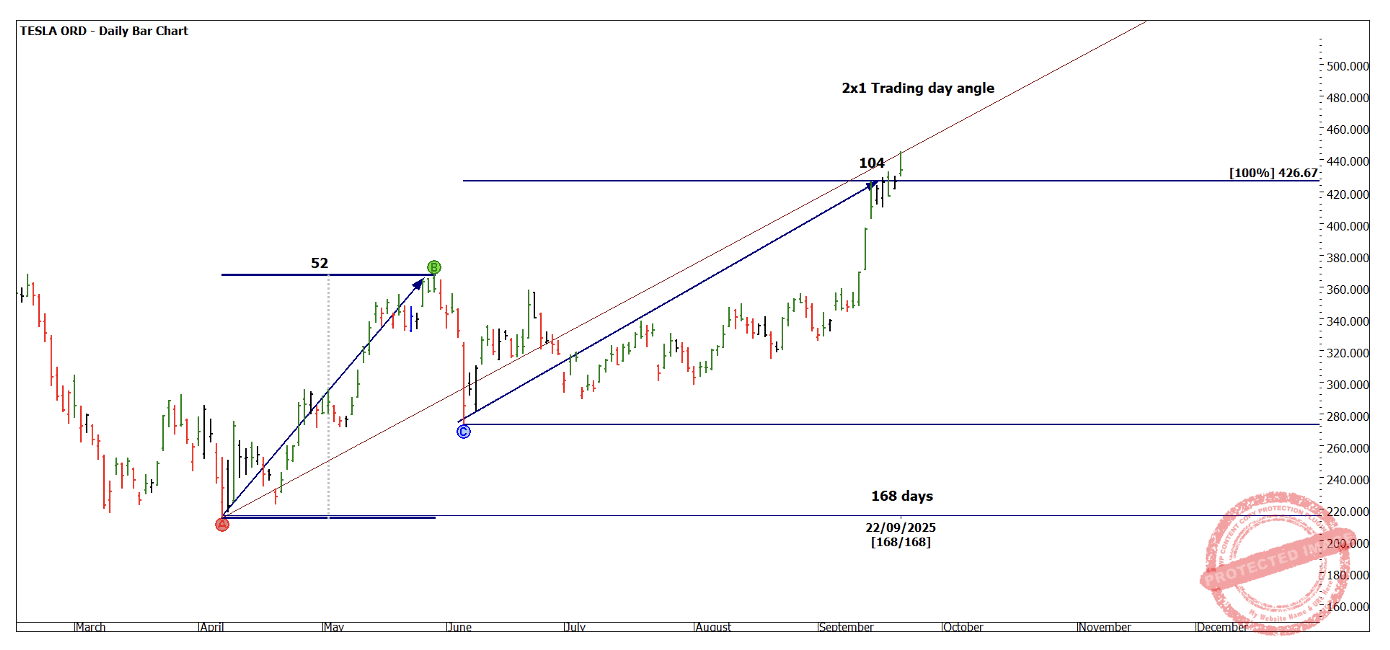
Chart 3 – Daily Bar Chart TSLA
Chart 4 is a time trend analysis chart measuring calendar days up and down for the last 18 months or so.
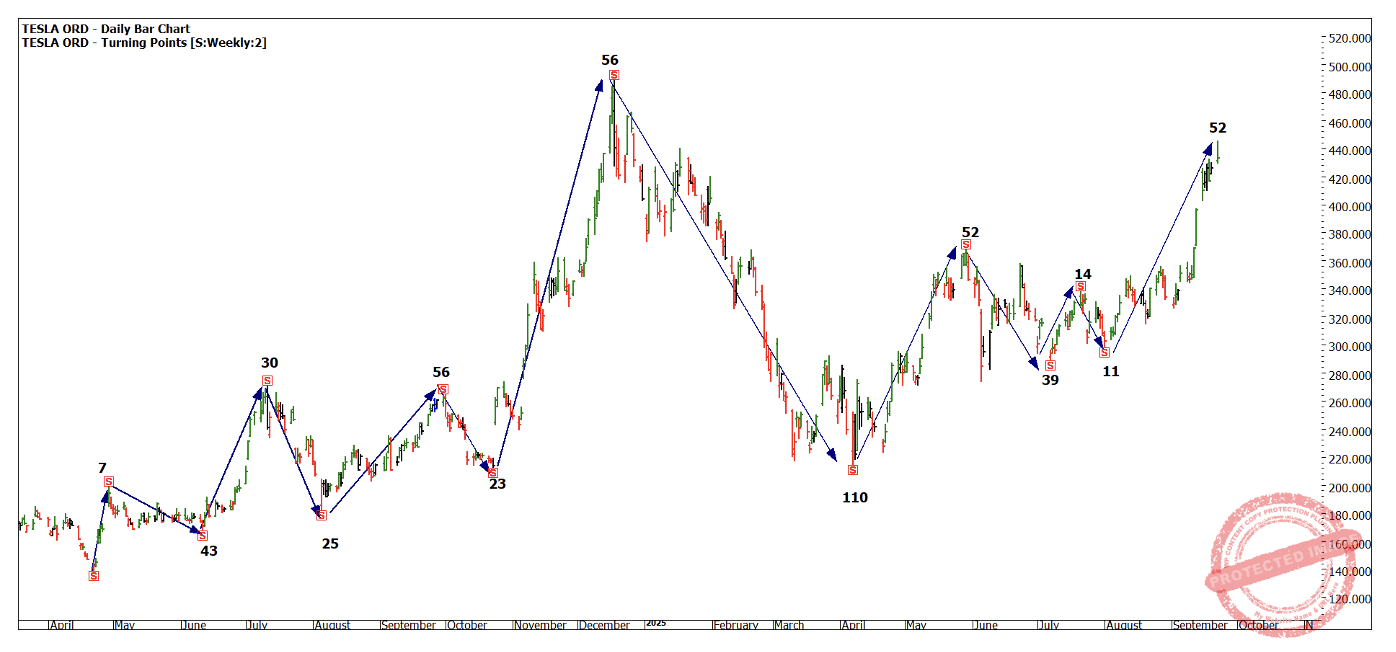
Chart 4 – Daily Bar Chart TSLA
Chart 5 gives us some price analysis, with 150% of the repeated large range giving us the current price point as well as another trading day angle to consider.
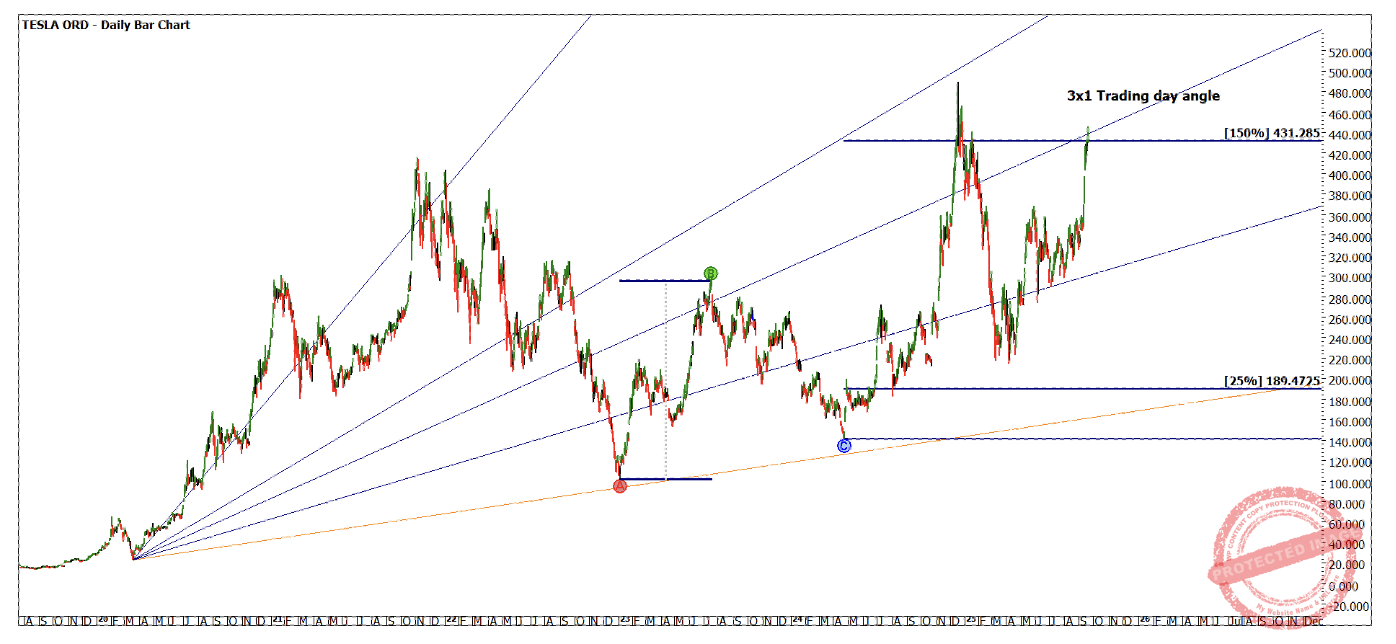
Chart 5 – Daily Bar Chart TSLA
Chart 6 looks at the Square of 52 and how its placement on the Covid low has offered some areas to note when it comes to strength or weakness in the square based on previous highs.
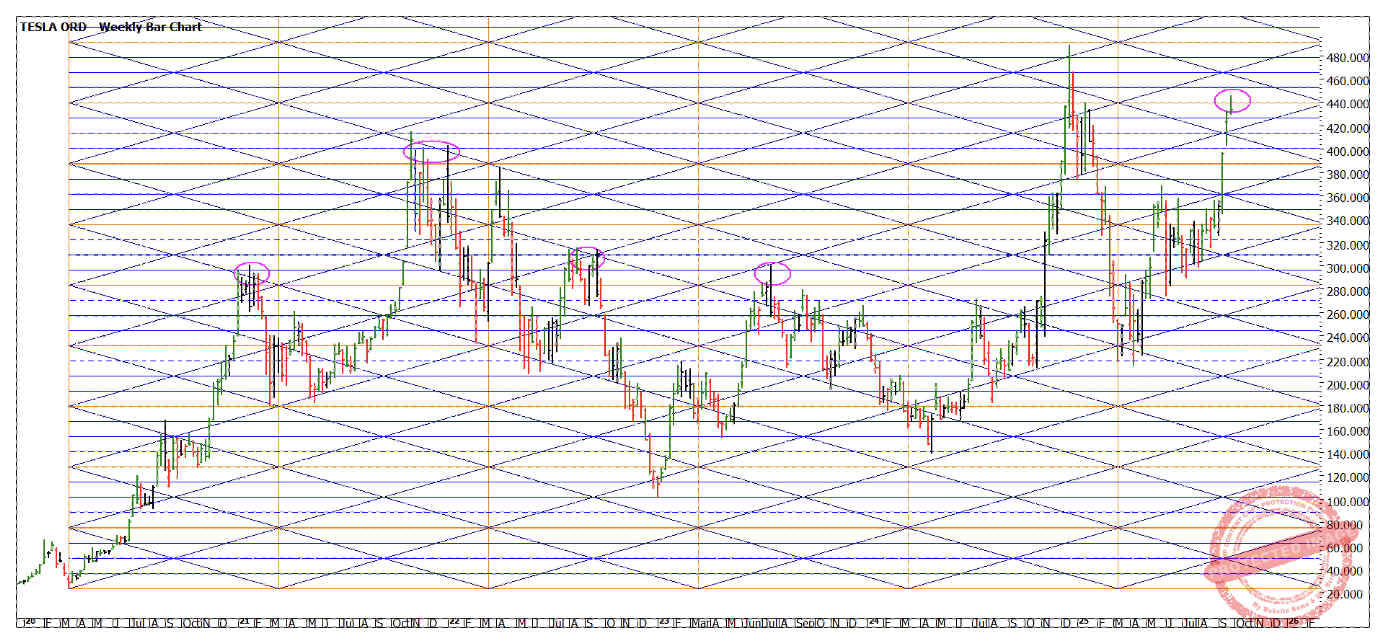
Chart 6 – Daily Bar Chart TSLA
The final chart I leave you with for now, is an intraday chart from the last few sessions. It’s a 1-hour chart. The points to note for me is this chart covers the last major move to the upside from the 10th of September. The move from the low to what is the current high is 52 bars (in this case 52 1-hour bars). The last impulse in price is at approximately 50% of the last intraday range. $441.84.
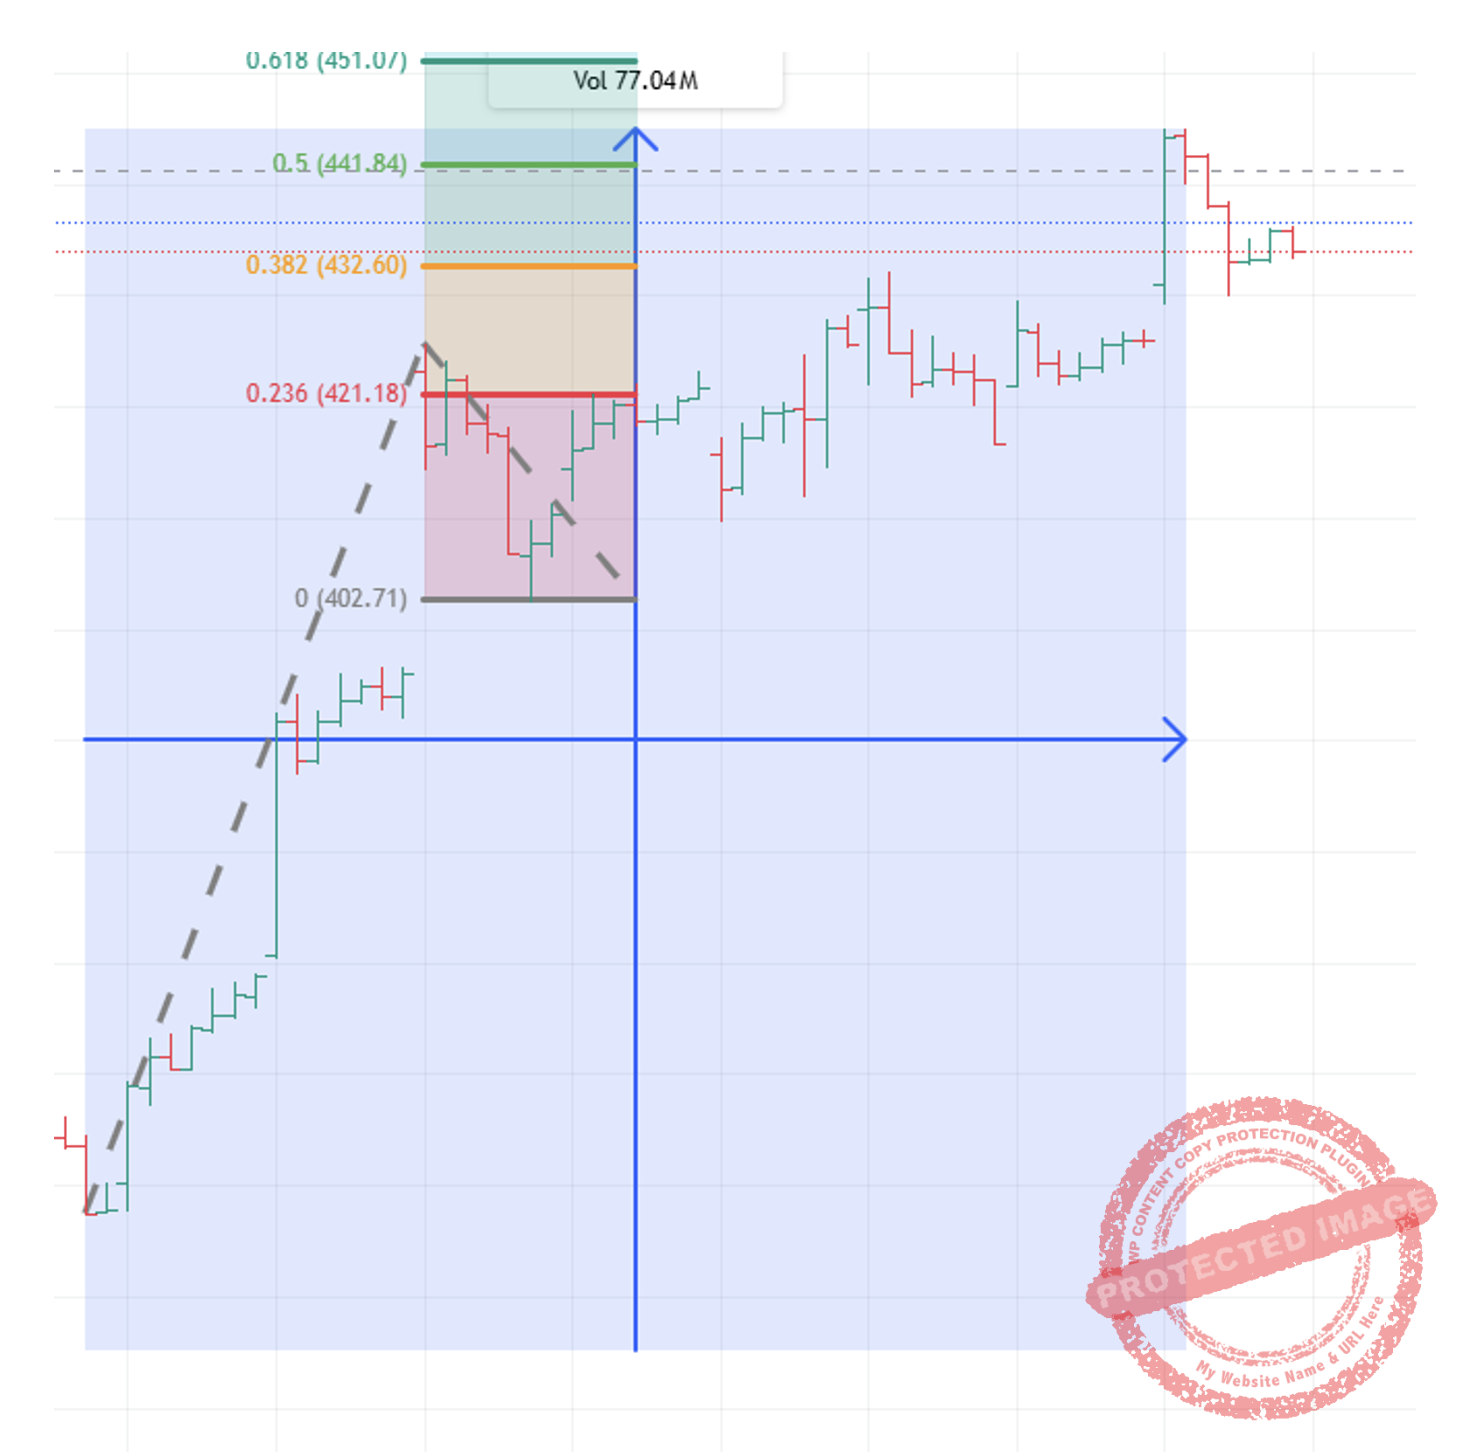
Chart 7 – 1 hour Bar Chart TSLA
So, for this market to move higher we would need to see it break some short-term intraday time and price pressure, which is very possible. If these levels continue to resist, then we could look for an intraday low risk entry and see what develops.
Good Trading
Aaron Lynch