Seeking New Highs
Over the past year there have been a number of so-called market experts suggesting that Tesla stock is overpriced, that the fundamentals don’t line up and that the CEO, Elon Musk is not capable of being a trustworthy leader. All of these sorts of comments are noise in the market.
There is an old saying that the horse that came first gets good and bad things spoken about it. And the horse that came second doesn’t get spoken about. Clearly, if people are talking about it, there must be some sort of attention-drawing speculators.
If we look at the W.D. Gann Stock Market Course, he wrote:
“When stocks advance to higher levels than they have been before in their previous history… they are in new high ground and you must have rules to follow when stocks reach new high record prices…”
Gann goes onto say:
“Do not buy or sell until there is a definite indication of a change in the main trend… When a stock advances to a new high level that they have never sold at before in their history, it is an indication of an advance of 7, 10, 15, 20 to 24 points or more, especially if it is in the 1st or 2nd section of the Bull Campaign. Should new highs be made in the 3rd or 4th Section, then the advance into new high ground may not be very many points before final high is reached and the trend changes.”
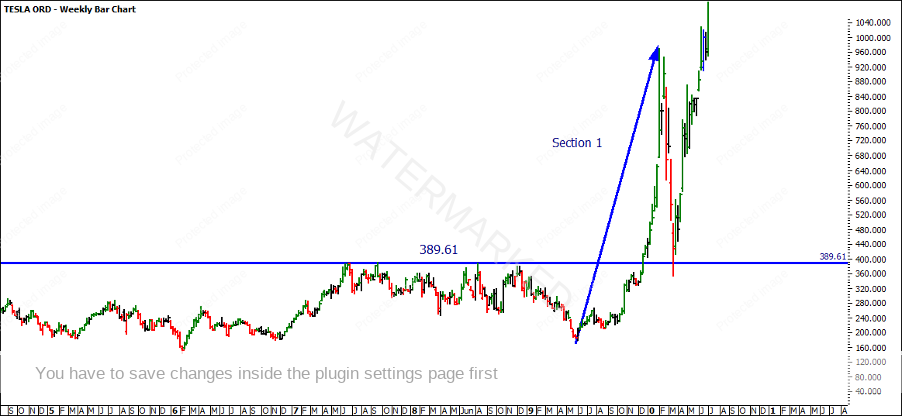
Tesla has broken above its original June 2017 All-Time High of $389.61. If we study the sections of the market, it is clear to me that the breaking of the original ATH marked the start of the first section of the bull campaign.
Reviewing the chart below, you can clearly see the strength of the first range out of the new bull campaign. The market pulled back to test the previous All-Time High. This was a nice example of an old top becoming a new bottom.
Hindsight is a beautiful thing, as we now know that the break is somewhat the first section of the bull campaign, and the second section is underway. With the above in mind, Gann goes onto say:
“You should watch the action of the market when it has advanced 7 points into new high territory, 10 points, again around 15 points, and on an extreme advance watch around 20 to 24 points, where there is likely to be resistance and top made. These are average moves and it depends upon the activity and price of a stock whether it will stop on any of these points. By following the trend indications and rules you will be able to determine when the first move into new high territory has run out and the trend has changed.”
Simply watching a move of 7, 10 or even 24 points on Tesla or the modern-day markets isn’t something that would be very helpful. We have seen over a 10X return since we started reviewing Tesla so the market has exceeded all of these point moves and it might be safe to say that it started its bull campaign. At this point, you might be thinking that the market is overpriced and due for a change in trend.
Gann suggests that “by following the trend indications and rules you will be able to determine when the first move into new high territory has run out and the trend has changed”. If we take the time to review the form reading aspects of section one and two, we can start to see some subtle indications to be watching for a change in trend.
If we focus on section one and section two, it will be your homework to continue this process. We will be focusing on the weekly chart and particularly the weekly pullbacks in time. If you enjoy this exercise, it will be highly advisable to do it on the daily chart as Tesla is providing faster price action at the moment. In saying that do not forget about the major trend.
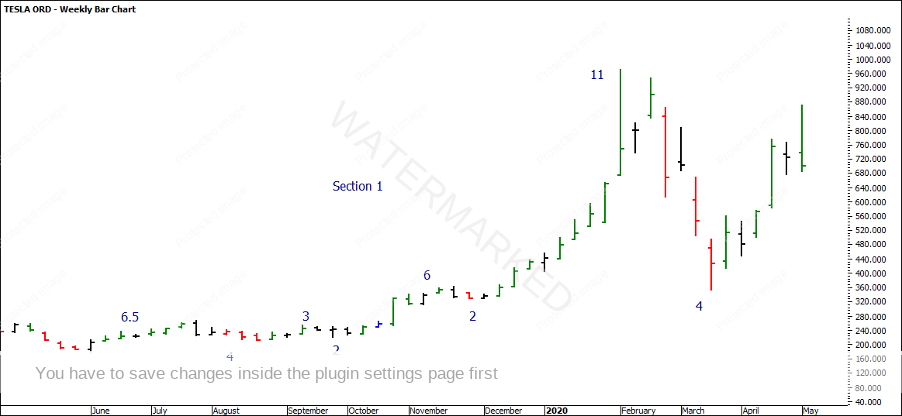
The chart below is of weekly counts up and down. Typically, what you should be watching for is the breaking of weekly bottoms. In some cases, you will notice that the outside week broke the previous weekly bar top or bottom. It is often the close of the outside week that allows you to determine the strength of this break.
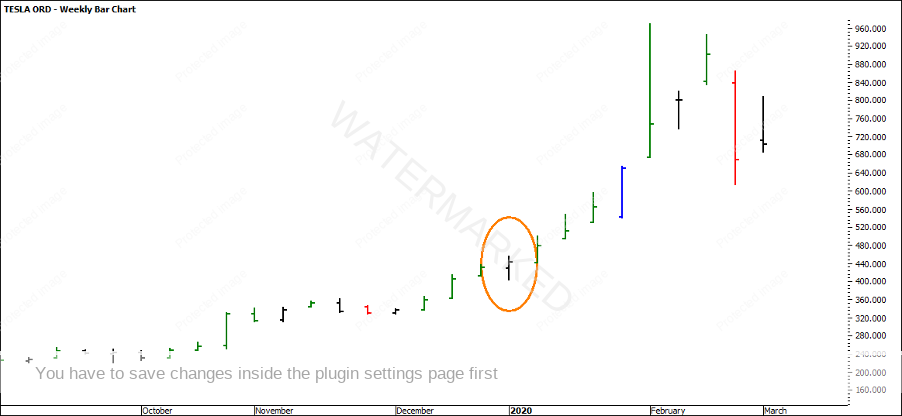
As you can see in the first week of January 2020, the market had started to move again. The week opened similar to the previous weeks close, yet it spent the first part testing the previous weekly low, before it pushed higher, breaking the following weeks high. Also note that the week prior had a much small weekly bar range.
Looking at section one, you will notice that in the space of 9 months, the markets largest pull back was 4 consecutive weeks back in total. There is also some harmony amongst the upside counts and the downside counts.
Section two is often regarded as the section that moves the fastest and what I have found to be the easiest to trade. It is likely to move 125% of the FRO showing strength in the overall move. Comparing section two with section one, we have seen a different story with similar characteristics. There were close to 11 consecutive weeks up. There was a minor weekly bottom break in the last week of May 2020. The market tested the previous weekly low. The weekly bar ranges were expanding, and we are yet to see a 4-week pullback which indicates that the market is still showing signs of a continued trend.
As the market continues to move higher, it might be worthy of watching for 5 consecutive weeks down. This will indicate that the time has overbalanced.
Gann always said not to get ahead of the market. Don’t guess if it is making a change in trend and be wrong. Wait until it shows a definite change in trend. You will be right when you form your judgment after definite indication is given according these rules.
It’s Your Perception
Robert Steer


