Selling Corn
This month’s article looks back on a recent trade in the Corn futures market. The techniques engaged are from the Active Trader Program level. The article begins with analysis details, followed by trade execution and finally a breakdown of the rewards.
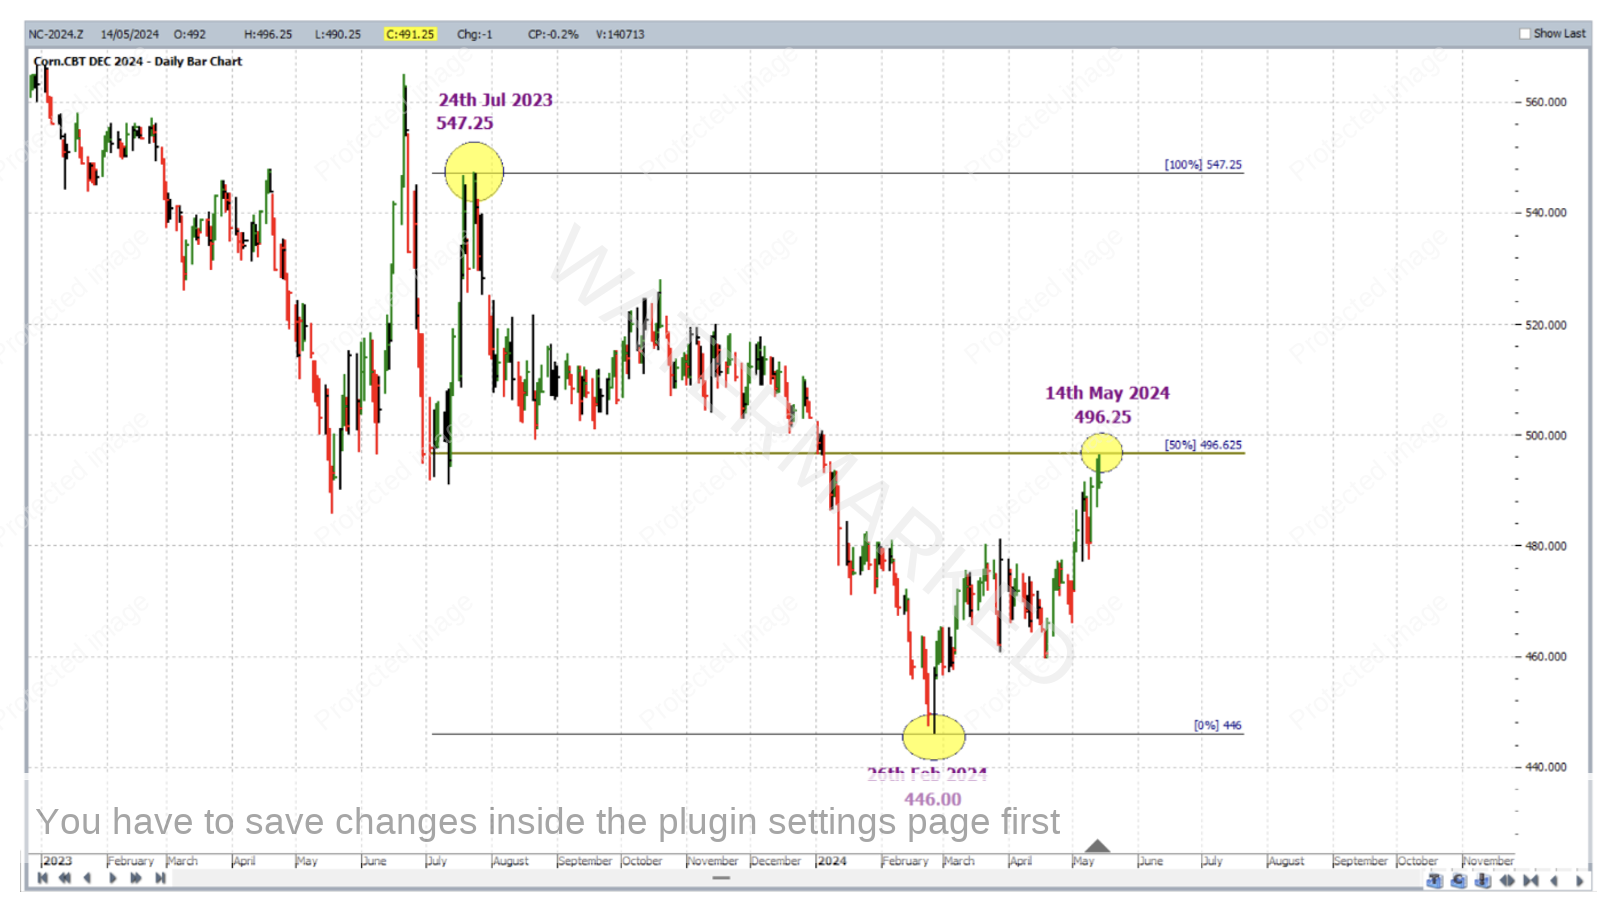
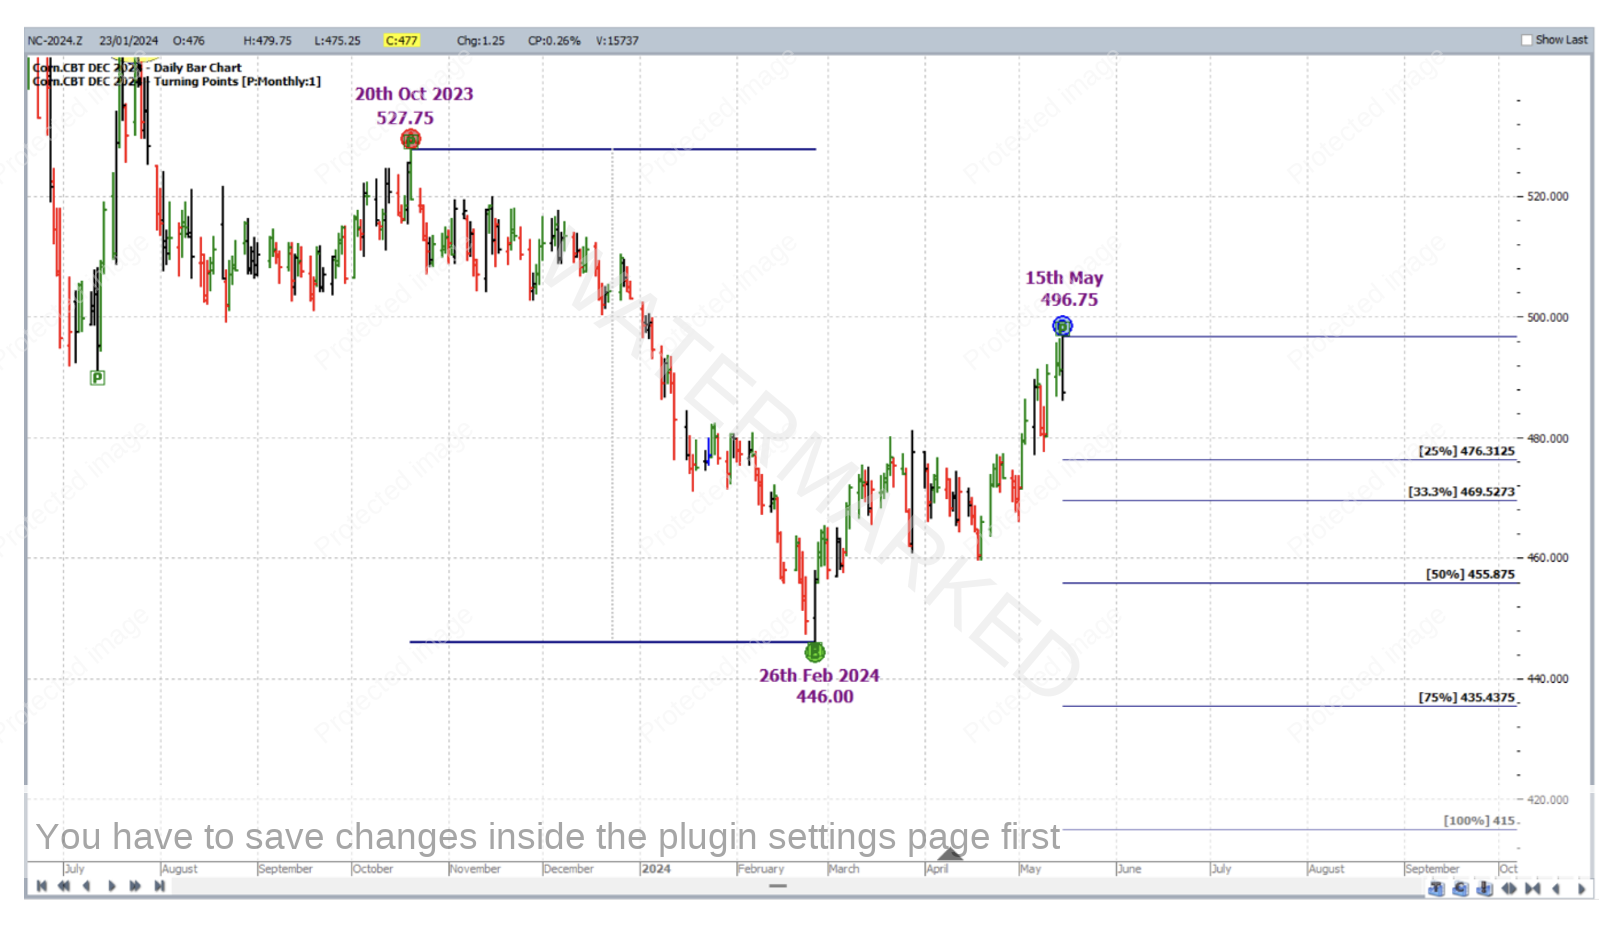
For a futures market like corn, there are a number of charts made available to the ProfitSource user, one of which is the individual contract chart for the December 2024 Corn futures contract, chart symbol NC-2024.Z. On 14 May 2024 the market reached a high of 496.25 US cents per bushel, only false breaking by one point the 50% resistance level (496.50, rounded down to the nearest point) of the Ranges Resistance Card applied from the July 2023 high to the February 2024 low as shown below.
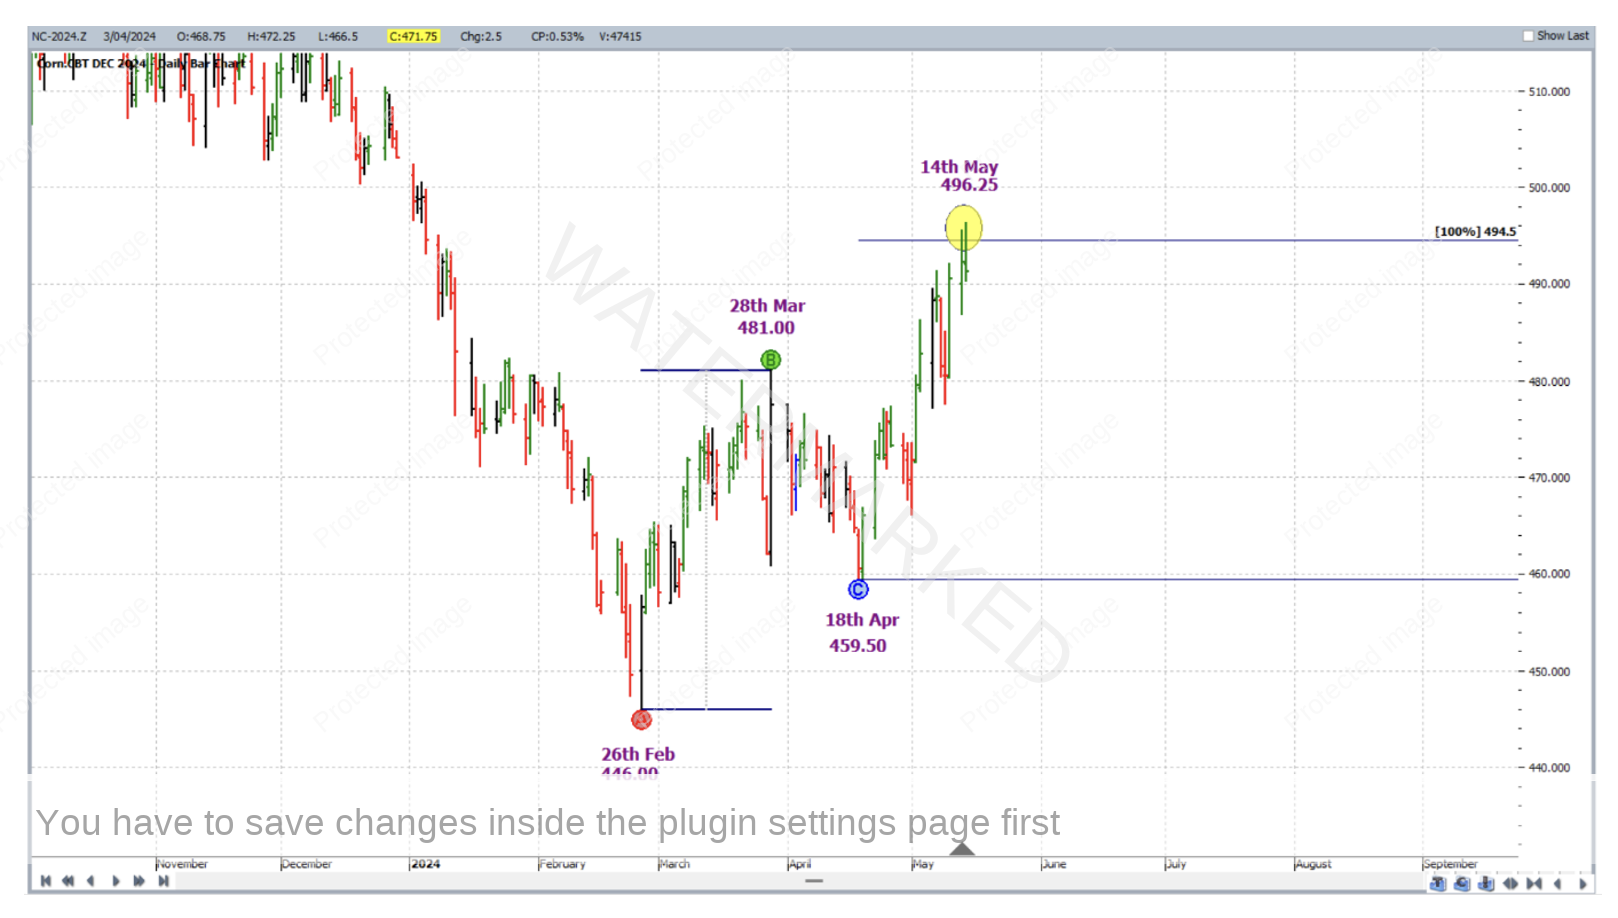
But this only gave one reason to watch for a change in trend. What else was there? Applying the ABC Pressure Points Tool as follows:
Point A 26 February 2024 low 446.00
Point B 28 March 2024 high 481.00
Point C 18 April 2024 low 459.50
It can be seen that the 100% milestone (494.50) was still within a tolerable distance of the 14 May 2024 top.
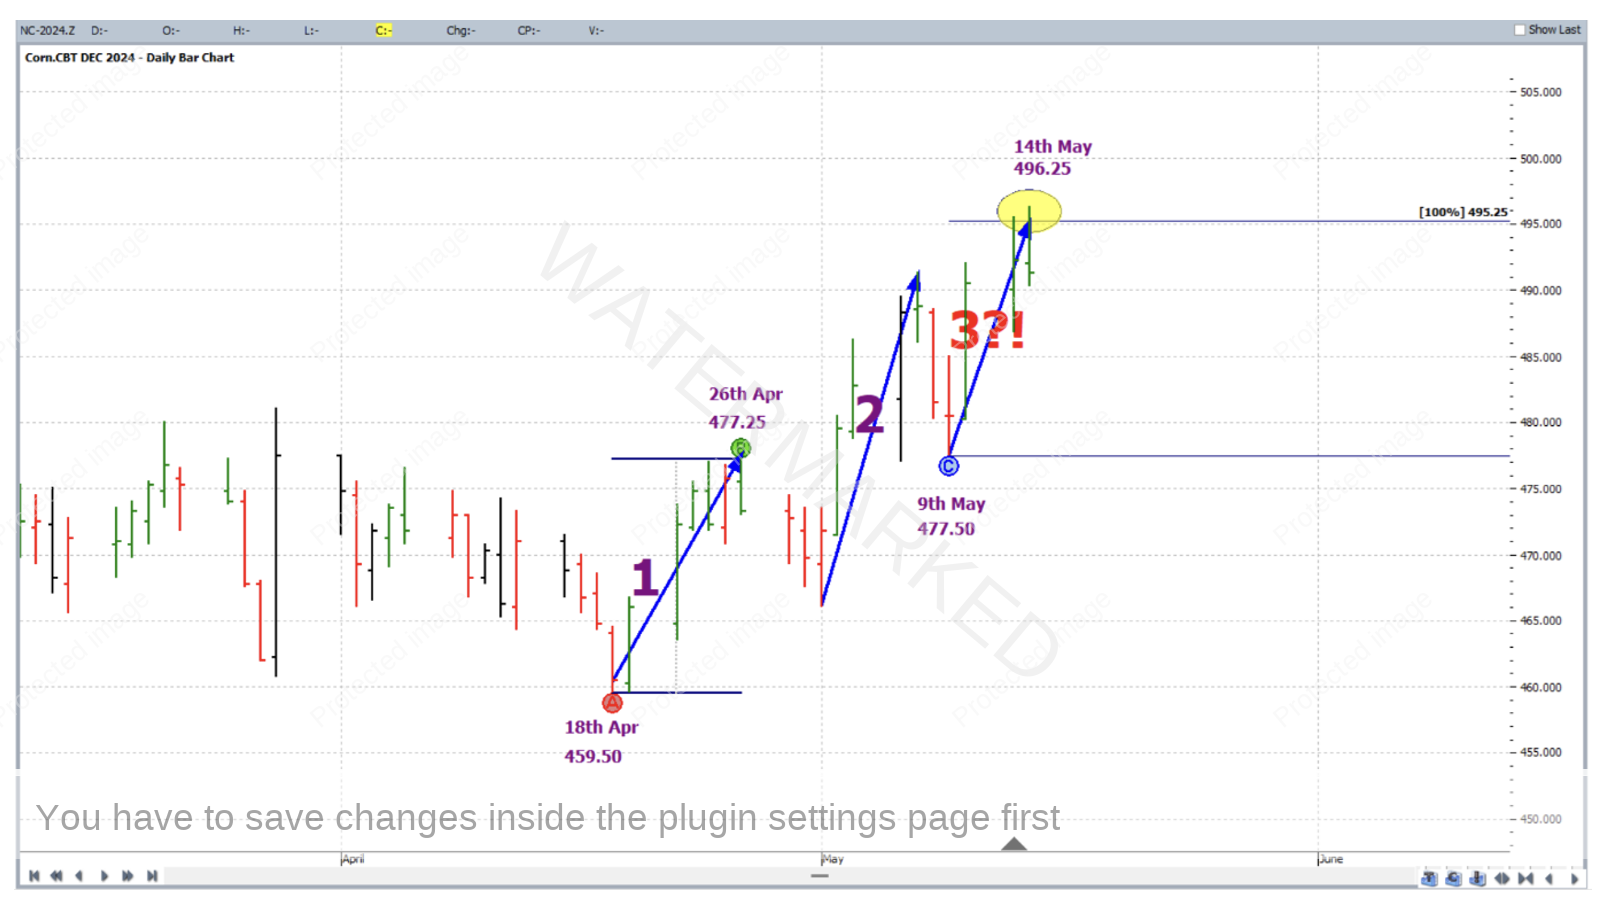
Then, a smaller picture application of the ABC Pressure Points Tool demonstrates the FRO and sections of the market in action – 3 minor sections terminating at the 100% milestone (495.25) with points A, B and C placed on the chart as shown below.
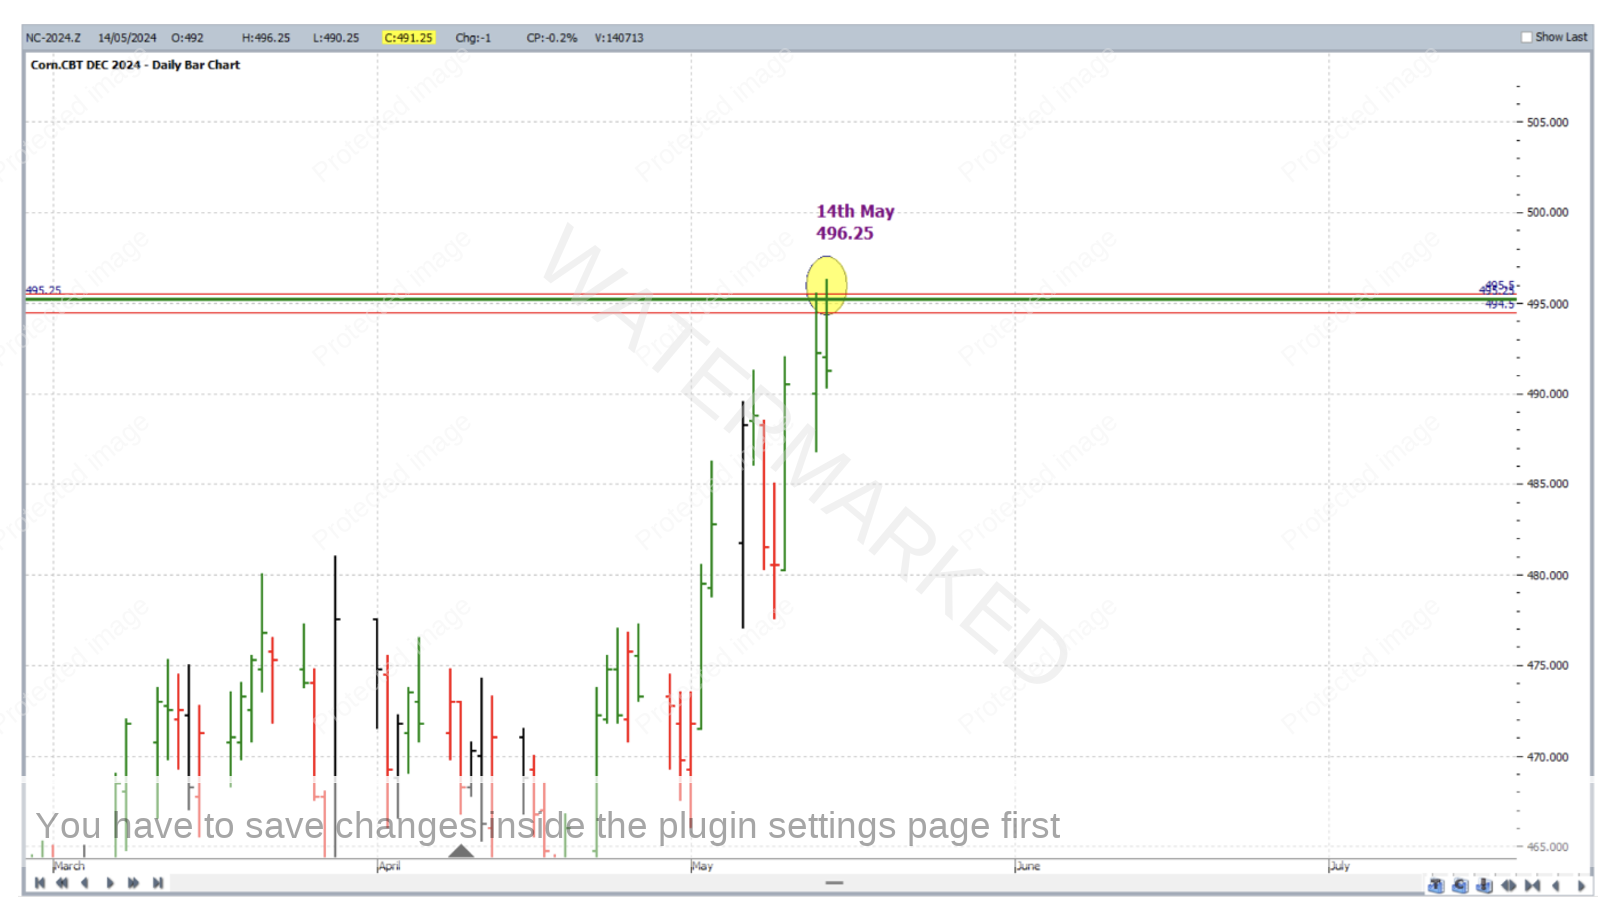
The three analysis outputs discussed in the charts above averaged at 495.25 – this is shown by the thick green line on the chart below. And to demonstrate that all three outputs clustered closely to one another and themselves came relatively close to the high of 14 May 2024, they are also shown, in red.
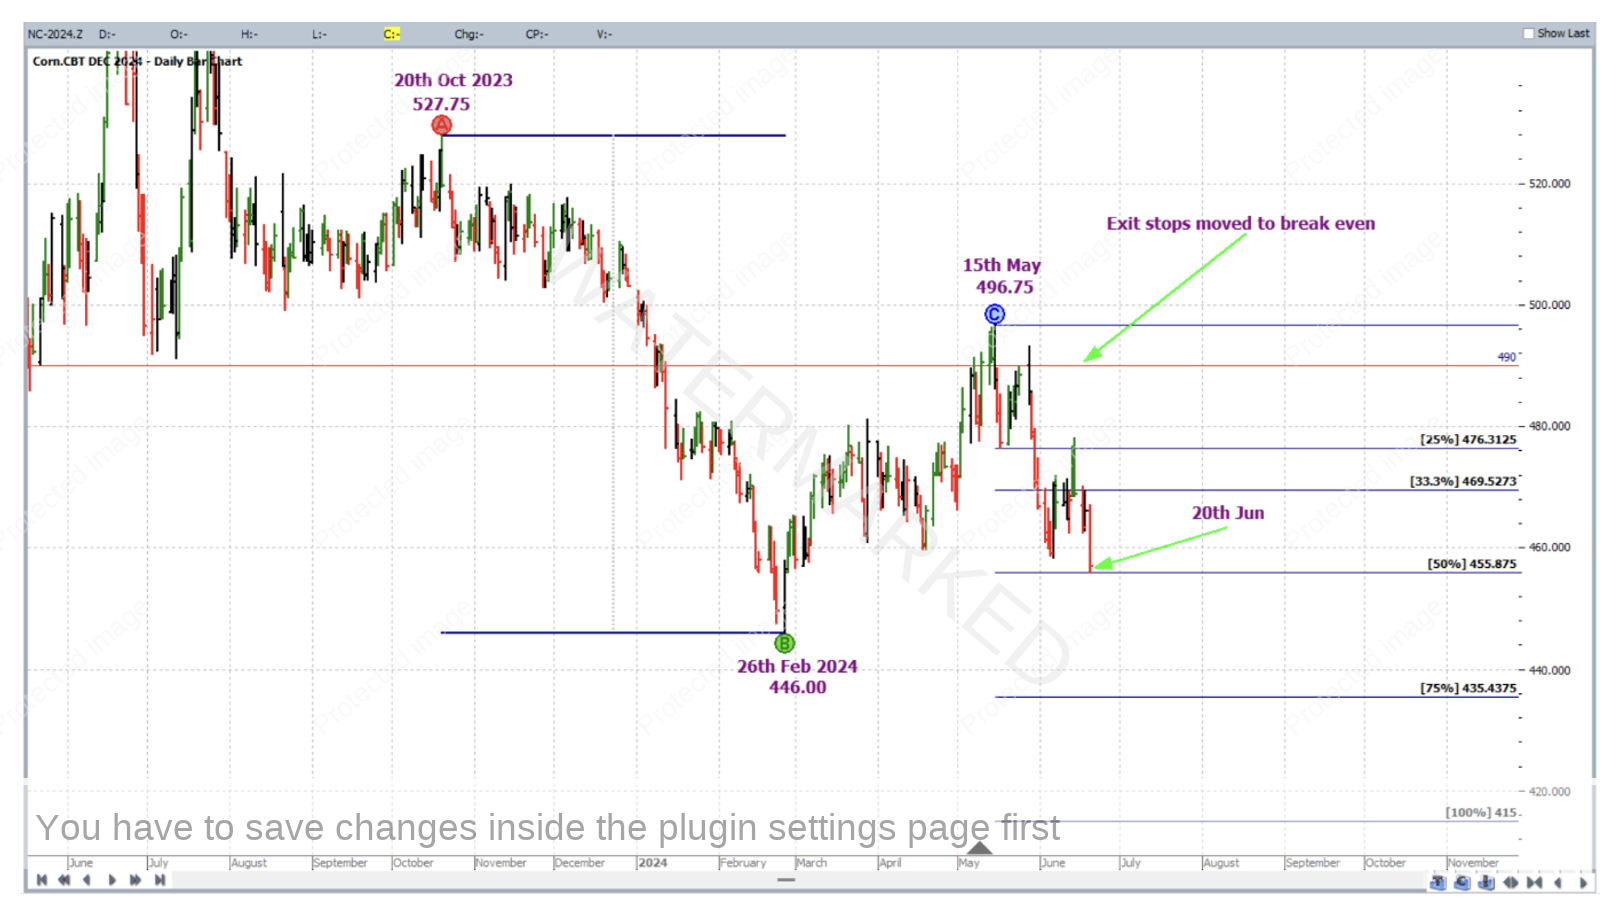
So that’s the analysis which lead to the anticipation of a change in trend in the middle of May this year. What about the execution of a trade entry and trading plan? 15 May 2024 gave an outside reversal day which by close of trading that day had us expecting the daily swing chart to turn down, with entry stops for a short position at 490.00, with initial exit stops at 497.00 i.e. one point above the high of the outside day itself. The last monthly swing in the same direction (that from the October 2023 high to the February 2024 low) was the AB reference range for the trade, with Point C on the 15 May 2024 high itself with stops to be managed currency style as though in a large ABC trade.
On 20 June 2024, the market reached the 50% milestone and exit stops were moved to break even.
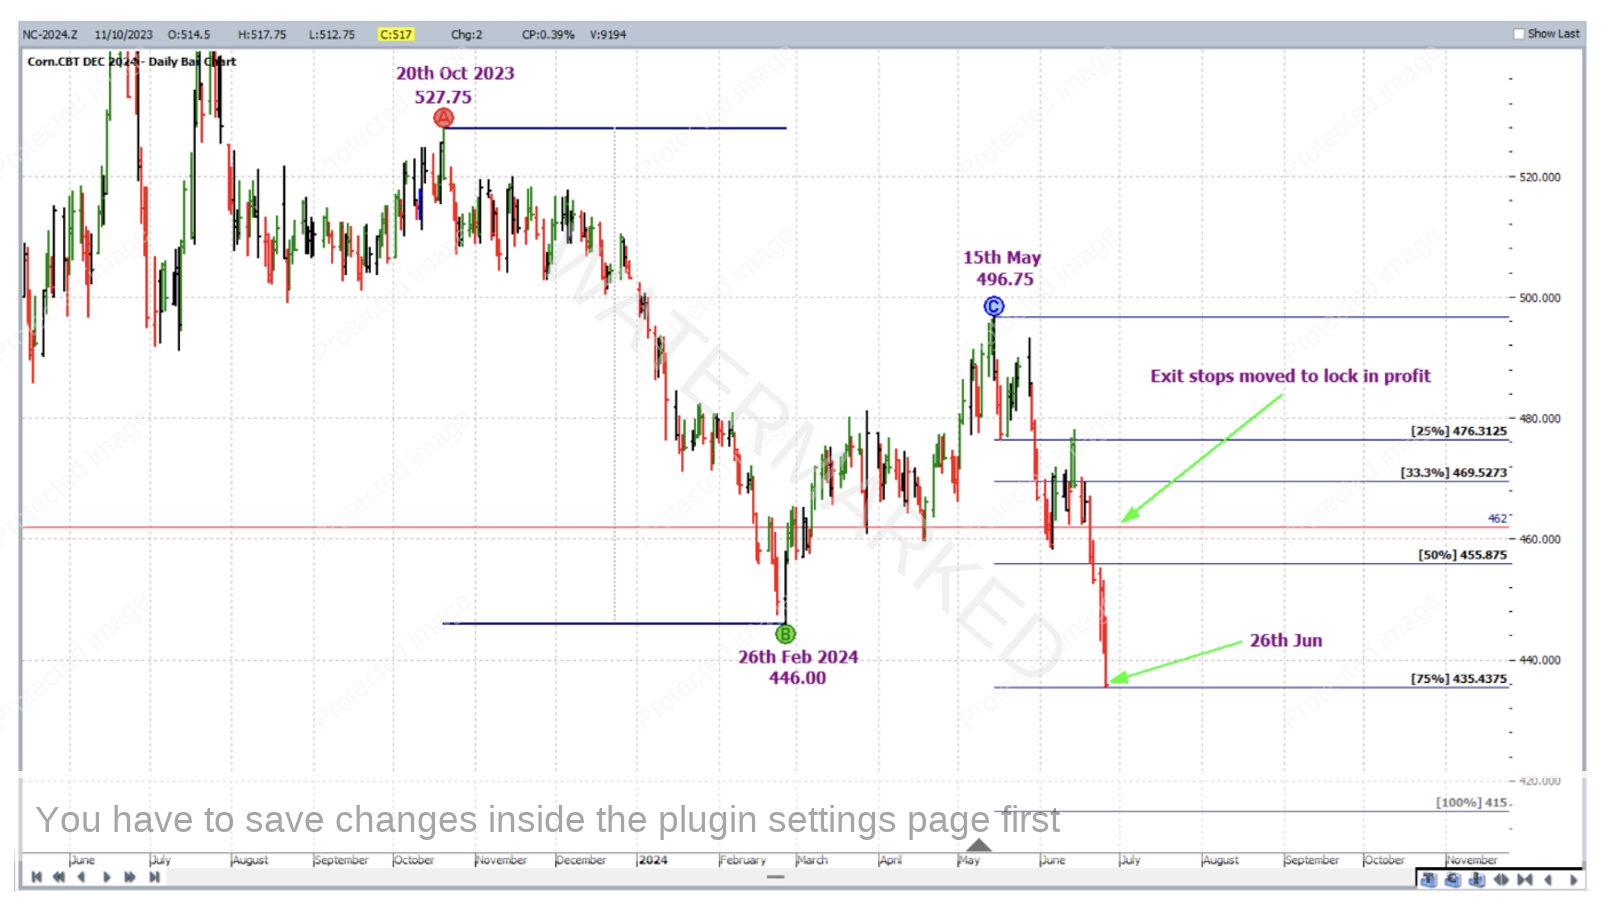
On 26 June 2024, the 75% milestone was reached and exit stops were moved to 6 cents above the 50% milestone to lock in profit.
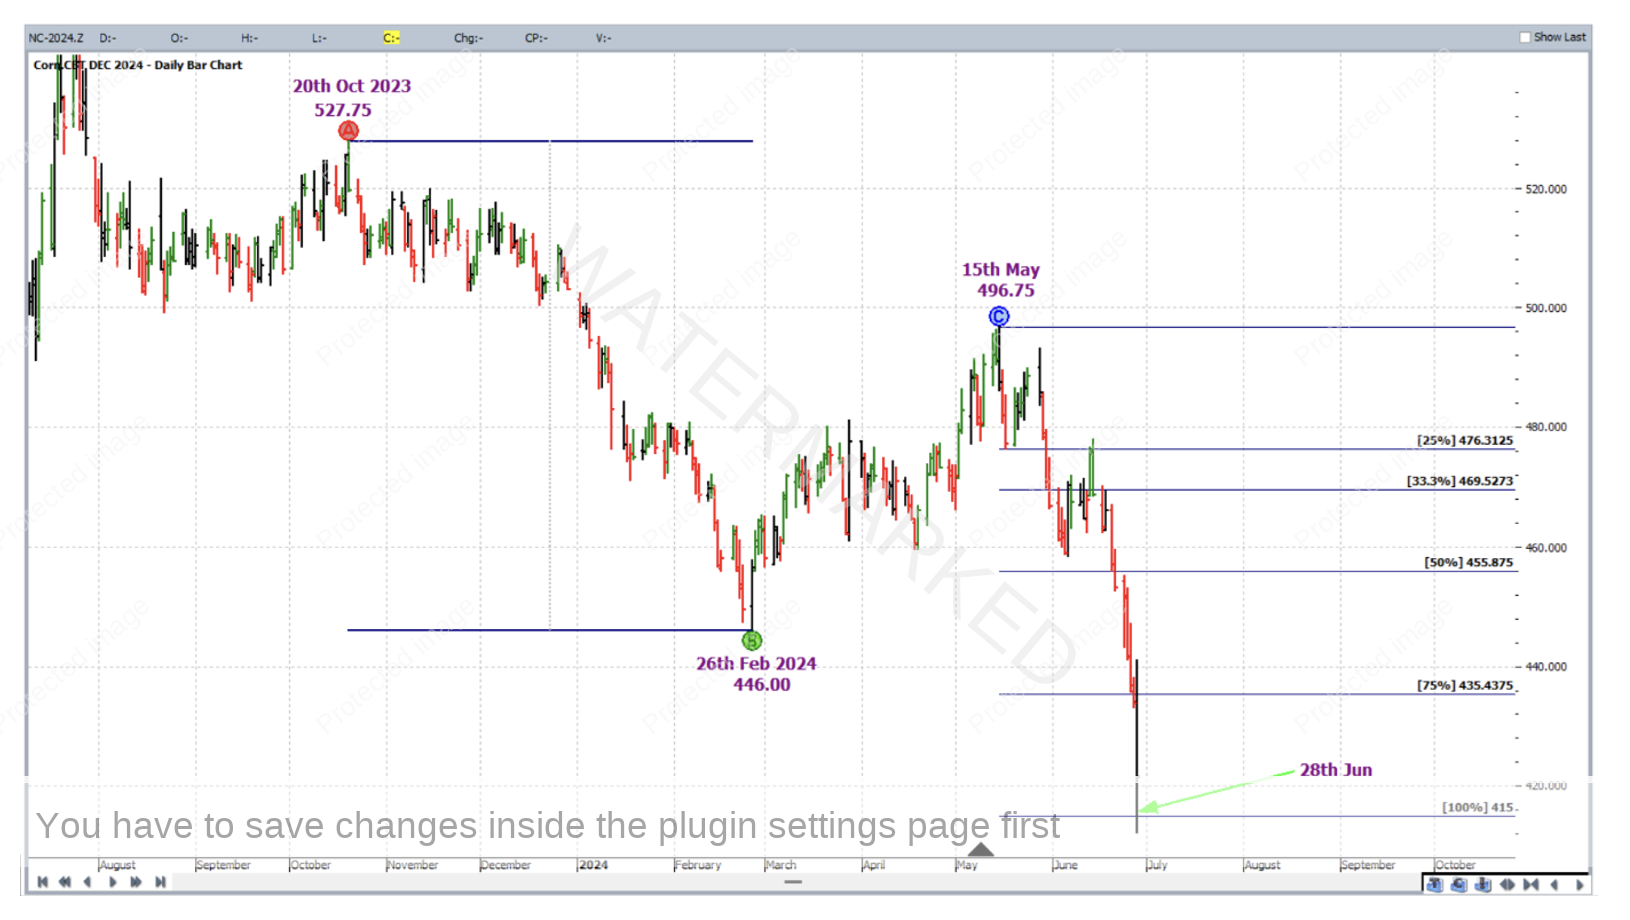
Then on 28 June 2024 the market reached the 100% milestone and the trade exited at 415.
Let’s now take a look at the rewards. In terms of the Reward to Risk Ratio:
Initial Risk: 497 – 490 = 7.00 = 28 points (point size is 0.25)
Reward: 490 – 415 = 75.00 = 300 points
Reward to Risk Ratio: 75/7 = approximately 10.7 to 1
According to the contract specifications for Corn futures on the CME Group website, each point of price movement changes the value of one contract by $12.50USD. So in absolute USD terms the risk and reward for each contract of the trade was determined as:
Risk = $12.50 x 28 = $350
Reward = $12.50 x 300 = $3,750
In AUD terms at the time of taking profit this reward was approximately $5,680.
Risking 5% of the account size for this trade, the resulting percentage change to the account size after taking profits would be:
10.7 x 5% = 54%
CFD brokers will offer access to this strongly trending market via a CFD, where much smaller position sizes are available.
Work Hard, work smart.
Andrew Baraniak
