Setting Up for a Trade
Hello and welcome to the February edition of the Platinum Newsletter. Last month I wrote about repeating time frames on FMG and how David teaches us a method of forecasting by watching for expanding or contracting price ranges within a time frame.
This month I would like to use a little more foresight to set up for potential trading opportunities on the SPI using a combination of repeating time frames, Time by Degrees and swing charts.
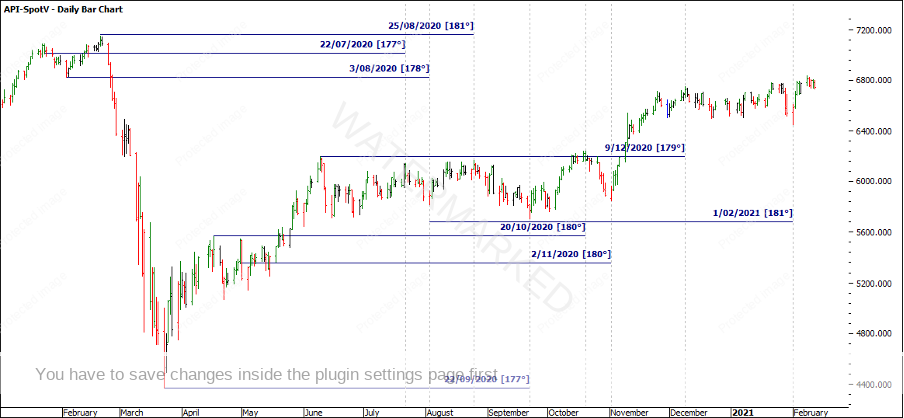
The SPI has been very kind to us from a ‘history repeats’ perspective. In Chart 1 I’ve applied 180 degrees from many tops and bottoms that gives more tops and bottoms, and normally within a day or two of a perfect 180 degrees.
Chart 1
Trading wise, not all of these turns have provided great Risk to Reward Ratios from an end of day trading basis, however, I will come back to that later!
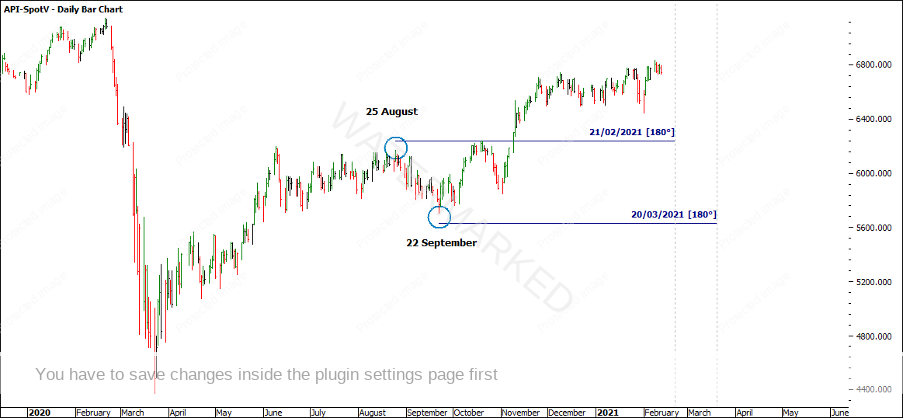
What it does do, is prove the theory of Time by Degrees working in a market. So if we know history repeats, I would like to know when I could potentially expect history to repeat again. If I continue to run 180 degrees from previous turns the next dates of interest I get are:
- 25 August 2020 + 180 degrees = 21 February 2021
- 22 September 2020 + 180 degrees = 20 March 2021
Both these dates are quite recognisable. David tells us he sees three to four good setups per year which is 6-8 good trading opportunities per year, a trade into a date and a trade out of a date. The March seasonal date is starting to show up for a number of reasons, it’s 180 degrees from the September low and also 360 degrees from the 23 March 2020 low. See Chart 2 for these potential beacon dates.
Chart 2
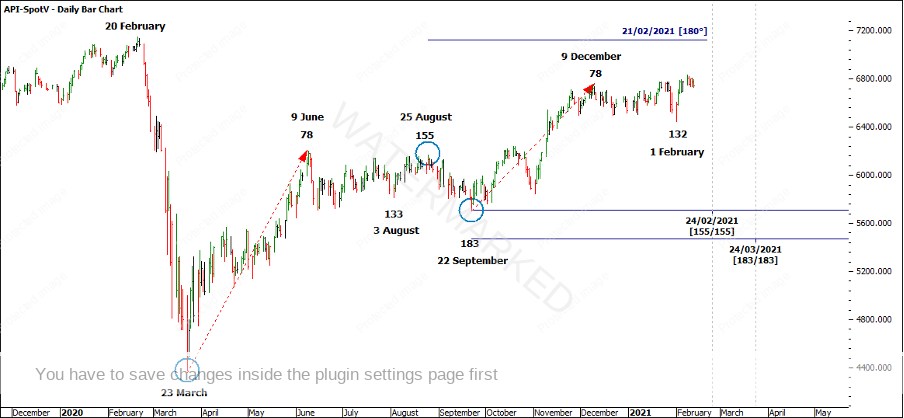
Now that I have two dates to look for, I would like to see some balancing time or repeating time frames lining up with these potential dates. Study Chart 3 below carefully and take your time. I have labelled two starting points or ‘Zero dates’ to run counts from. The first being the 23 March 2020 low and the second being the 22 September 2020 low. Can you see a sequence or history repeating?
Chart 3
I have some dates of interest to watch, however, there are never any guarantees that the market will produce a turn. As such, I now look to my swing charts and watch all of my swing chart milestones and rate the strength of the swing ranges. For those who feel like they could use some more work in this area, be sure to check out the new Active Trader Program Online Training that was released last year.
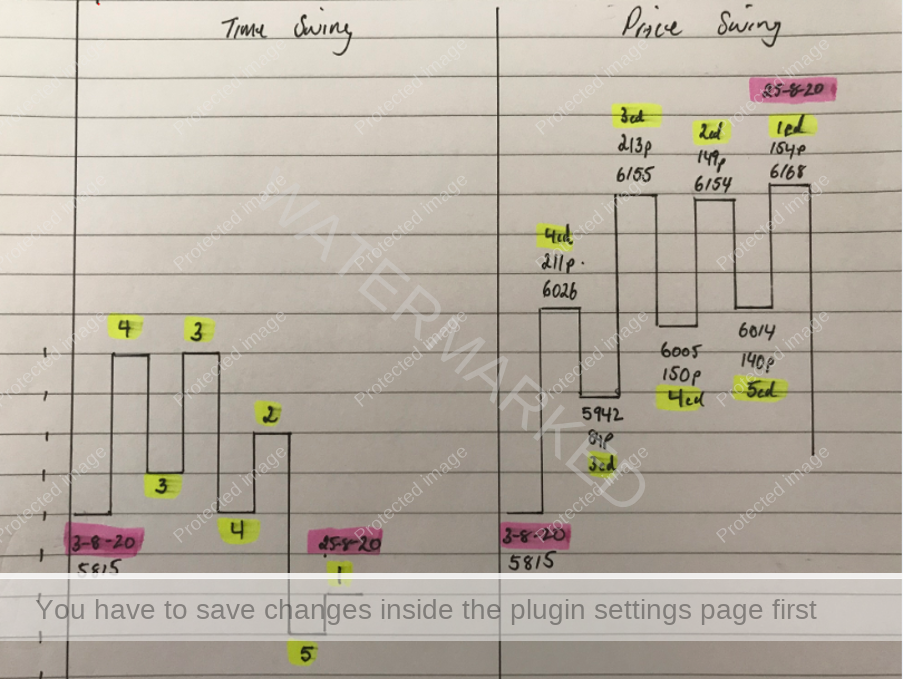
For practice, the 25th of August top was 181 degrees from the 20 February top. From a sections of the market and swing chart perspective, I feel the last weekly swing range can be broken down into three sections with the last section ending with a repeating daily swing range. A very interesting exercise to do here is to draw the day counts as a time swing chart. To make it a quick exercise you don’t even need a ruler. Just do it freehand! In this case, look at the below photo. Both swing charts represent the exact same period of time. The left is the time swing chart and the right is the price swing. Even though price was trending up into the 25 August top, time was not. Even though I have the day counts labelled on my price swing chart the time swing chart is just another way of looking at it.
Chart 4
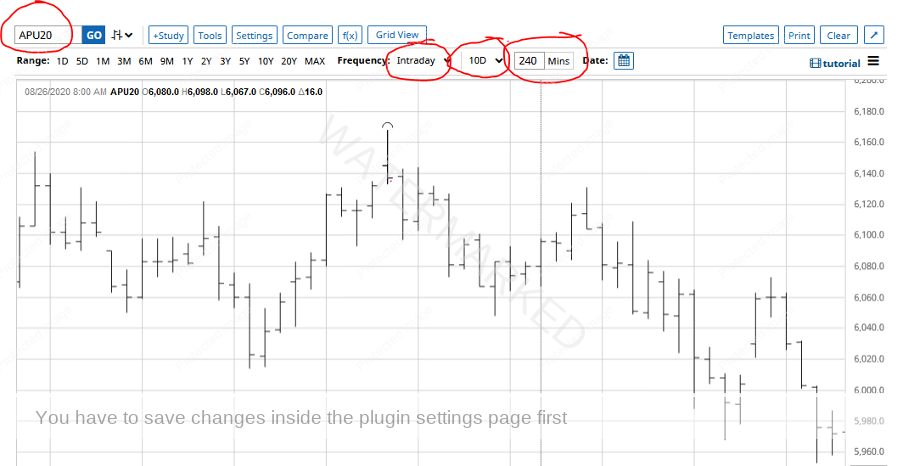
Now back to risk to reward! If you type in APU20 into Barchart.com, you can have a look at the contract month chart that was trading at the time of the 25 August top. In this case, it was the September contract with the most volume. In Chart 5 you can see how I’ve set the frequency to intraday, the time interval to 10 days and 240 minutes to get a 4 hour swing chart.
Chart 5
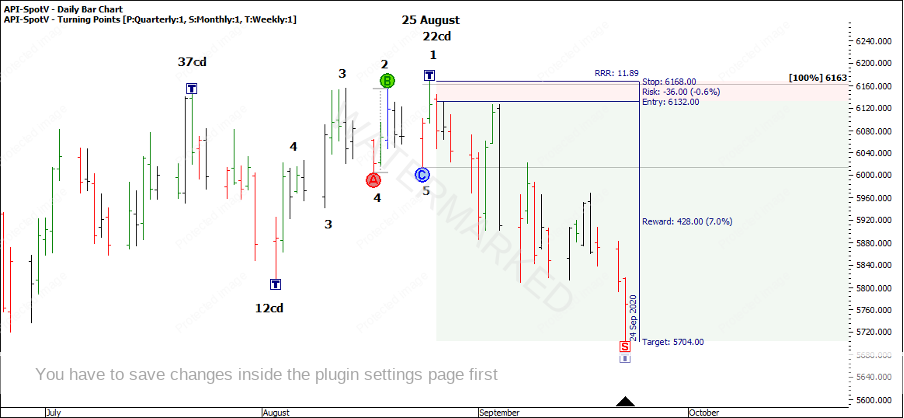
Breaking down the last daily swing range up into the 25th August, see how you may have entered using a 4-hour swing chart to reduce the risk down to 37 points per contract and a potential RRR of over 11:1 on an weekly swing move of 464 points. 37 points x $25/point = $925 risk per contract. If you managed to get out at 11:1 that would be a profit of $10,175 profit per contract. See Chart 6 below.
Chart 6
All this is just being prepared for the next trading opportunity. History repeats so the better you know your market… well, the better!
Happy trading,
Gus Hingeley
