Setting Up for a Trade Continued…
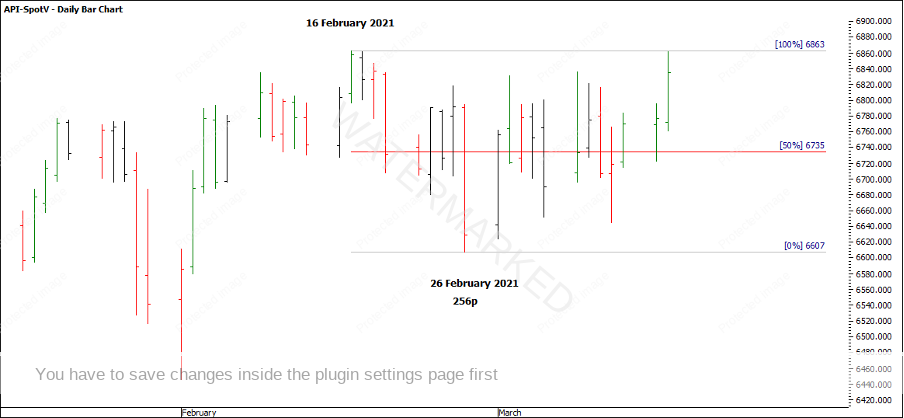
Welcome to the March edition of the Platinum Newsletter. One month on from the February edition and if you’d run a competition to guess the price of the SPI by mid-March then choosing the price this time last month would have probably made you the winner! Needless to say, the SPI is in a tight sideways trading pattern, and if you take the Ranges Resistance Card and apply it from the 16 February top to the 26 February low, you can see the market has traded at 6735 points or the 50% level nearly every day since.
Chart 1
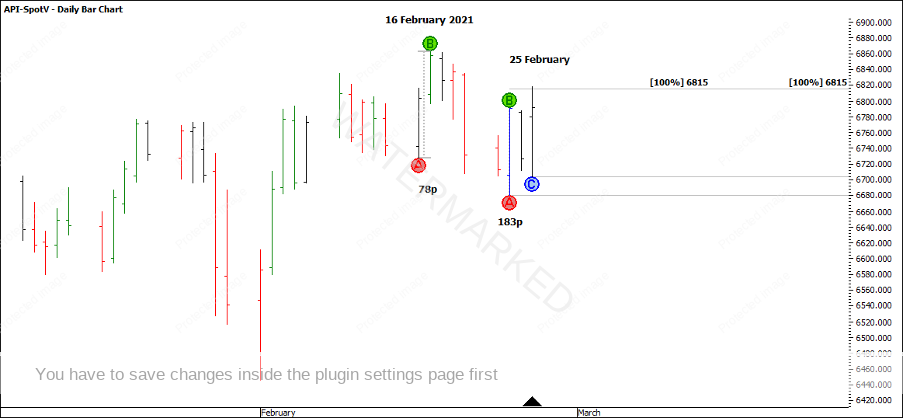
You can easily burn a lot of capital during these sideways periods if you’re not careful as you can often see signals from a swing chart to enter both directions. My initial thought was the SPI could have made a top around the February Red Time by Degrees date; however, the recent weekly top came in on the 16th of February, but still a very strong date. Out of the 16 February top, the daily swing chart gave a daily overbalance in price to the downside followed by two repeating ranges into a mini-cluster at 6815. See Chart 2.
Chart 2
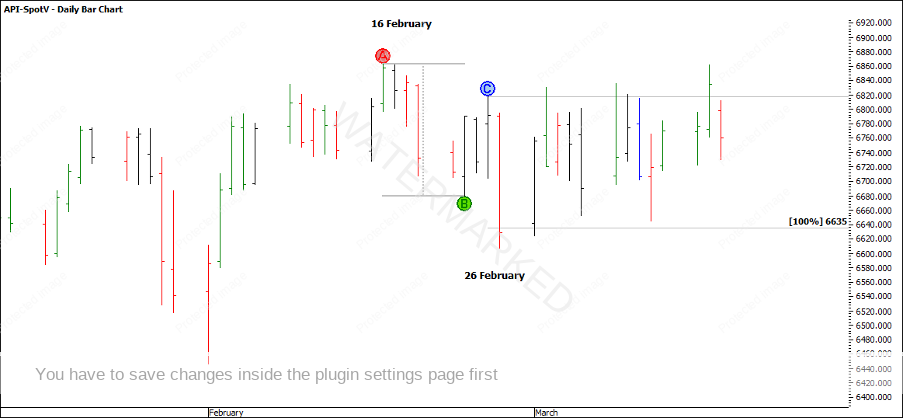
If you drill down to an hourly swing chart, the 25 February top also exhibited a nice balancing of time on an hourly perspective. If you used this as a time frame to enter a trade with, this would have seen you short with less than 30 points of risk. However, all that work and a lack of a trending market didn’t produce the results deserved. All the market could do was one day down and then many days sideways.
Chart 3
In this scenario, it’s very hard to make money if you’re looking to trade the weekly or monthly swing ranges and it is best just to sit out and let the market unfold.
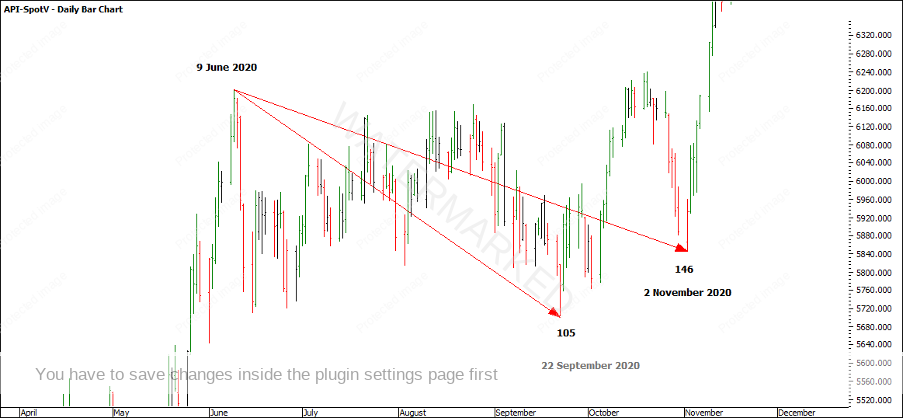
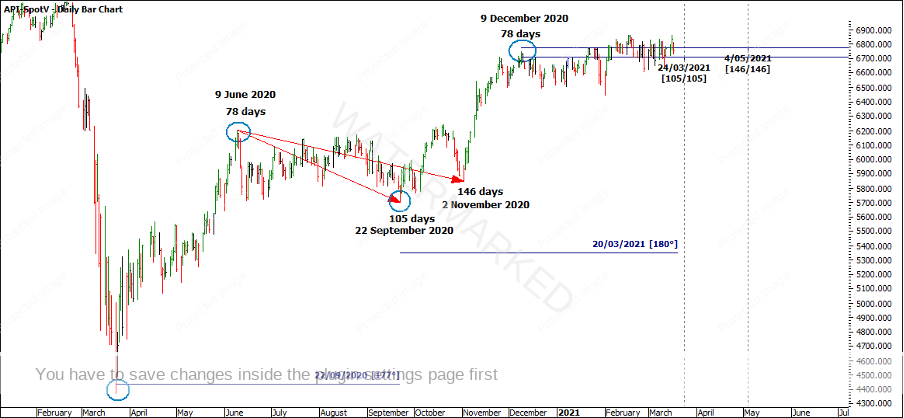
You could also go back over previous sideways moves to see what the usual time frames are that sideways periods occur in. The last time the SPI was in a tight sideways pattern started from the 9 June 2020 top. Depending on your perspective this narrow trading range either ended with a low on the 22 September at 105 days or the 2 November low at 146 days before the uptrend continued.
Chart 4
If I apply Time Trend Analysis, Balancing of Time and Time by Degrees starting from the 23 March 2020 low, I still see around the March Seasonal date as a date of interest to watch for a potential change in trend.
Chart 5
However coming back to my initial point, if the market continues in a sideways pattern, it’s easy to be triggered in and out quickly without reward. Therefore I want to be prepared for a trending market but also be wary of the sideways non-trending market if the current pattern continues.
Happy trading
Gus Hingeley
