Setting Up Your Next Quarter
As we begin to wind down and draw to a close the calendar year 2020, there are no doubt many of us, (especially me) who will be using the holiday period to reflect, renew and reset for 2021. We are spoilt in the southern hemisphere in that we combine the summer holidays and Christmas /New Year period with warmer weather and the desire to relax.
A reminder is important though that the Northern Hemisphere takes a short break and gets back to the grind quicker than we do. This means we can see significant market movements in this period whilst we are on hiatus. The Christmas rally cycle is well documented amongst our community. I try to set up for the first quarter of next year now so that I can feel prepared when the temptations of not being as sharp as usual can creep in.
I would hope that you have revisited your 2020 goals and laid some markers for 2021 as a normal course of running your trading business. This year I have written several articles on BHP, our global mining darling. The commodities narrative has been less focused in the year when pandemics, Brexit and US politics have hogged the news headlines.
We are starting to see the concerns of a China/Australia trade war loom with the “wolf warrior diplomacy” style placing a great deal of concern on the business landscape for 2021 and beyond. A quick review of revenue lines for BHP shows that iron ore and copper form the two main sources of income for BHP. These markets will be key for the fortunes of BHP into Q1 and beyond.
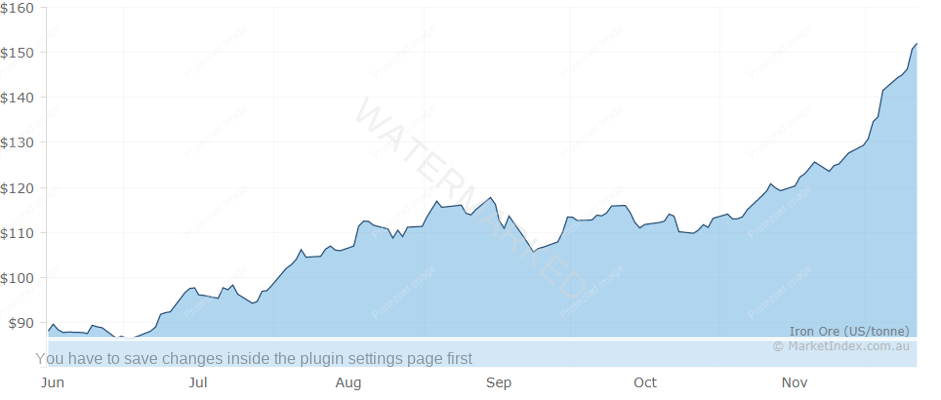
Iron Ore is a hard commodity to trade and study as it does not sit on a commodities exchange per se, contracts are negotiated behind closed doors and we see varying prices and grades accordingly. Essentially, it’s a non-standardised contract.
Chart 1 shows us how the US Dollar pricing of Iron Ore has increased dramatically in 2021 to its current levels of approximately $150 a tonne.
Chart 1- Iron Ore Line Chart 2021
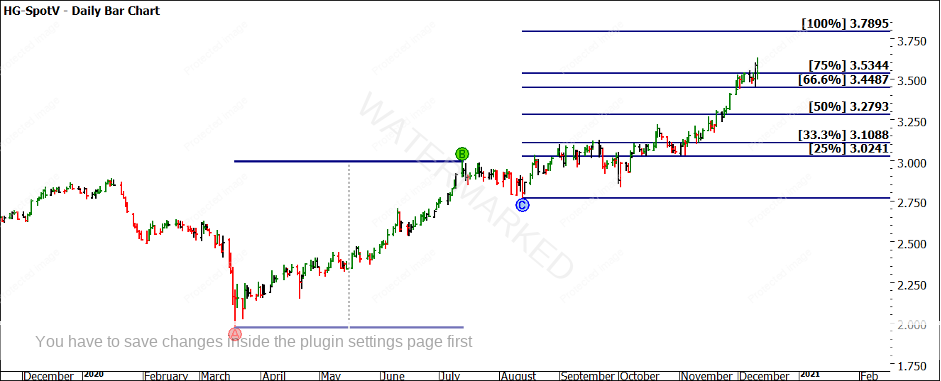
Add to this we have seen High-Grade Copper experience a strong surge from March this year as seen in Chart 2 where the second leg of 2020 is approaching 100% of the previous range. I would recommend revisiting the articles I penned this year on Copper for some background on this move. I would add one more filter to view BHP through before I dive into the actual stock chart.
Chart 2- HG-SpotV Weekly Chart
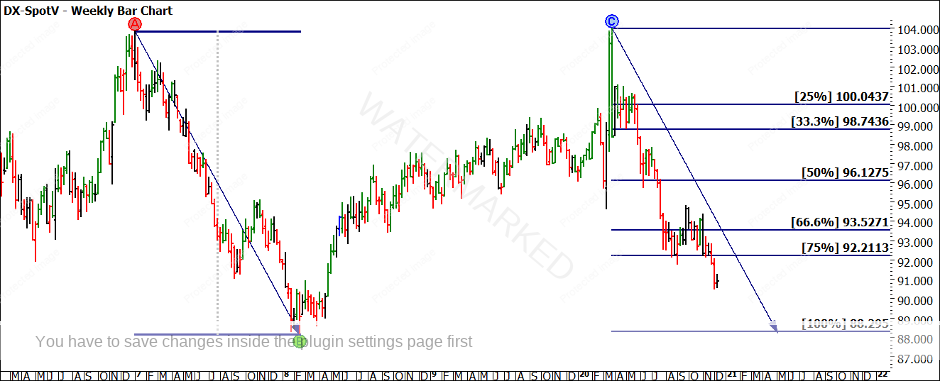
Chart 3 gives us the Us Dollar Index and its decline in prices has supported commodities and in turn, BHP pricing as revenue is primarily converted from USD to AUD.
Chart 3- Dollar Index Weekly Bar Chart
If we have a view on where these markets are headed, we can now look to unlock the BHP Chart and what it is telling us with regards to cycle, patterns, and relevance to history.
When setting up a market for the new year I will always look to Master Time Cycles for guidance, this will involve looking at the same years of the previous decades for guidance on where major highs/lows and trends take us. I will leave you to unearth the major takeaways but a review of 1991, 2001 and 2011 suggests that the first quarter or possibly longer is typically bullish.
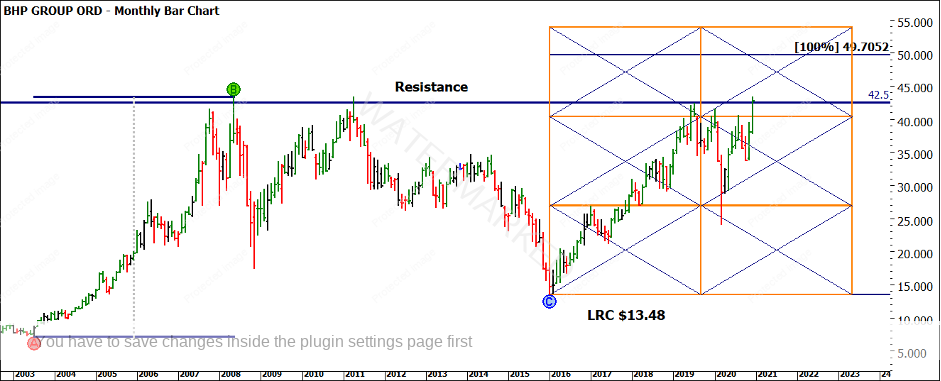
As we look at the current position of BHP, we can agree that the last period has been strong, with the potential for some resistance around old tops. I have included the previous major range pressure points and the 2015 LRC at $13.48 as a further price guide to what could lay ahead.
If we can break the All-Time Highs from here and hold above, we could see old tops become new bottoms as a springboard in 2021.
Chart 4 – BHP Monthly Bar Chart
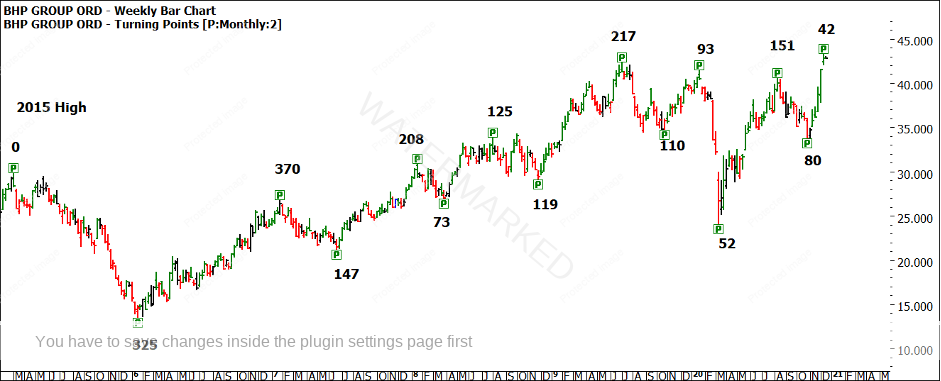
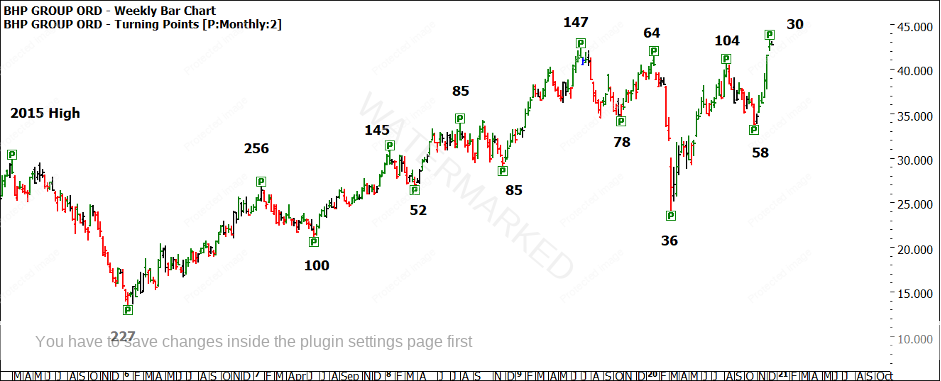
I have broken down the last 5 years of time frames between major turning points. The two charts examine the calendar and trading day counts and there should be some numbers familiar to you and repeating (which is our prime focus).
I could lay out the harmonies for you but there is nothing more powerful for your own outcomes than to do the work yourself. Measuring time frames is the easy part (let’s call that the science). The artistry is in pulling them together to weave a roadmap into next year. That is and remains the hardest aspect of markets as a Gann student. We have the raw materials, we need to understand how to combine them in the recipe.
Chart 5- BHP Weekly Bar Chart Calendar Day Counts
Chart 6- BHP Weekly Bar Chart Trading Day Counts
Let me encourage you to not just examine the harmonies between each turn, there is also top to top and bottom to bottom time frames that are waiting to be tested.
If you read my latest general newsletter article this month, you will know my thoughts around this year. It will leave a lasting mark on many people and our civilisation will not be what it was before COVID-19 ever again. That is not all bad though, we must look to 2021 as a new opportunity with lots of high reward to risk trades ahead. I passionately believe that next year will offer the best trading conditions ever for those who are prepared and better still watching and ready before the move not after.
I hope for you a safe and relaxing Christmas period and your best year of trading to come.
Good Trading
Aaron Lynch
