Setup to Fail?
When you have a setup in play that you have been working on for a while, and the setup has worked in the past, you’ll find yourself confident you’re following the right “heartbeat of a market”. However, in trading, you need to confront the fact that there will be times when you are wrong. The markets have a way of grading losses, a bit wrong or a lot wrong, often depends on the amount of funds that leave your account. If I look at the earlier days of trading, being wrong often meant the maximum loss I was prepared to take on the trade was realised as stops were triggered at my maximum risk.
At the start of your trading journey, you’re flat out getting the basics to all come together and the head space does not really allow for “managing yourself” out of a position to cushion the blow. In fact, you often manage to extend losses by massaging the plan and “hoping” for a silver bullet to come along. Please understand I am not suggesting that losing trades can all be managed back into a winning position.
What I am suggesting is that when you get to know a market and you see the same setups both pre and post them coming into play you start to realise you are not seeing what you are expecting in terms of price action moving in your favour. You start to realise you could be wrong even before the market tells you.
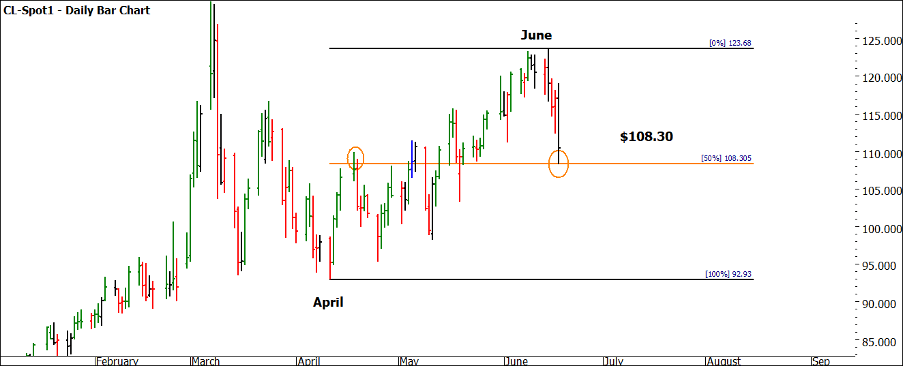
The case in point was the setup I discussed last month in Crude Oil coming out of the seasonal date in June. Now nothing gets me more excited than 50% pullbacks into seasonal dates as we see in Chart 1 below from last month.
Chart 1 – Daily Bar Chart CL-Spot1
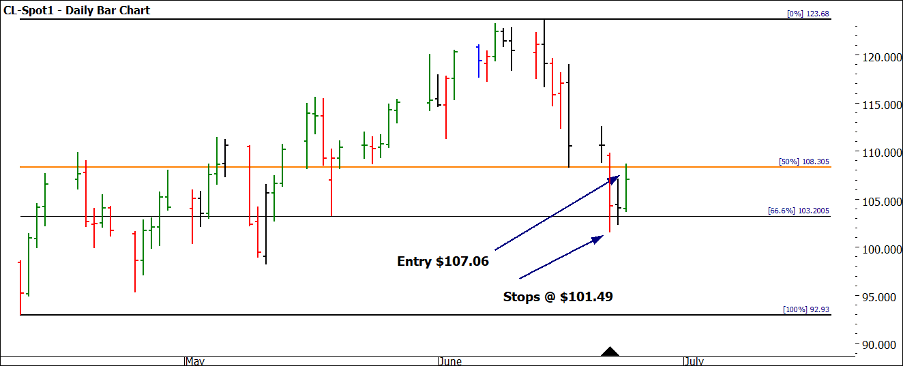
Chart 2 shows that the price action pushed through the 50% area at $108.30 and then bottomed on 22 June followed by an inside day. This should have been a sign that the market was weaker than initially expected and potentially following a different drumbeat (more dates around the second week of the month not the third.)
Let’s assume we take the simplest set up, which was to enter as the 1-day swing chart turns up as we break above the high of the inside day @ $107.06 on 24 June.
Stops are as simple as below the swing bottom, approximately $5.57 risk per contract.
Chart 2 – Daily Bar Chart CL-Spot1
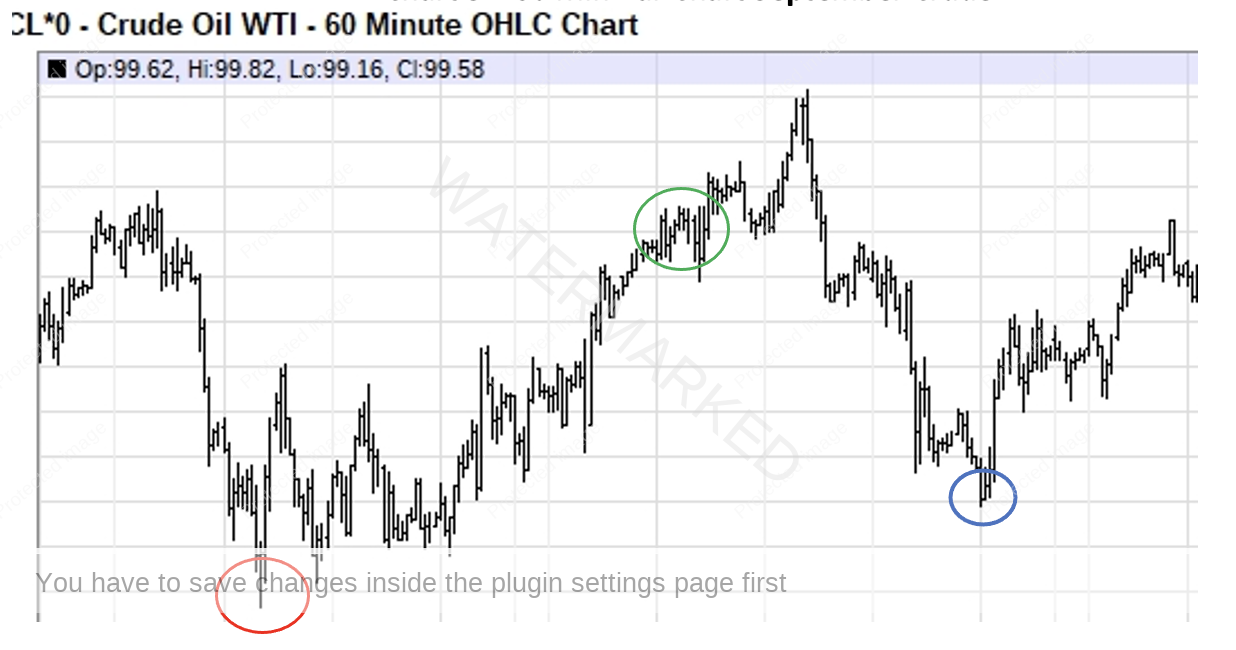
Here is where we can jump to a smaller time frame chart and assess the signs of strength or weakness. I have removed the scale for ease of reference, but this is a 60 minute bar chart of Crude and the green circle is the approximate entry and the red circle the approximate stop. As you can see the market stalled not long after entry.
Chart 3 – 60 Min Bar Chart September Crude
This was followed by a sell off to the lows at the blue circle, which at the time I felt was a good sign that the bears were being washed out and that the resumption of what I expected price action to be, had commenced.
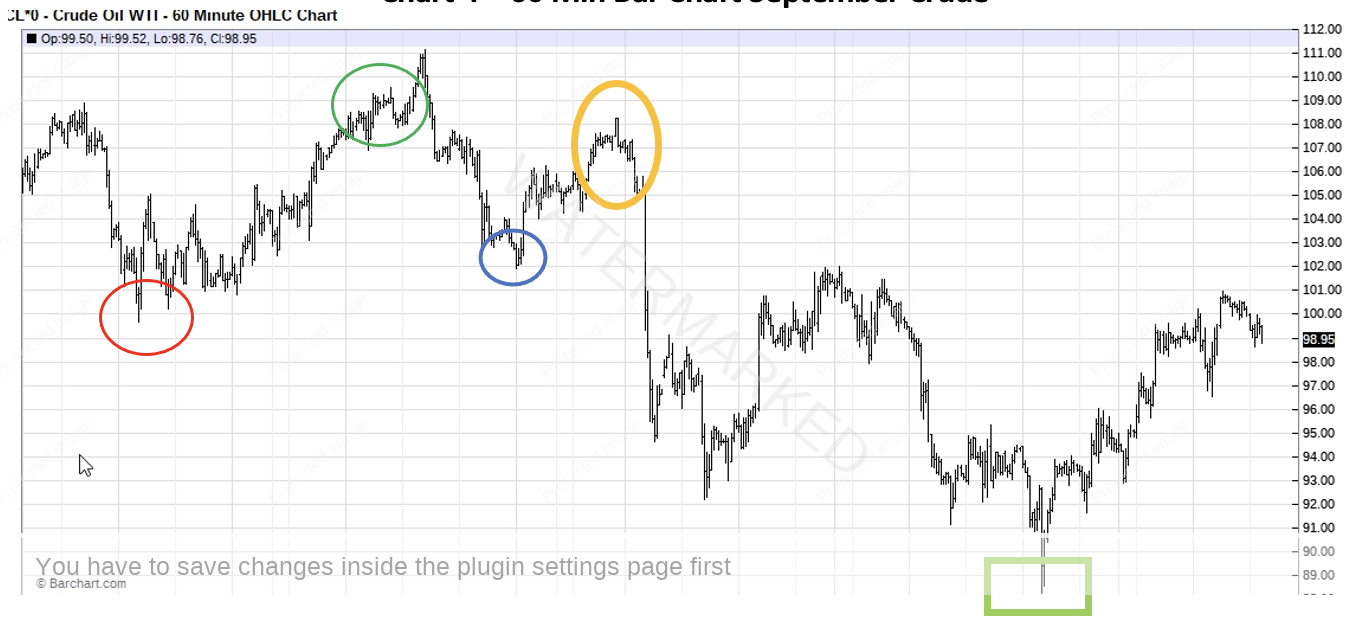
The next chart describes how the “mood” of this setup started to sour as the run up was met with huge selling pressure and a slide of prices that was a good indicator that setup was not a long and strong move.
In the past I would have watched this setup fall to my stop and deliver a blow to the balance and ego, go away and rethink my strategy once the emotions had subsided. In the early days, the access to intraday data was not as accessible and the ability to track prices and set alerts was not as easy.
If you focus on the yellow circle in the middle of the chart you can marry this up to the end of day bar on 5 July in ProfitSource. It was clearly a sign the long trade was in trouble.
Chart 4 – 60 Min Bar Chart September Crude
The point of this article is around managing a setup that is about to turn sour into something that resembles a smaller loss and a best case of a break-even position. I certainly would not advocate attempting to manage the position into a winning trade. The reason being more so around the psychological aspects more so than the technical, but that’s for another day.
In this instance there was a case for when the lows at the blue circle were broken, we could stop and reverse our position (go from long to short). As I had previously seen this as a support point, once broken, the long scenario was essentially dead in the water.
If you had trailed stops behind swing tops on this time frame (60 minutes) a stop and reverse could have been initiated at just under $102. This short trade was exited behind swing tops at approximately $95.50. Even simpler, we could have set a price target to close the position as a hard stop once the overall initial long and subsequent short trade broke even. By achieving this the balance and ego are somewhat more intact and more ready to tackle the next setup.
I appreciate this is not an easy thing to do, as there are several ways you can compound the initial problem. This would only be something you would attempt on a market you knew exceptionally well. A stop and reverse strategy around key setups are something you start to unlock once you have traded a statistically significant amount of time and price setups and watched the market behave around them.
I have marked one final point on the intraday chart (the green square). This low is one that may warrant some more study as it is behaving more like I would have expected the low around 22 June to “have been”. Your challenge is to look at why 14 July could be the type of low I was looking to see in June.
As you will all come to see be it in now or in the future, the key to calling time and price points in the market is to trade them for profit. We must develop our trading skills around these turns, you will progress to the point where you get the bigger turns, the art and science is to make them profitable with your trading plan.
By identifying earlier that your setup is not progressing as it should, you open another door to another skill set that is managing losses to their lowest amount and potentially best case a break-even situation.
Good Trading
Aaron Lynch


