Short, Sharp, Profitable
Banking stocks have not been an area that I used to follow with any great vigour, many new traders begin their journey by trading our local banks, and they are effectively a big 4 that all rise and fall on similar tides. They don’t seem to differ too much other than names and prices, and as they have a pretty good grip on the local market here, they can at times be easy and very challenging to trade. They can move large percentages in a short time but often need a good economic crisis or geopolitical threat to occur, so that’s not something I wish for.
You might recall last year and early in January I discussed Morgan Stanley (MS.NYSE). This had a wonderful Q4 move to the upside. Using the Lows Resistance Card we identified the level in January of $93.94 as a place to watch and the market delivered a top at $94.15 on January 2nd, 2024. The chart from the January article is Chart 1 below.
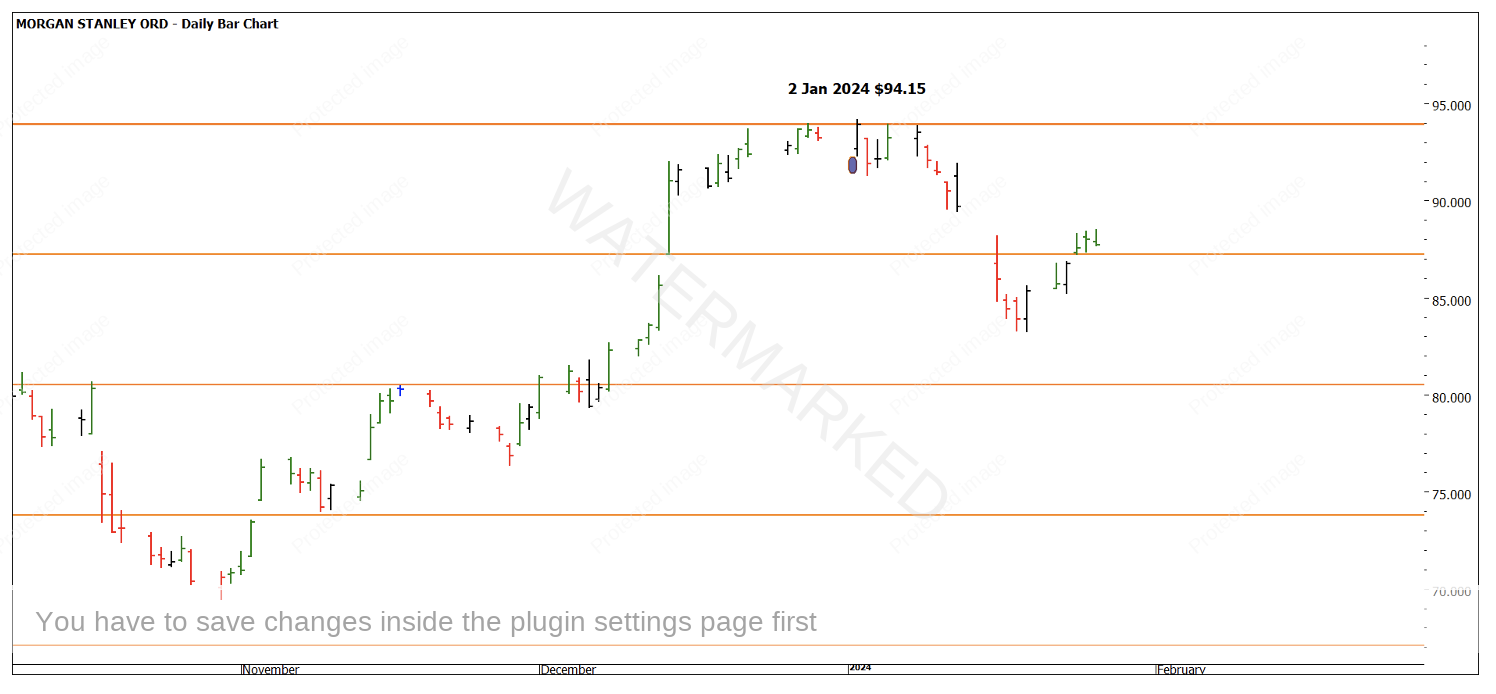
Chart 1- MS.NYSE Daily Bar Chart
At the time, my interest in this market was not as great, but I did take a moment to save some charts for 2024 including a Degree Vibration Wall Chart and I set some price alerts to notify me when the prices started to recover back to this top at approximately $94. As we know many global indexes are at record levels (or have been) so to be fair I have been keen to watch the strength of the bullish case and their conviction when bearish pressure arrived.
Chart 2 details the swing ranges on the upside into early April and you can clearly see the upside swings were shortening (weakening) into previous resistance and form reading the close prices suggested that the bulls were struggling.
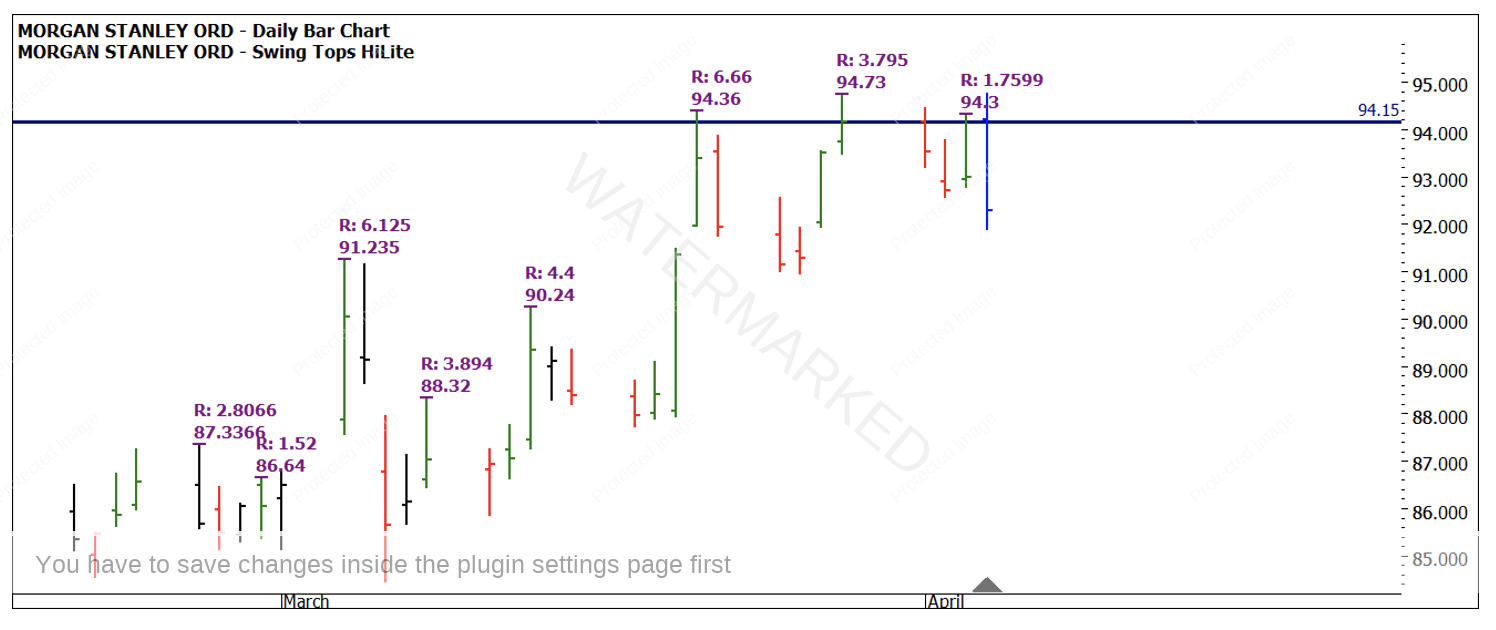
Chart 2 – MS.NYSE Daily Bar Chart
Another aspect of first dimension analysis (price) was tracking the double bottom that formed using the January /February lows to provide a further cluster of prices. Chart 3 gives us $94.18 as our price target.
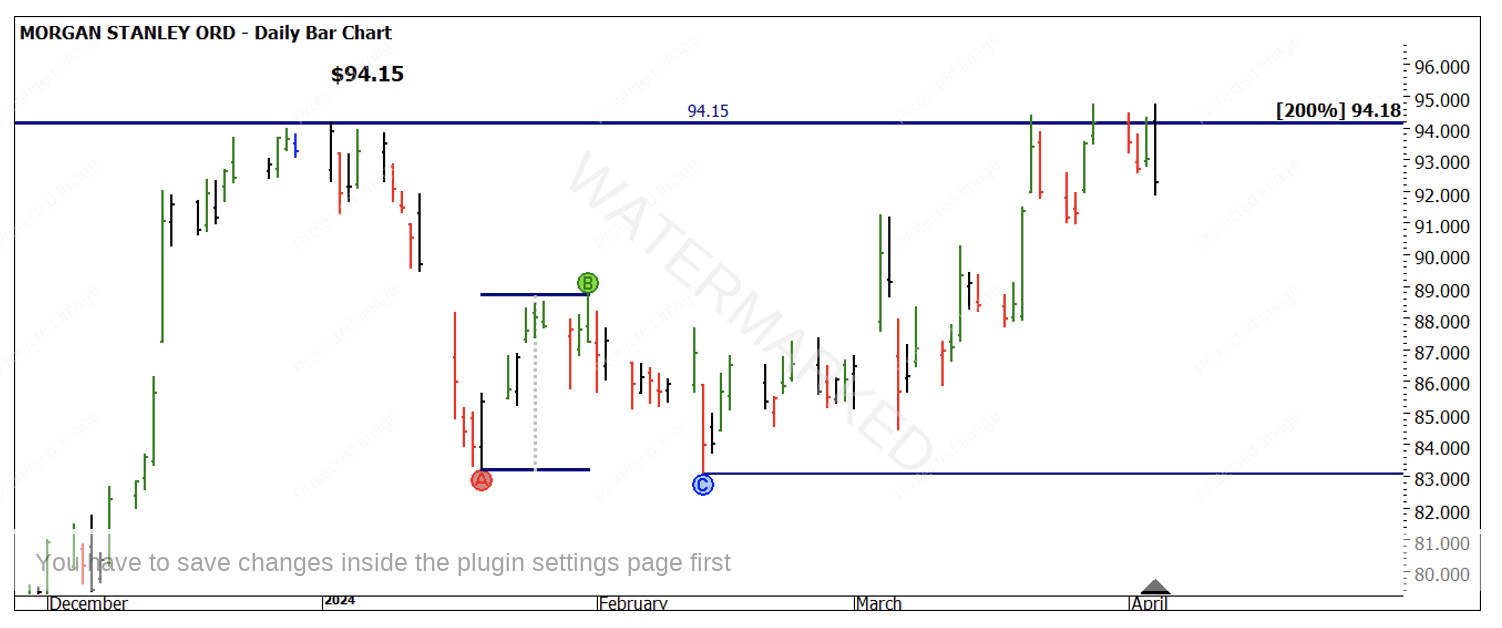
Chart 3 – MS.NYSE Daily Bar Chart
We can see the outside day as a possible first lower swing top entry and a signal day. The intraday chart, in this case a 4-hour chart, gave us a symmetrical double top (by this I mean 4 bars down 4 bars up). The two tops were 3 cents apart in price.
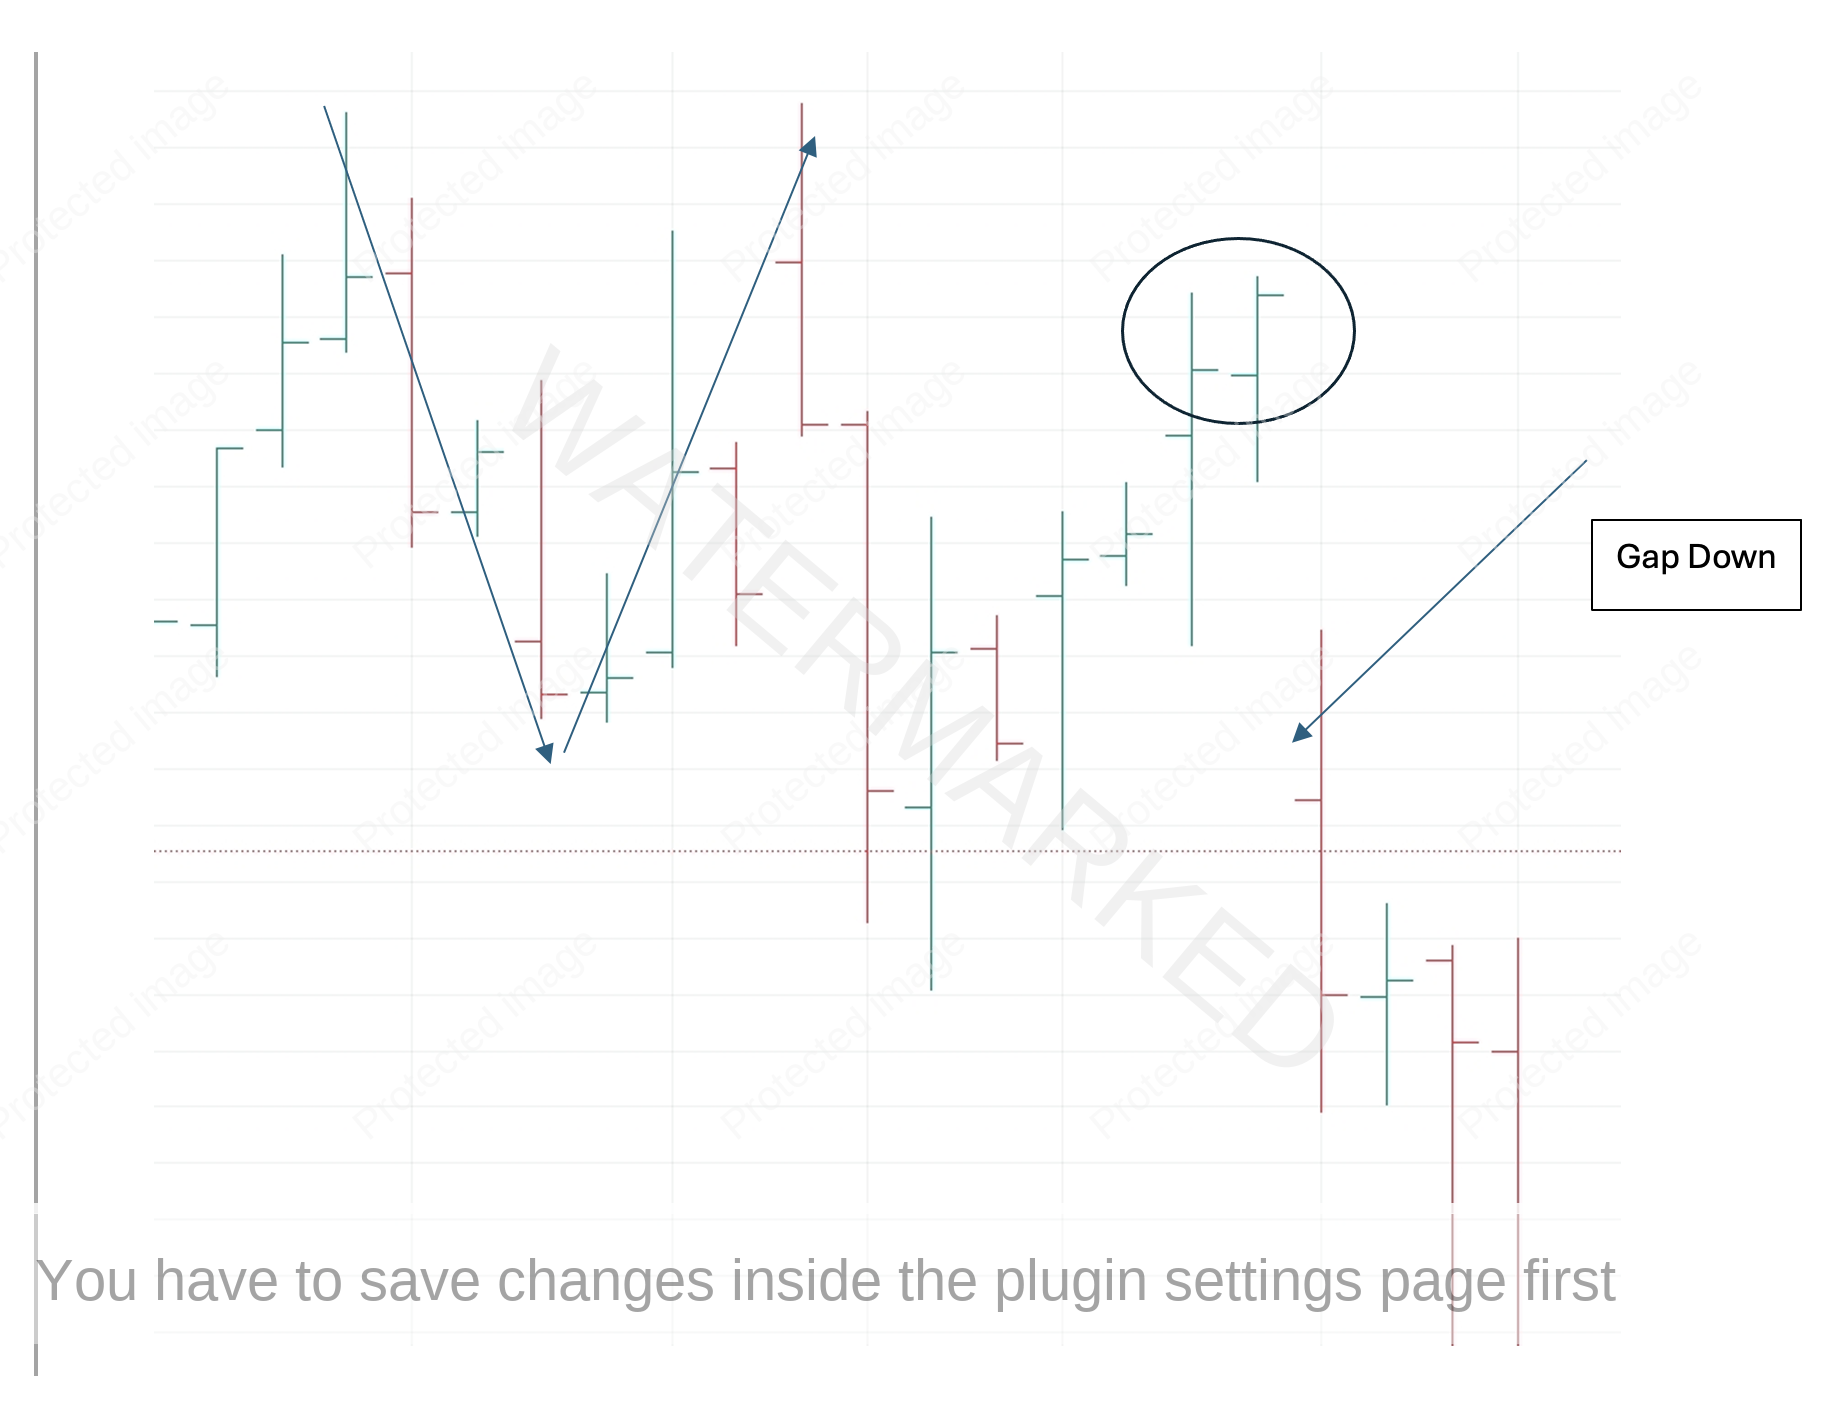
Chart 4 – MS.NYSE 4 Hour Bar Chart
Entry signals can be different for everyone in terms of preferred risk management and how much confirmation is needed in your trading plan.
The most aggressive entry is the intraday confirmation of double tops, this would have seen the entry at approximately $93.56 as the double top was confirmed with a down bar. The second area could have been on the close of the outside day and then more conservatively the confirmation of a lower swing top. This was challenged by the gap down on April 10th and would have seen greater risk per share needed for entry, hence reducing position size.
Chart 5 below labels the 3 styles of entry on the end of day chart.
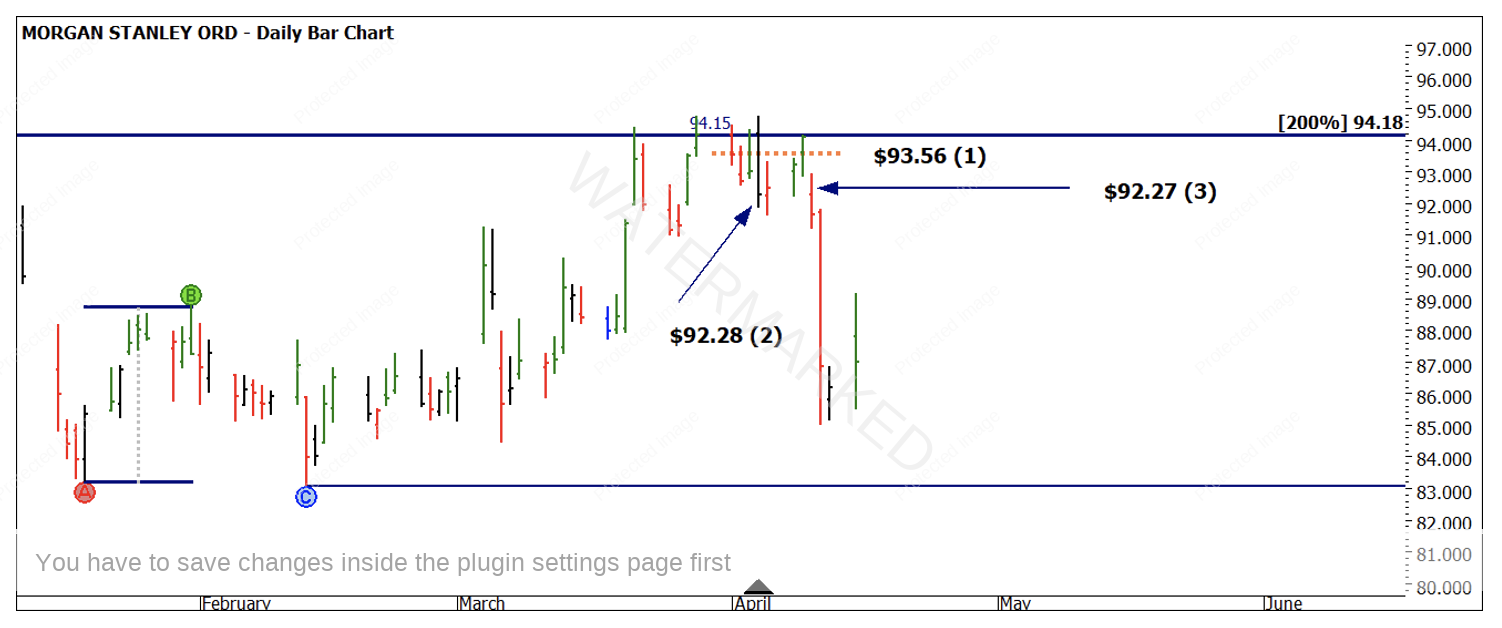
Chart 5 – MS.NYSE Daily Bar Chart
The question you may ask is, was I considering the sell off to be this rapid? And the answer is very clearly no. I had not expected the movement to be this rapid. This can be off putting especially if you’re setting yourself for an extended period in the trade (weeks not days).
Chart 6 shows the reward and risk of how the position worked out, in practice we saw a reward of approximately 5.6 to 1. The rationale for exit was the large move and wanting to capture that return if the market had overbalanced and was storming back.
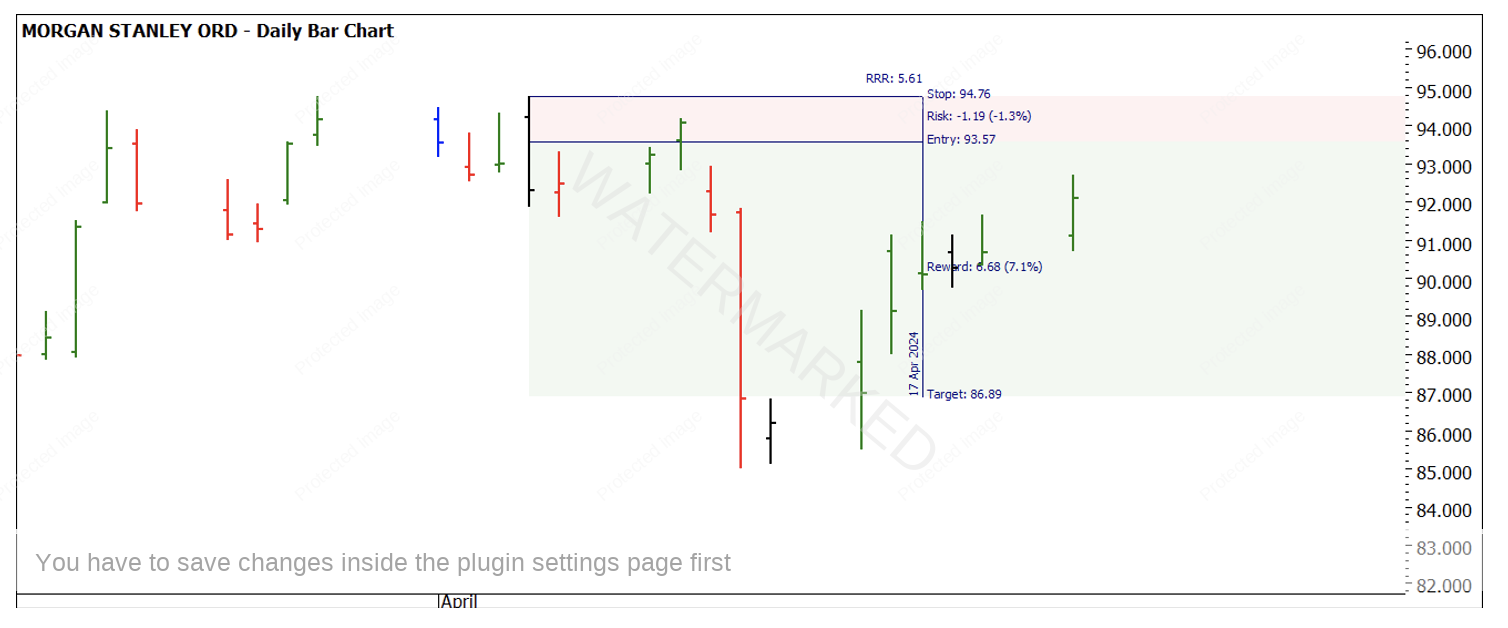
Chart 6 – MS.NYSE Daily Bar Chart
I note a lower top could still form and continue to develop but we can wait for that to confirm.
A final note to add regarding the vibration wall charts, for those familiar with their use, using the 2 January high of 2024 should allow you to see the time pressure that was building into early April.
Good Trading
Aaron Lynch