Silver Rising
It’s challenging to think how quick this year has moved; we are close the end of the calendar year and it feels to me like we only just started. This year has proven that markets remain tough and will do just enough to mug you if you’re not on top of your game.
I would like to start by wishing you all a relaxing and safe Christmas and successful 2026.
The main theme of this month’s discussion will be on the Silver market and its recent rise to all time highs. First, though, I did want to mention the progress of the case study I discussed last month, Boeing.
This was a case of form reading a set up in the market and seeing what looked to me like a big A B C point that also had some harmony of price. The three legs of the trade are approximately $120, $240 and $180. These numbers are familiar to us, and whilst I have rounded the numbers to suit my narrative, I am comfortable to say that’s how I saw it in my analysis.
An entry was possible around the low, and the reward sits comfortably in our favour, and I will look forward to seeing this develop through December.
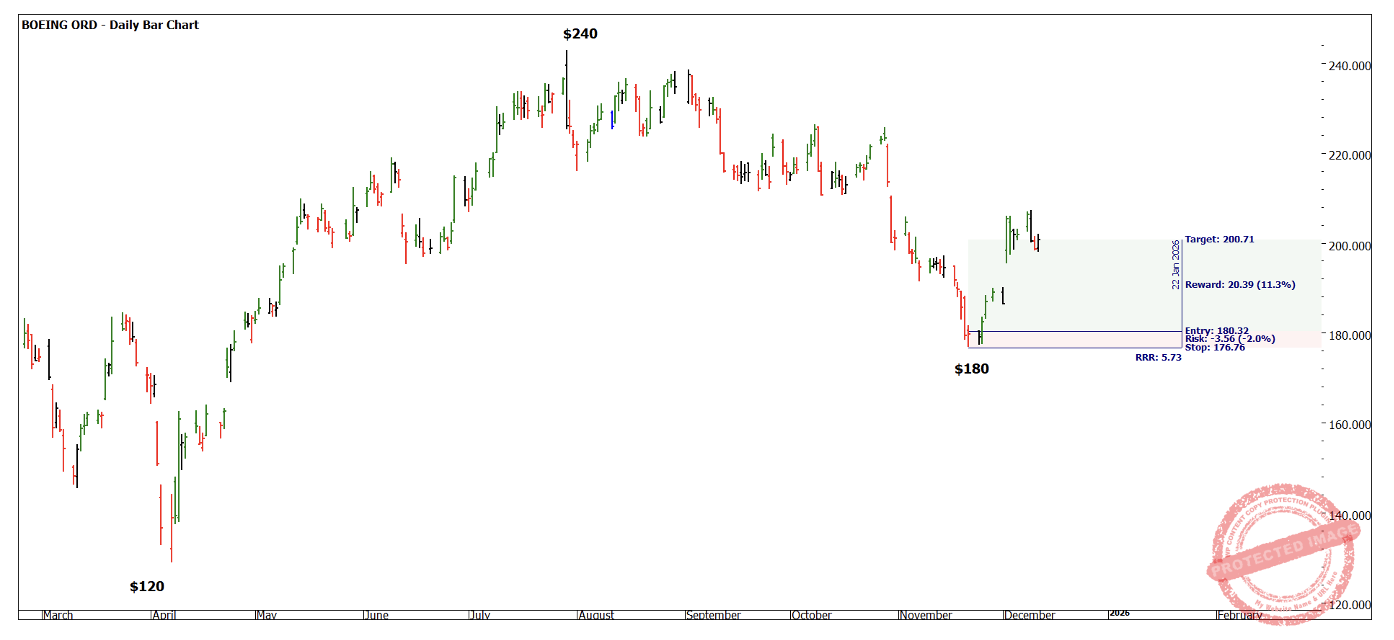
Chart 1 – Daily Bar Chart BA
Silver has become a focus for many as Gold commenced its charge in the current cycle. The sibling of precious metals, much like Gold, has had constant discussion around its relative value to Gold and when, if ever, if would explode in the same way.
In recent sessions we have seen Silver make fresh highs in USD. There is some price harmony with the move from 2001 with an approximate repeat of the $45 range. A quick calculation tells us the time it has taken has been somewhat shorter to achieve it.
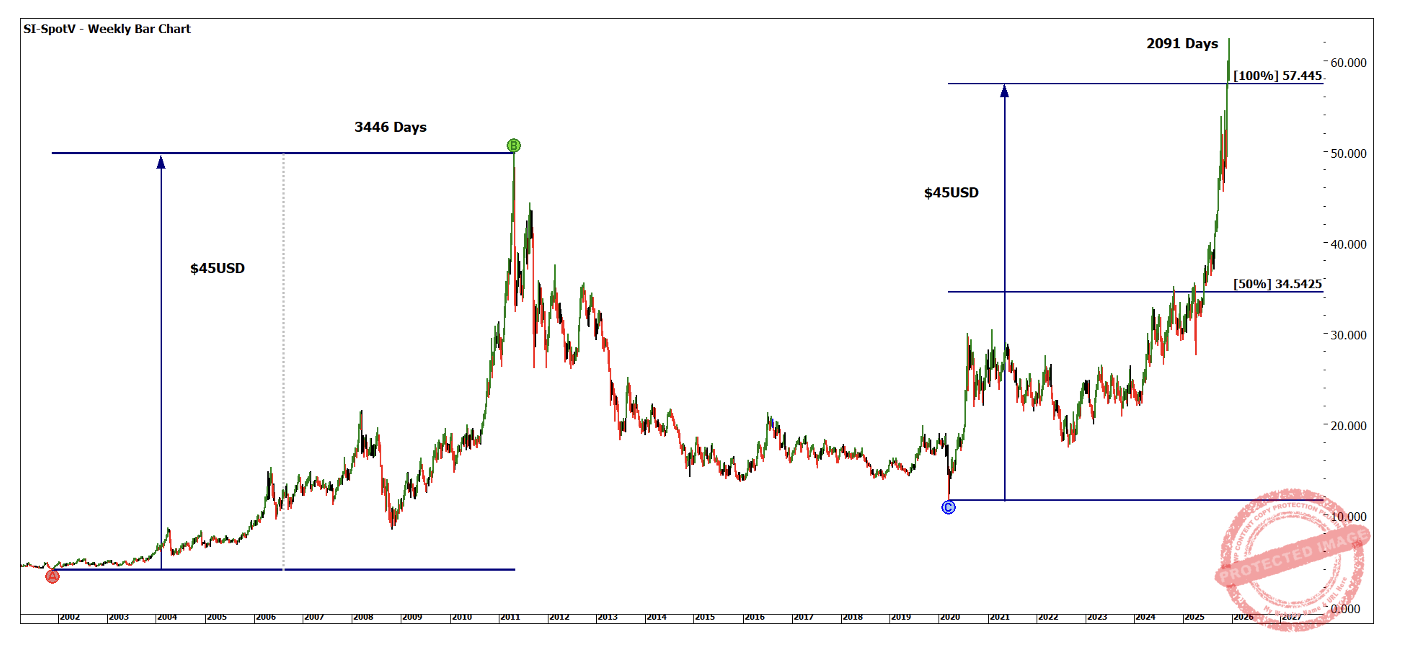
Chart 2 – Weekly Bar Chart SI-Spotv
In keeping with our price work we can further breakdown the current range.
Charts 3 and 4 look at the First Range Out as well as the Lows Resistance Card for the cycle low of $11.64.
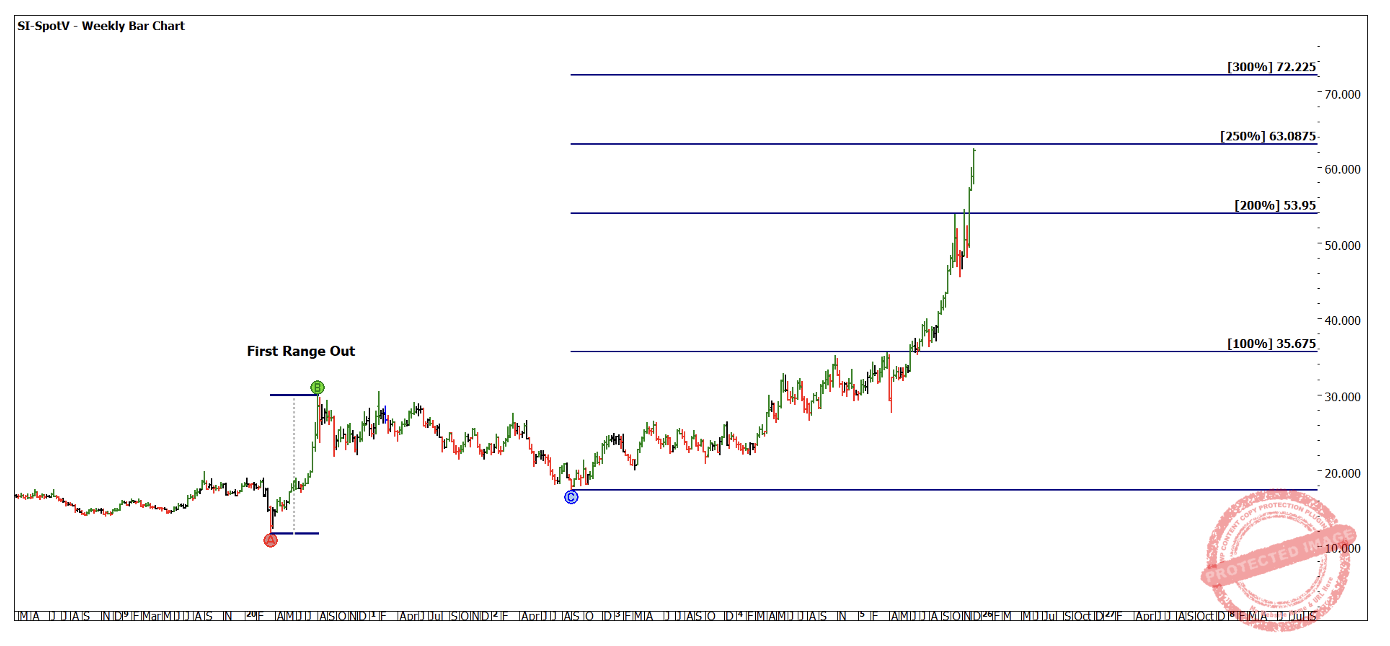
Chart 3 – Weekly Bar Chart SI-Spotv
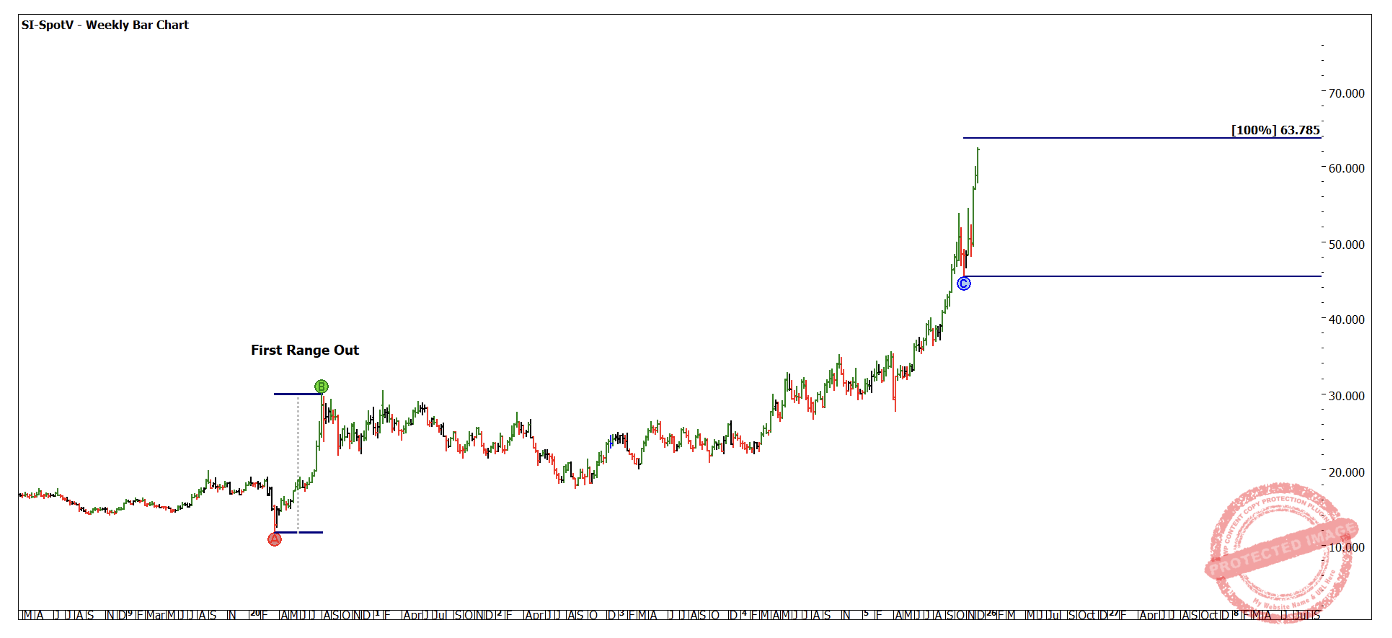
Chart 4 – Weekly Bar Chart SI-Spotv
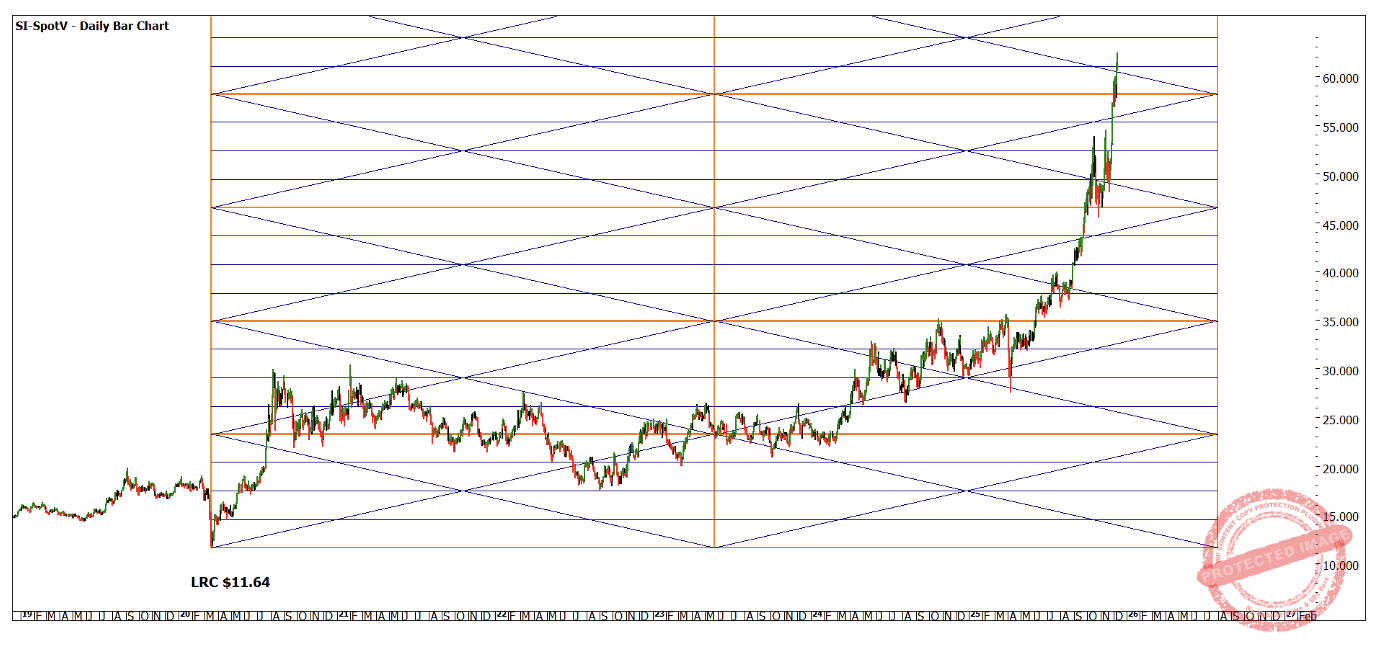
Chart 5 – Weekly Bar Chart SI-Spotv
Whilst there is no real clear cluster in terms of price that we could argue will hold the market, it allows for us to start watching and researching the current range in relation to history. One key take away is whilst Gold has moved multiples of previous ranges, the current move in Silver has been seen before in terms of price, but as already mentioned, has occurred in a shorter time suggesting there could still be some distance to run.
Chart 6 is some standard time frame measurement with bottoms to bottoms and tops to tops. We know we can measure also for the bottom to tops moves and vice versa. Even pulling these time frames apart starts to give us rough areas to work with.
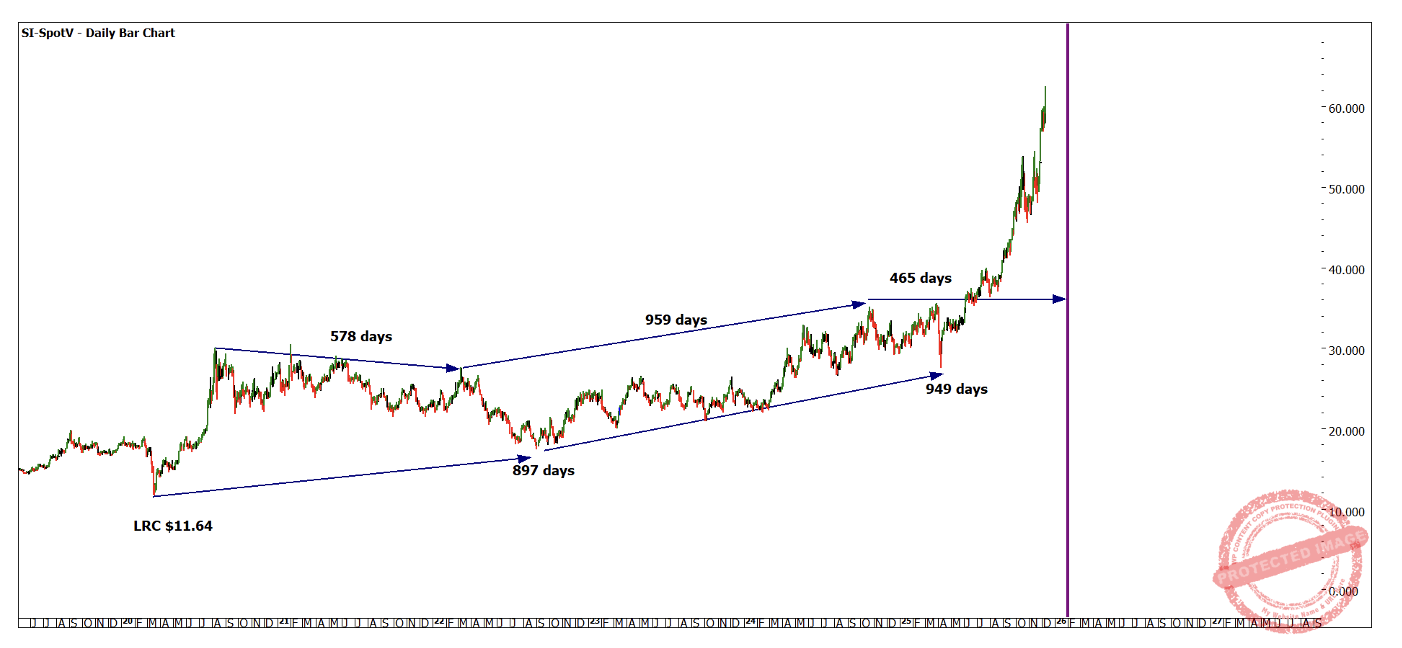
Chart 6 – Daily Bar Chart SI-Spotv
I have extended 50% of the 959-calendar day range forward and this provides a late January 2026 footprint to research.
Your homework will be to see if you can identify the 540-degree harmony operating during this time period and how we can potentially use that with the 31st of January.
The final chart is a small-time trend chart with smaller time counts between weekly swing tops and bottoms. There is some nice repetition and balance during these runs and again we can overlay on the large picture our Wheels Within Wheels.
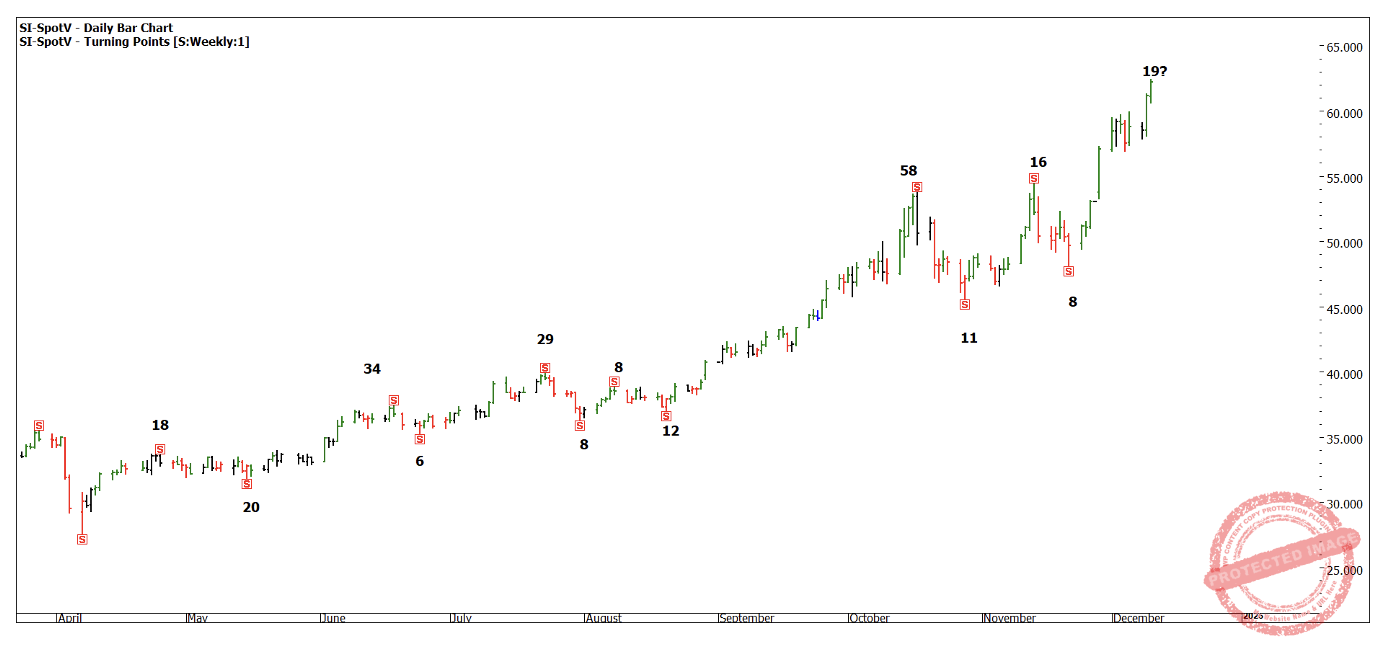
Chart 7 – Daily Bar Chart SI-Spotv
Good Trading and Happy Christmas.
Aaron Lynch