Simplicity Over Complexity
Technical analysis tools remain ‘just a tool’ until you’ve applied thorough testing on a market, by which stage they really start to feel like one of your own tools. Often what once seemed complicated can be added to your trading with absolute simplicity.
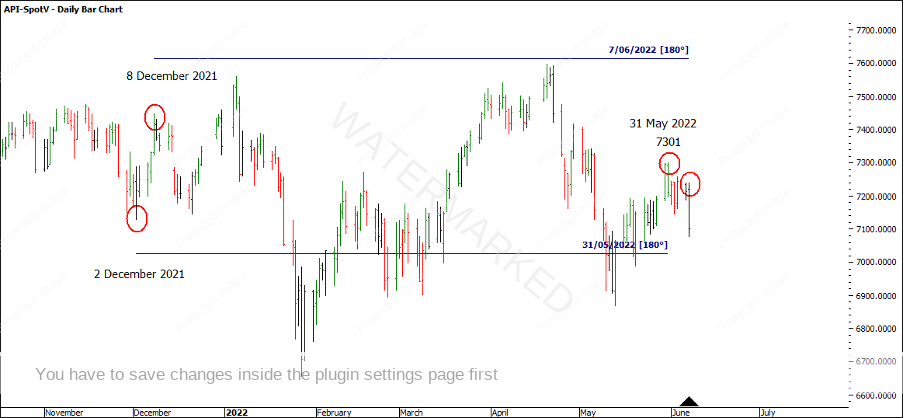
For example, having the 90 and 180 degree dates marked up from previous turns on a daily bar chart so you can see these dates are approaching is absolute simplicity, but is so incredibly powerful, especially when combined with the four other elements of a Classic Gann Setup!
This happened recently on the SPI200 when the five elements came together to provide a very tradeable weekly swing top. A recap of the price cluster (I wrote about this in the June Safety in the Market Newsletter) shows it was a three-part cluster between 7290 and 7312 with one part of the cluster being an Advanced Ranges Resistance Card (a technique which is one of Mat’s own discoveries and is taught in ATPOT). This type of Resistance Card called the top to within 4 points.
The price pressure leading into the 31 May top was identifiable at least a week or so prior. Time by Degrees had this date identifiable 6 months prior. When price and time came together at the right ‘Position of the Market’ it was easy to drop down to a 4-hour intraday swing chart to look for an entry.
Chart 1 – Time by Degrees
An interesting passage from 45 Years in Wall Street also applies to the run into the 31 May 2022 top. Gann says:
Rule 4. Buy and Sell on 3 Weeks Advance or Decline
Buy on a 3 weeks reaction or decline in a Bull Market when the main trend is up, as this is the average reaction in a strong Bull Market. In a Bear Market sell on a rally of around 3 weeks after you know the trend is down.
P8 – 45 Years in Wall Street
This period of the market came together nicely and provided traders with multiple opportunities to enter with double digit Reward to Risk Ratio returns, but also makes a great case study if you want to re-create the cluster and the swing charts to see how you might have been able to trade it. Drawing up a 4-hour swing chart for the last daily swing up will give you maximum benefit. Just make sure you use the September contract for the data source.
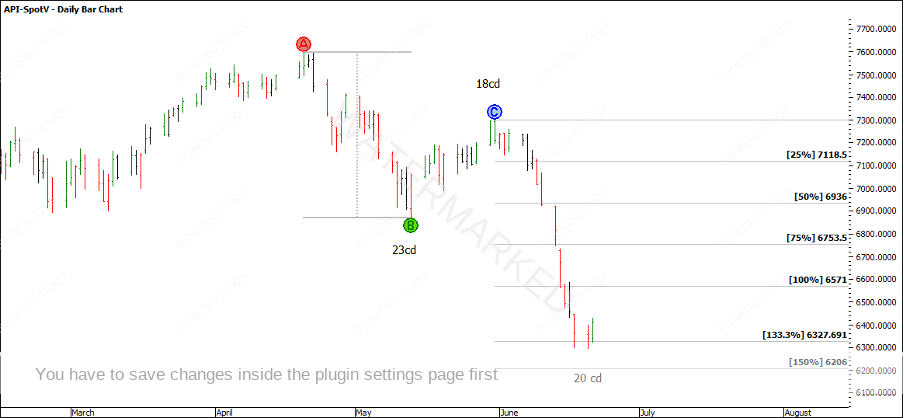
On Tuesday 21 June, after the close of the day, the SPI200 presents an expanding second weekly swing down, currently finding support at the 133% milestone and unable to close below 6327 for 3 days in a row.
Chart 2 – Expanding Weekly Swing Range
As we’ve seen a strong weekly run down with a maximum one day reversal, it might be timely to remember the following:
“It’s important we remember that form reading is the key subject in this lesson – this means learning to take our signals from the market and what to watch. If a market has been running up making only one- or two-day reversals and then you see it pull back 3 or 4 days or more, you might have your first proof that the trend is in fact changing”.
P28 Ultimate Gann Course
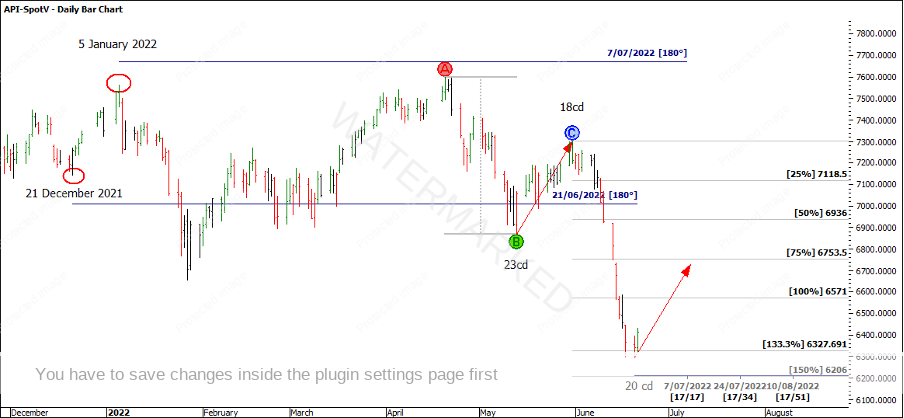
For the current market scenario, a second day up would suggest time is overbalancing. If we follow the 180 degree pattern, 21 June is also within one day of a perfect hit and is one of your seasonal dates we should be watching.
Chart 3 – SPI200 Current Market Position
The daily swing chart is now starting to overbalance, so with time and price overbalancing, I think the SPI200 is in a position where either we see the weekly swing turn up or perhaps this is just an early warning the trend may change, and we see a last swing down.
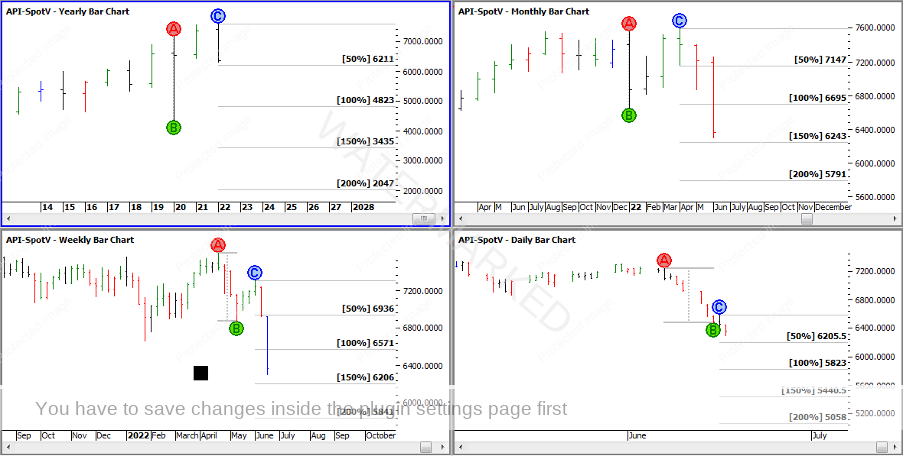
Looking at the major swing charts, you may be able to identify the next cluster approaching if the SPI continues its trend down. (For the below example I’ve used the bar charts for accuracy so all the outside bar swing tops are included).
Chart 4 – Major Swing Range Milestones
In Chart 3 above I’ve applied the weekly speed angle, Time by Degrees and a repeating time count to the current low which gives us a time of around 7 July as a date to be watching. If the market turns back down, we also have our major price milestones to watch out for.
Either way around 7 July is the next Time by Degrees date we should be watching using our simple approach. We also have elements of Time, Price, Position, Pattern and Volatility forming in both directions. So now it’s a case of waiting for a setup to come together.
I love the clarity that hand charts provide so if you don’t have one market done by hand, I highly recommend it.
Happy trading,
Gus Hingeley


