Softies
Spring is in the air and it’s a time for new beginnings. Listen to the radio and Spring started at the start of the month, ask any farmer and it starts around our Equinox on September 23rd.
Those of you who are at Ultimate Gann Course level would have been watching the farmers’ date with interest. A time to reap and a time to sow! So I thought it would be a good time of year to start ‘sowing’, by starting a project on Soft Commodities and whether we could or should trade them.
The Crop:
- Cocoa
- Coffee
- Corn
- Cotton
- Soybeans
- Sugar
- Wheat
There are many others, but their volumes could be too low at times for us to trade and seven markets is more than enough for us to explore. For some further insight into trading these markets, Andrew has covered all of our ‘crop’ and more in the newsletters over the last few years, which you can find in your Member Portal on the Safety in the Market website. I have been re-reading his article’s this week to widen my knowledge in this field and I advise you to do the same.
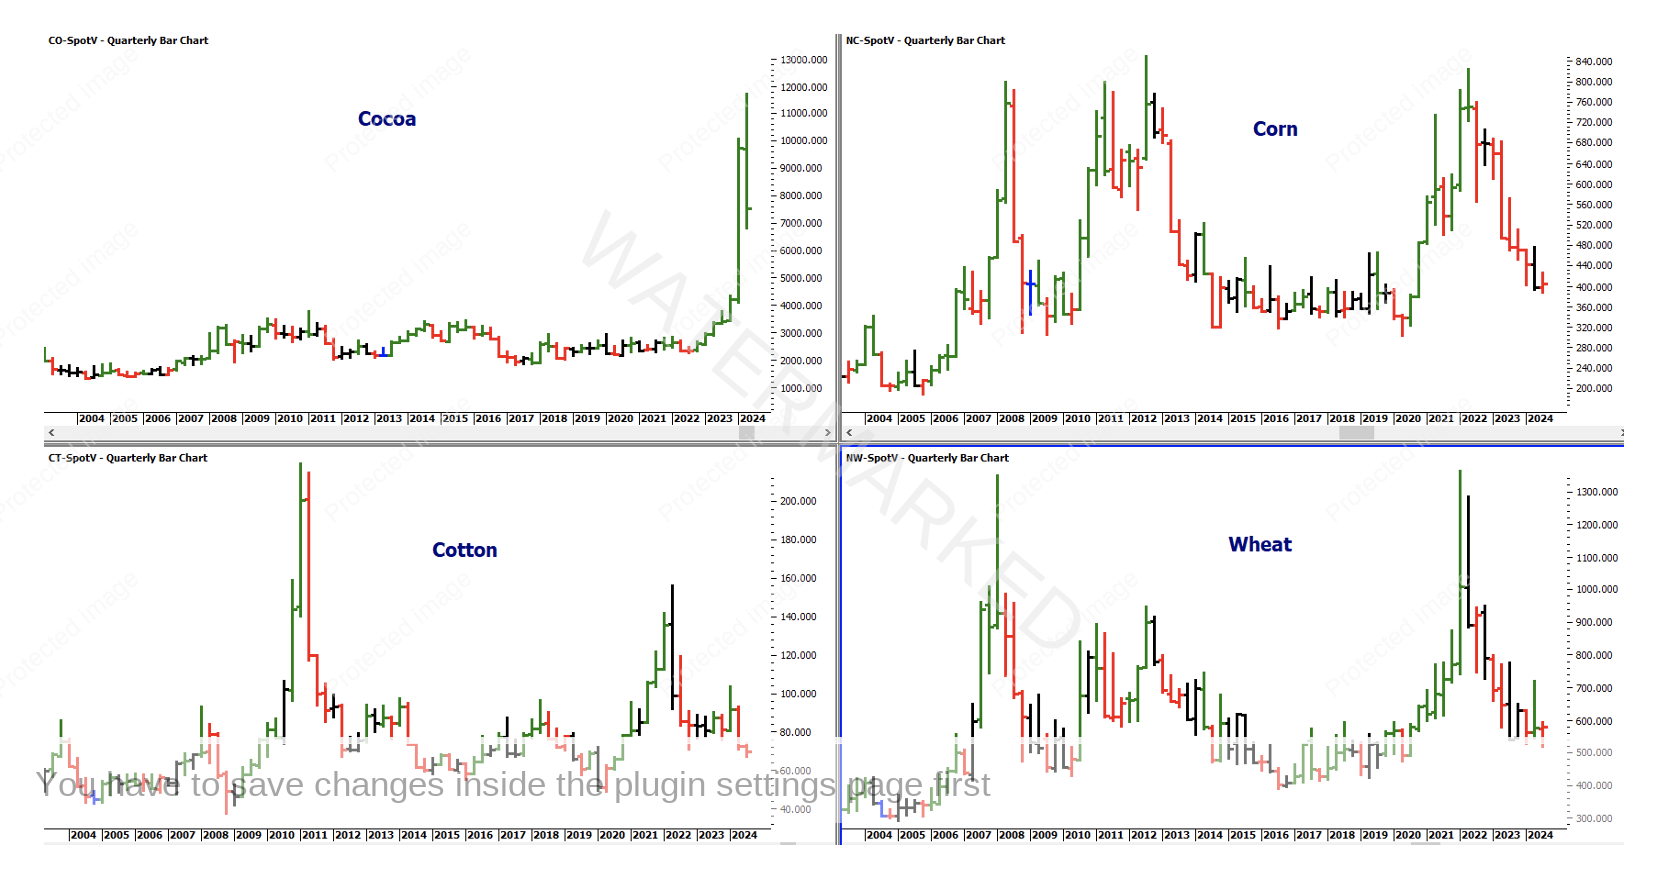
Firstly, we need to look at some charts. We can find the chart symbols for each contract we want to trade in ProfitSource by clicking ‘new chart’ and then ‘search’ in the dropbox to find the following results.
Sleeping Giants
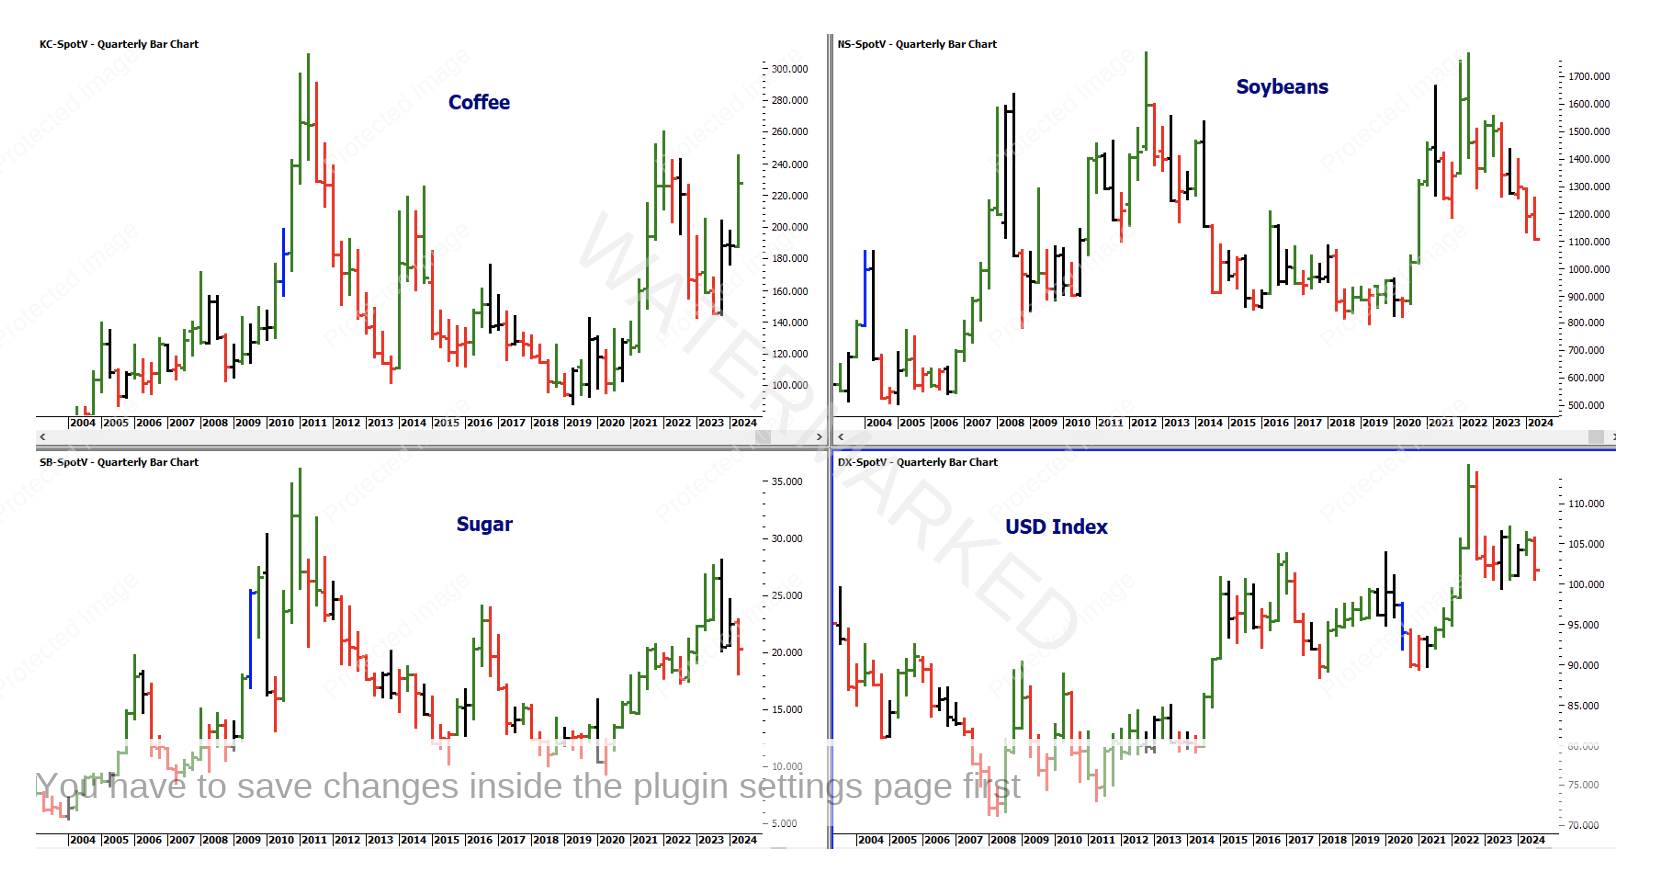
Movers & Shakers
In the charts above we have Coffee, Soybeans & Sugar. I have added in the USD Index because all these commodities trade in the US Dollar, so it’s movement must be relevant. (and I had a spare box!) Joking aside, I had assumed that the USD would move in the opposite direct to all of our markets, but as you can see that’s not necessarily the case.
Either way, we can see that these three soft’s (other than making up your ‘morning fix’), are happier to move around more often than the previous four and hopefully can provide us with day to day, week to week, trading opportunities….
My initial thoughts going forwards is to track our ‘Sleeping Giants’ from afar, in preparation for the next big move upwards, while in the meantime, trading one or more of the ‘Movers & Shakers’.
Either way we have to find out more about the Futures contract specs of these markets. I have used www.cmegroup.com and have filled out a chart on Sugar as an example:
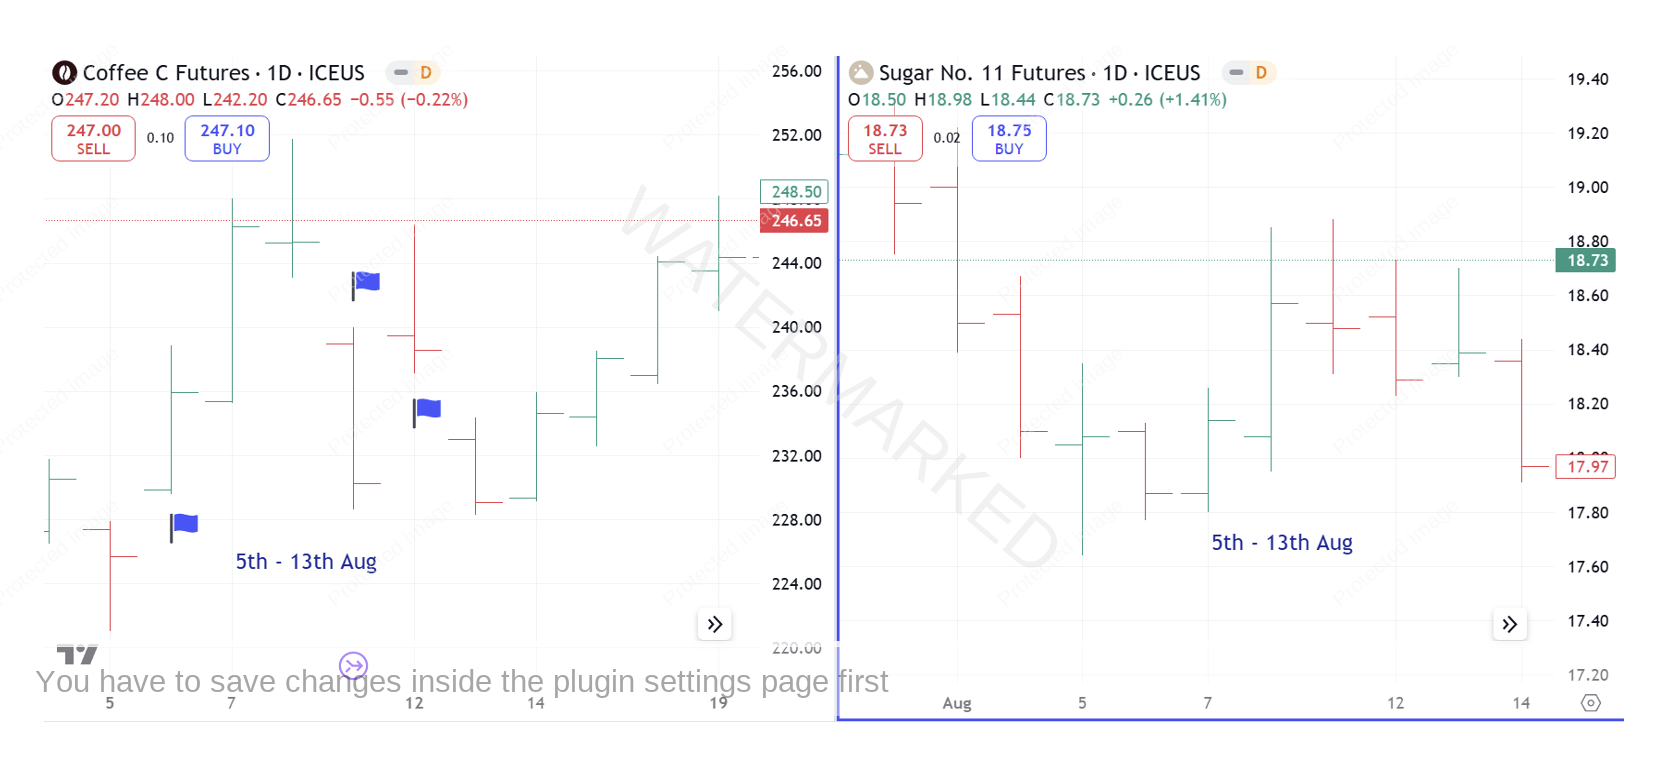
Coffee looked like the best market to trade, and it may well turn out that way, but it does seem to have a few gaps, which I believe is mainly due to the operating hours of the Futures Contract. Like Sugar, Coffee doesn’t open until late afternoon AEST, which would mean it is vulnerable to news events while closed. Fortunately Andrew was close at hand and shared his experience and counsel on Coffee Futures:
“In the first half of August, the December coffee contract gave a sign that things may be about to get interesting. There was an unusual amount of volatility over a short space of time. Within the first two weeks of August there had been two strong gaps up with either followed by a sharp sell off or a big gap down. History shows that gaps in the coffee market within a trading week are pretty rare. They’re usually loners! And it’s even rarer to have a number of them over such a short space of time. Could this be the sign of a big battle between the bulls and the bears? Could this be a sign of a breakout and some tradeable volatility to come?”
“Set up price forecasting for both the Coffee December Contract chart, and it’s SpotV chart, stalk any set ups and keep an eye on the swing charts.” Andrew Baraniak.
See where I have put the blue flags in on our (left) chart below. Sugar on the right-hand side has similar opening hours, but its gaps seem smaller.
Note: to obtain real time data on Coffee & Sugar you have to pay $115 US per month to the ICE Futures Exchange. This isn’t a deal breaker for me, because if Coffee moves 10c in my favour it will pay for the subscription, but it is good to know when making decisions on which market to trade. You may be able to see the orange ‘D’ next to the ICEUS symbol at the top of each chart in the example above. This implies that the data is delayed by 10 mins. Soybeans on the other hand is traded with CBOT which is covered along with CME, COMEX & NYMEX at $7 per month for subscription which means I can get live data.
So Soybeans is the cheaper market to trade, and we will be tracking it moving forwards. Saying that, I have traded Soybeans in the past and have noticed that some of you are trading it currently. So for something different for all or at least most of us, I’m going to start with Sugar! After telling you how much Sugar is going to cost you to trade, I just wanted to show you a recent Sugar trade so we can see the numbers. See below:
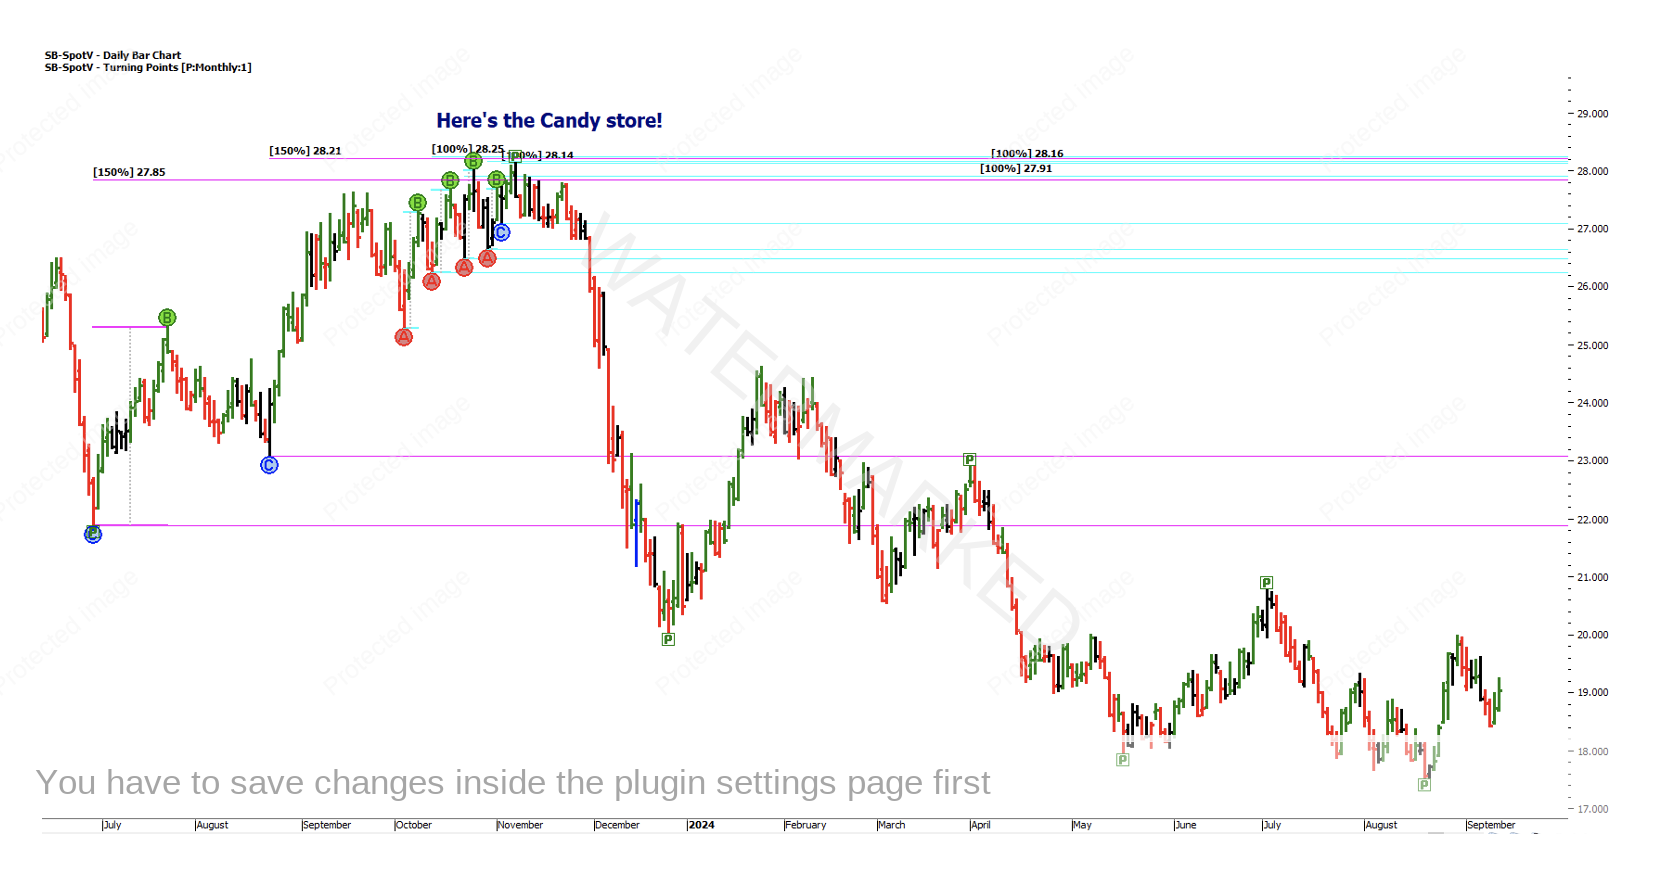
The chart above shows us the movements in Sugar over the last 12 months or so. As we can see, we have two big price targets for a top in pink and four small targets in aqua blue.
I’m guessing few of us were watching that Sugar cluster come in, but I’m hoping that all or most of you can put that cluster together on this or any market you trade. So what happens next, how do we enter, and can I afford to trade Sugar?
Just on that note, most brokers will provide you with the opportunity to trade these commodities using CFD’s which will allow you to take a smaller position which may help with any anxiety you may have as you start your Soft’s journey. Just be sure to check the numbers, as my broker’s Sugar CFD price for example, is very different to the futures price! Another avenue is to trade a ‘mini futures contract’ which will allow you to control a smaller position. This isn’t currently available on Sugar, but is an option with Soybeans, Wheat & Corn.
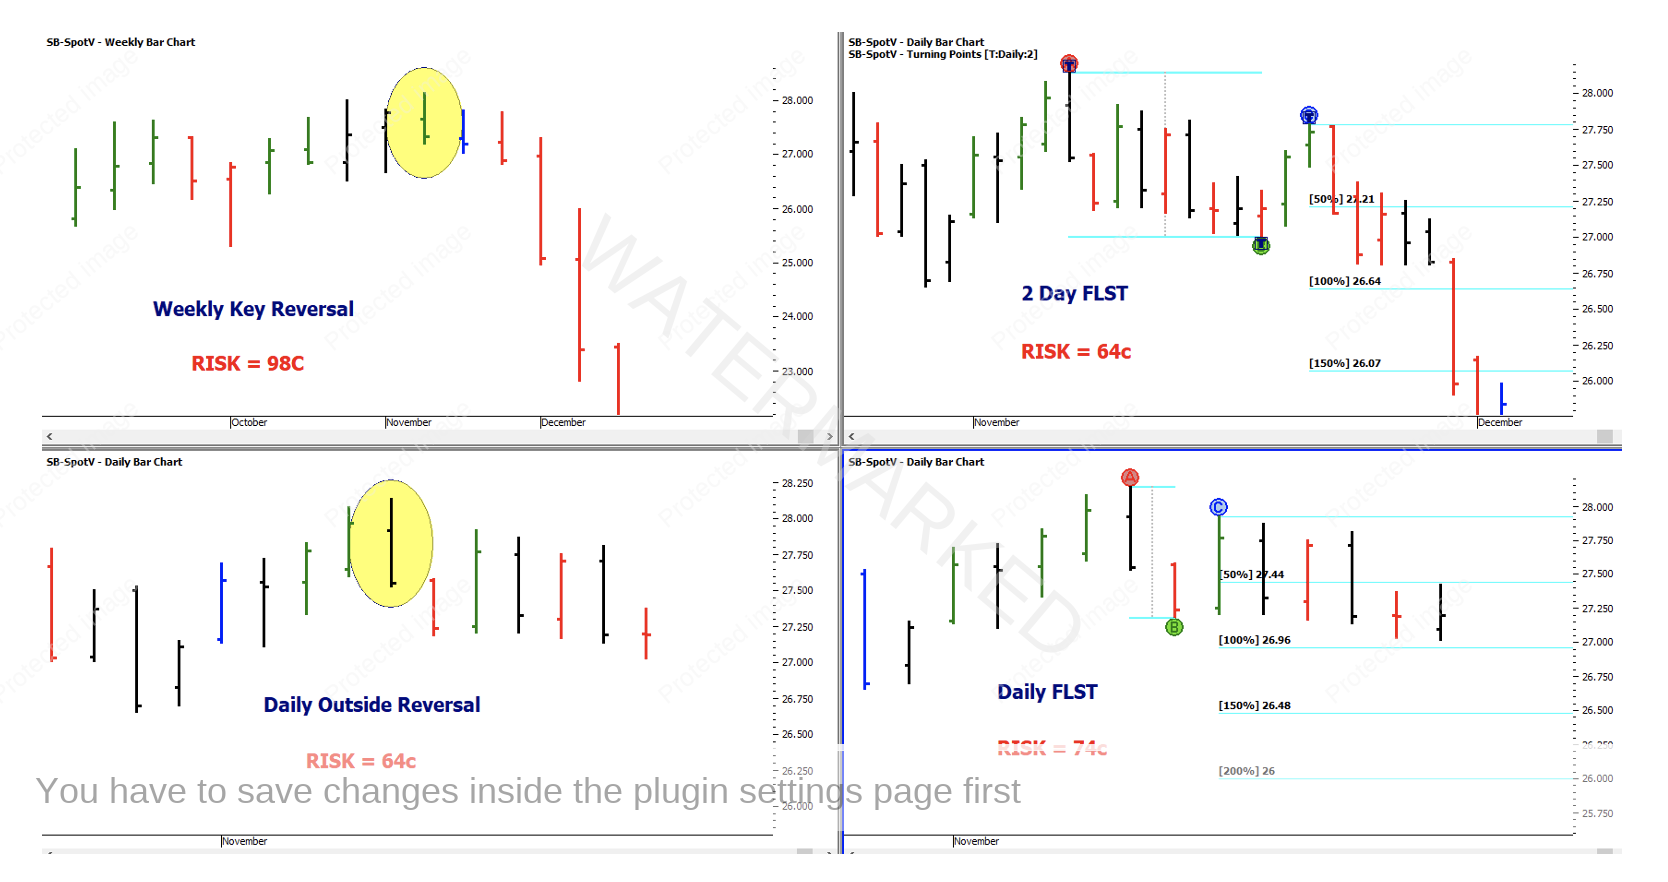
Ok, let’s trade. Below we have four methods of entering this price set up for a short trade:
Let’s use the worst-case scenario for risk which is the ‘weekly key reversal’ trade with a risk of 98c. From here the market ran down all year and I’m not sure it’s finished falling?
We are just going to look at the weekly range down from that top which finished on 26th December 2023. This range took 49 calendar days (33 trading days), with a low of 20.03, giving us a fall of 714c.
This gives us a Risk to Reward Ratio of about 7:1.
A good result for our first raid into the world of Sugar, but was there more candy to be taken?
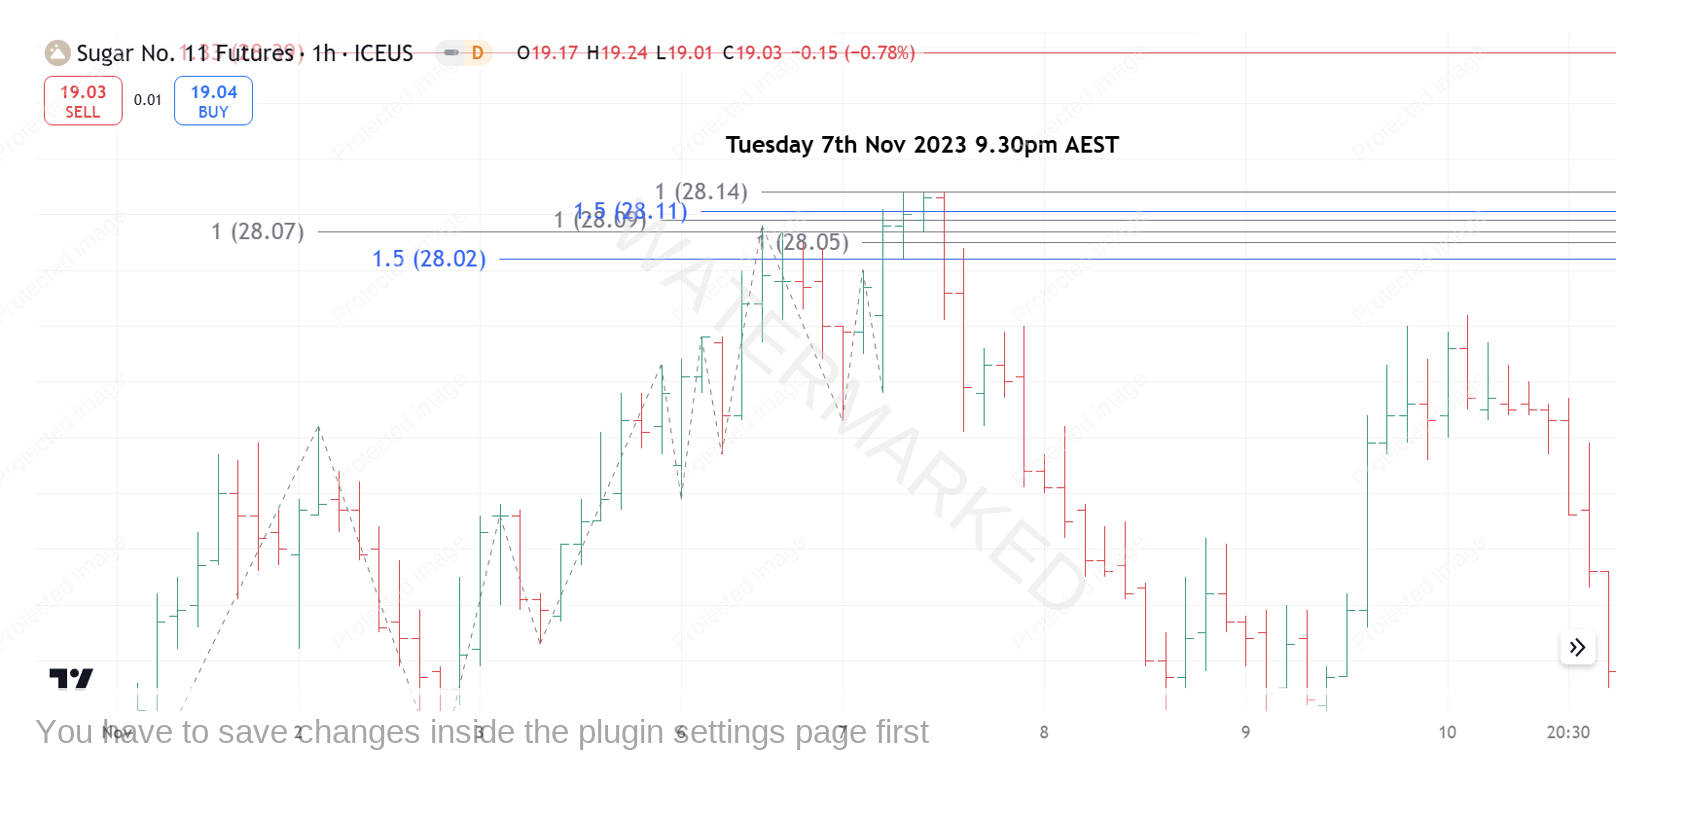
Here’s the 1-hour chart on the 7th November. Again we have a cluster which in itself would coat our belief in the top, with 6 price targets to watch. The market hit the top of our intraday price cluster at 28.14 three hours in a row and couldn’t go any higher!!!
When we broke the low of the middle bar in our 1-hour ‘triple top’ we had our first chance to enter. That bar was 7 cent long so came with a 9-point risk. If we missed that then the 1-hour first lower swing top gave us a chance with a 14 cent risk, but this trade would have been stopped out on Friday the 10th. So we’re stuck with the 9-point risk trade that then travelled 804 cents. Reward to Risk Ratio = 89:1.
9 Points Risk = 9 x $11.20 = $100.80 USD
804 Points Reward = 804 x $11.20 = $9,004.80 USD
Our Spring project:
- Keeping on top of Soybeans and watching for any trading opportunities.
- Learning to work with the gaps in Coffee.
- Keep ‘sowing’ a little further to see if this was just luck or does Sugar have more to offer us.
Careful, it’s addictive!
Darren Young

