Soybeans – Holding On
When in a trade for a longer move, one strategy we can engage is to trail stops behind the lows of the weekly swing chart. But, as will become apparent from this article, sometimes we need an alternative. Even the standard weekly swing chart can be a little choppy, still containing some of the unwanted noise that we’re not interested in if looking to stay in for the long haul.
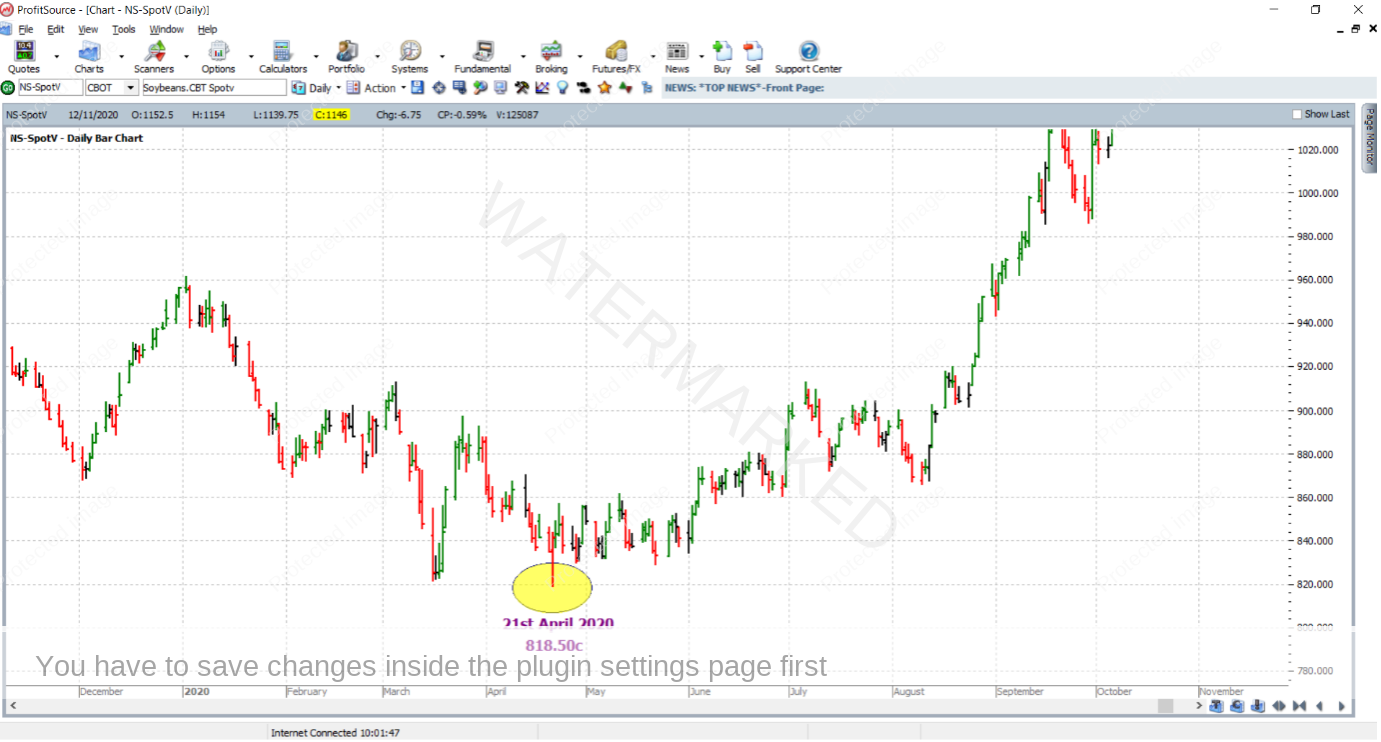
Take a market like Soybeans for example. After its major low of 818.50 cents per bushel on 21 April last year, the market ground away for a few months, only trending up slowly. It never really took off until mid-August. This can be typical of some of the commodities. They’ll put in a major turn at a price cluster, only to move away slowly in an accumulation or distribution phase before really taking off. See the ProfitSource chart below – symbol NS-SpotV.
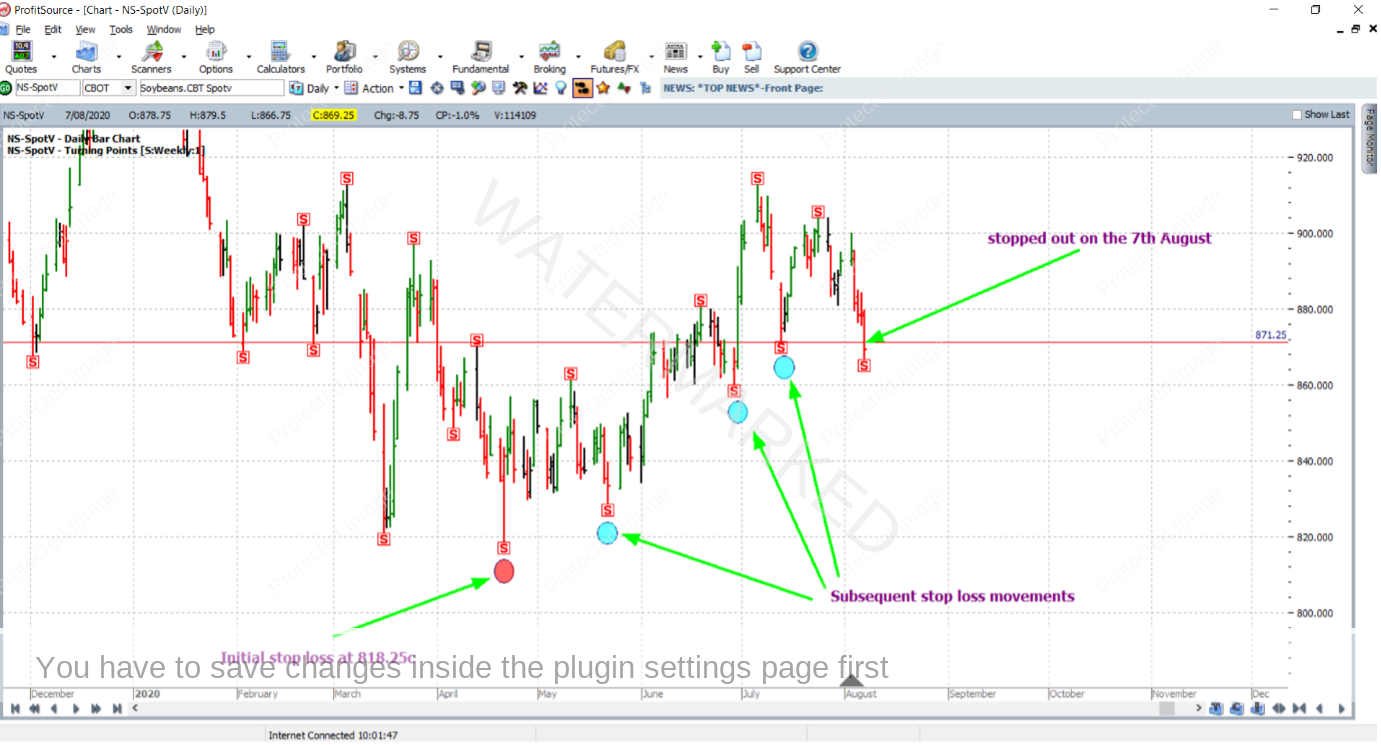
With some good price reasons behind the April 2020 low, if you had entered the market on 22 April 2020 as the swing chart turned up (at a price of 843.50c), you’d then of course have your trade management strategy ready to engage. But as you can see below, if that strategy were to trail stops behind weekly swing chart lows, you would have been stopped out relatively early in the move – on 7 August at 871.25c as the weekly swing low of 13 July was broken. This is shown below with the help of the Weekly Turning Points Hi-Lite and the ProfitSource chart in Walk Thru mode:
For sure, you’d be out of the market with a profit, but the reward to risk ratio would leave you with a lot to desire. If this was the case, how could the trade have been managed differently, and still have you with a position in the fantastic bull market, which at the time of writing a year later, is still underway?
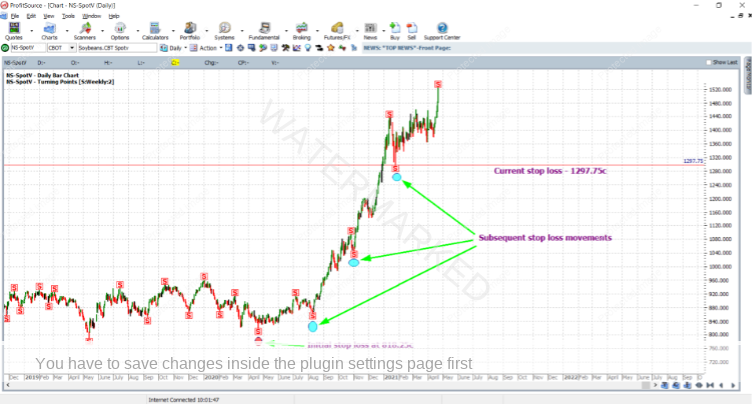
The answer is to use the 2-weekly swing chart. Just like the 2-day and 3-day swing charts remove the “unwanted noise” of the daily swing chart, a 2-weekly swing chart can smooth out the run. So with the same entry parameters as above, let’s see how the move would have panned out had you managed stops in this way. Note in the chart below that the Weekly Turning Points Hi-lite has had its “Periods” property incremented from 1 to 2.
Managing the trade in this way would have you still in the market with unrealised profits. You’d be in a great position though, so let’s do some reward calculations in the usual way, based on the assumption that in the near future you get stopped out at 1297.75c – the position of the current exit stop.
Reward to Risk Ratio:
Initial Risk: 843.50 – 818.25 = 25.25c = 101 points (one point for each quarter of a cent)
Current theoretical reward: 1297.75 – 843.50 = 454.25c = 1817 points
So the reward to risk ratio is 1817/101 = approximately 18 to 1
In terms of a percentage gain to the trading account size, assuming the standard 5% risk across the size of the daily bar of 21 April 2020, the gain on the account would be:
18 x 5% = approximately 90%
And according to the specifications for Soybean futures on the CME Group exchange website, each point of price movement for a contract in this market is worth $12.50USD. So the risk and reward in absolute dollar terms (USD) would be:
Risk = $12.50 x 101 = $1,262.50
Reward = $12.50 x 1817 = $22,712.50
Based on the AUD-USD exchange rate at the time of writing, the reward in AUD for trading one Soybean futures contract would be approximately $29,470. The same move could also be traded with a much smaller position size via a CFD whereby of course the reward to risk ratio and the percentage gain in account size would still be the same.
Work Hard, work smart
Andrew Baraniak


