Soybeans – Roadblock
This month’s article will take the usual approach, considering reasons to enter the market, looking for an entry signal, trading a reference range, and analysing the rewards. This time however, we’ll also closely consider the reason why one milestone was chosen over another for the purpose of an exit target.
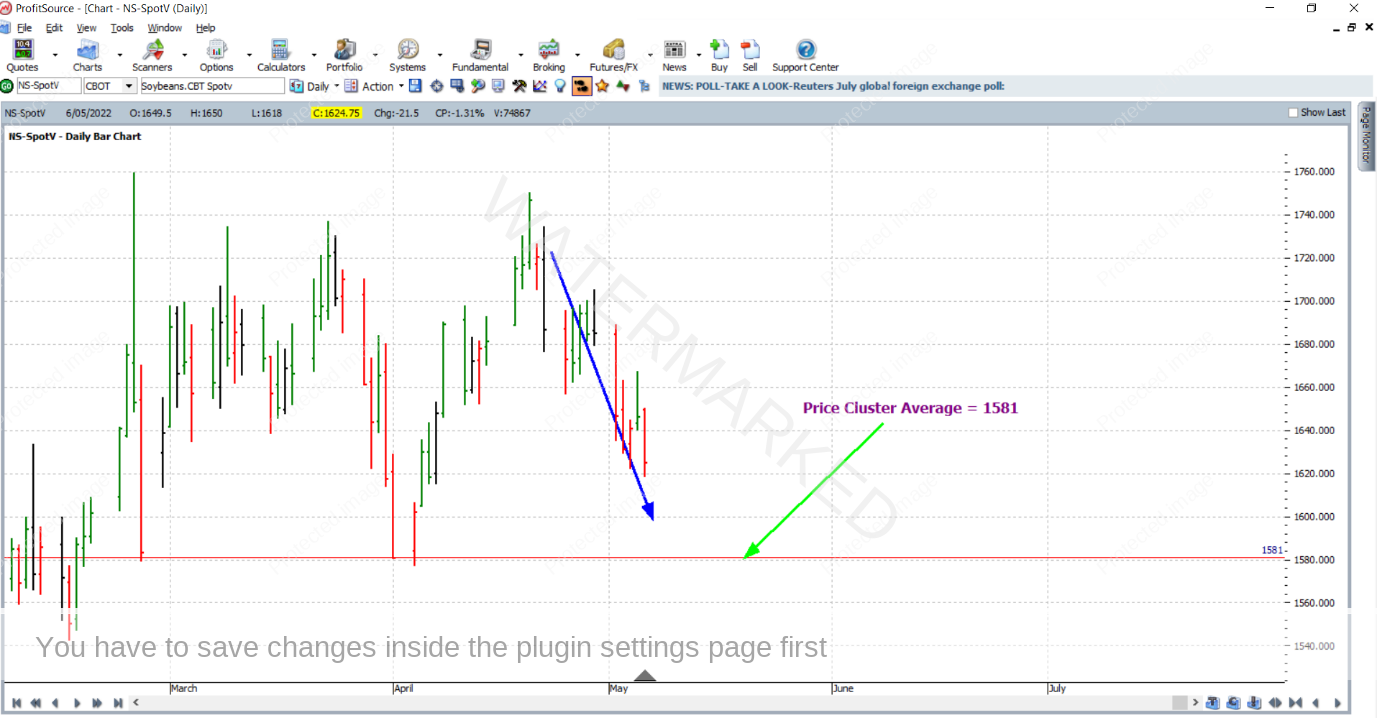
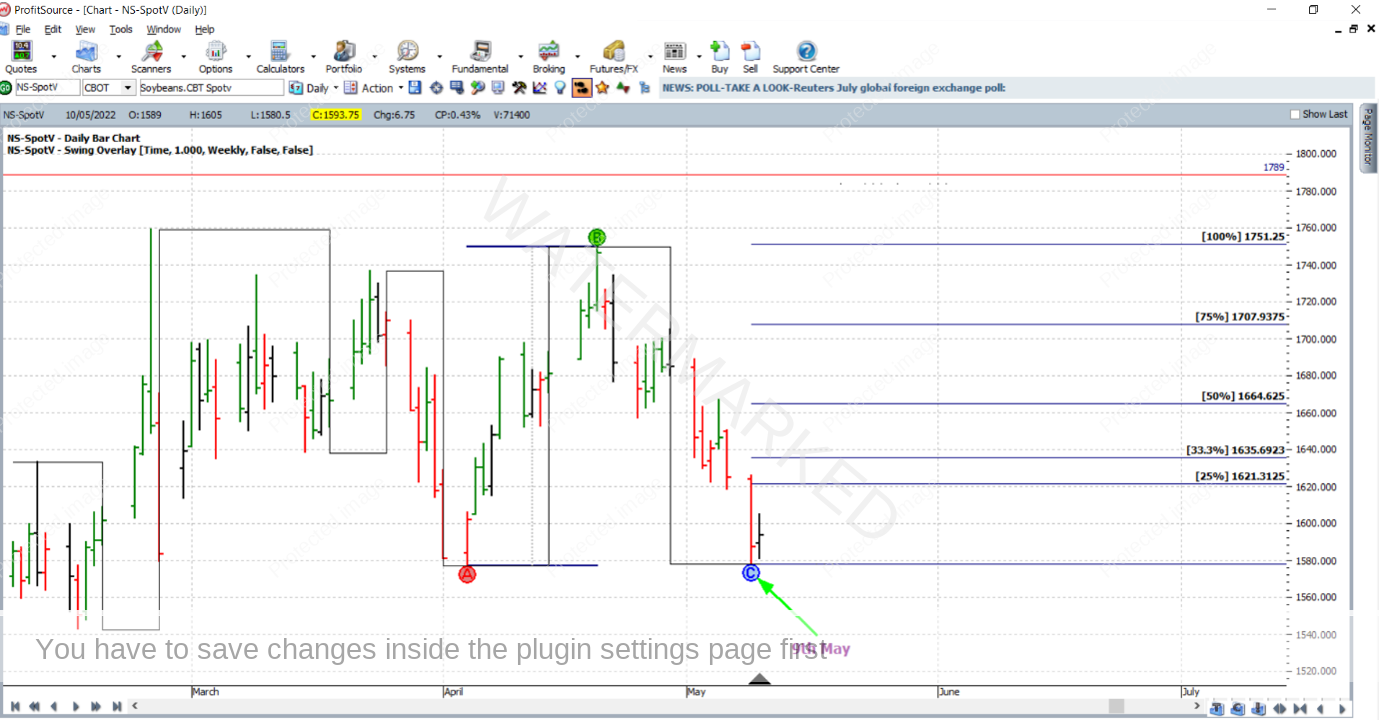
The trade in question was a long trade out of the 9 May 2022 low in the Soybeans futures market. As the day of the low approached, the market was heading down towards a price cluster (of three individual price analysis reasons) which averaged out at 1581 cents per bushel. See the ProfitSource chart below in Walk Thru mode, symbol NS-SpotV.
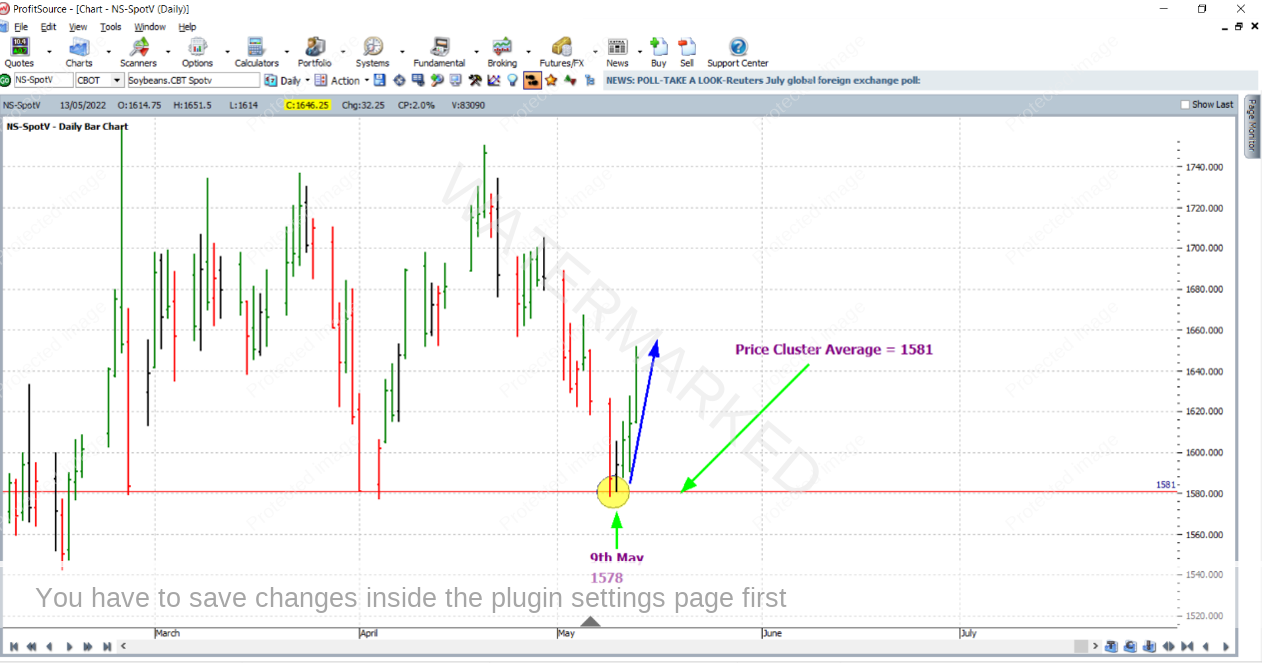
The reversal came and the market made a low of 1578, only breaking the average of the cluster by 3 cents (which is in fact 12 points, each point being 0.25 cents), only a small amount in relation to the size of an average daily bar in this market.
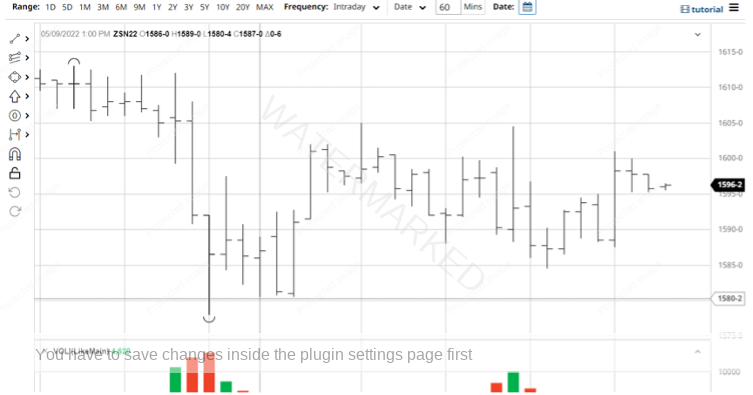
If confident enough in the strength of the analysis, we may consider entering very close to the anticipated low by taking an entry signal from the intraday chart. Below is a screenshot from barchart.com, showing the hourly bar chart of the July 2022 Soybean futures contract. A first higher swing bottom entry signal presented itself early afternoon Chicago time on 9 May 2022. It would have had you in a long position in Beans at 1589.25 with an initial stop loss at 1580.
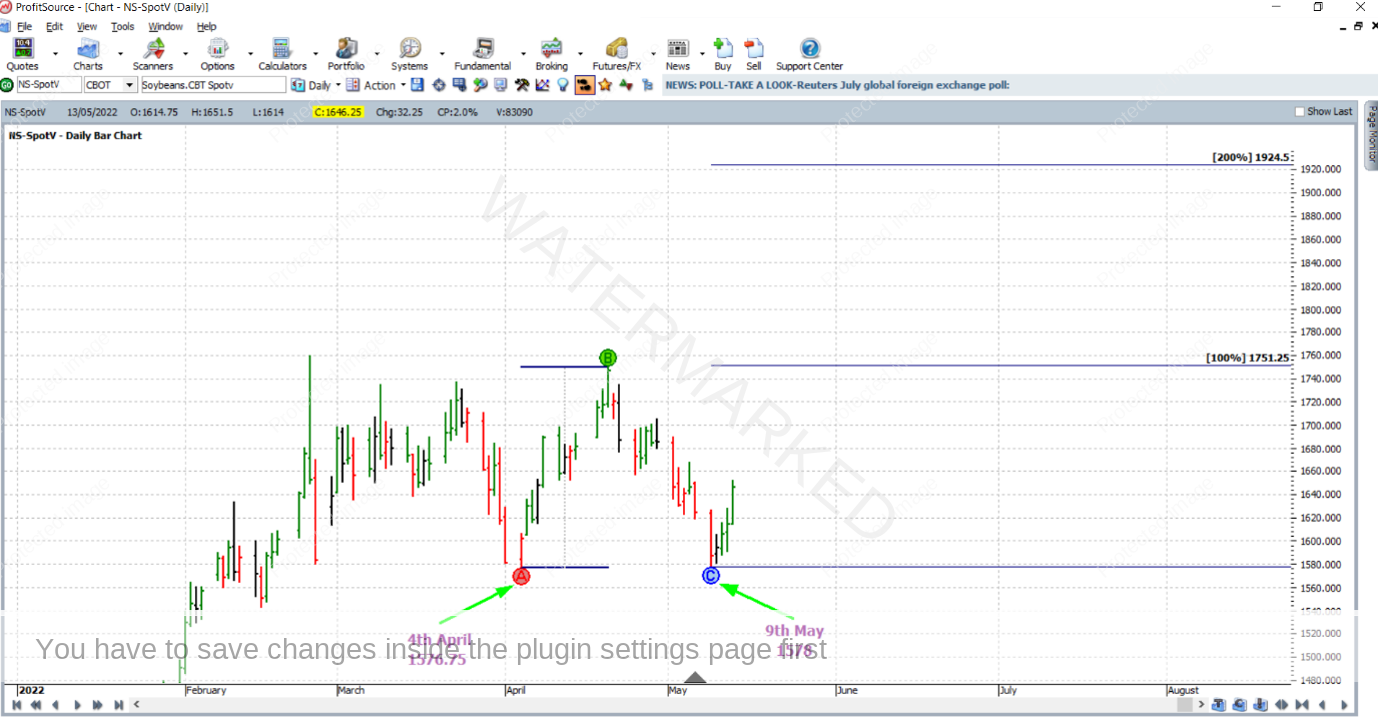
And what about choosing a reference range for the trade? In regards to this, you may have already noticed something – one of the three price reasons – that of the double bottom formation that 9 May 2022 made with 4 April 2022. And since this is a double bottom trade, it would have us aiming for the 200% milestone as an exit target, right?
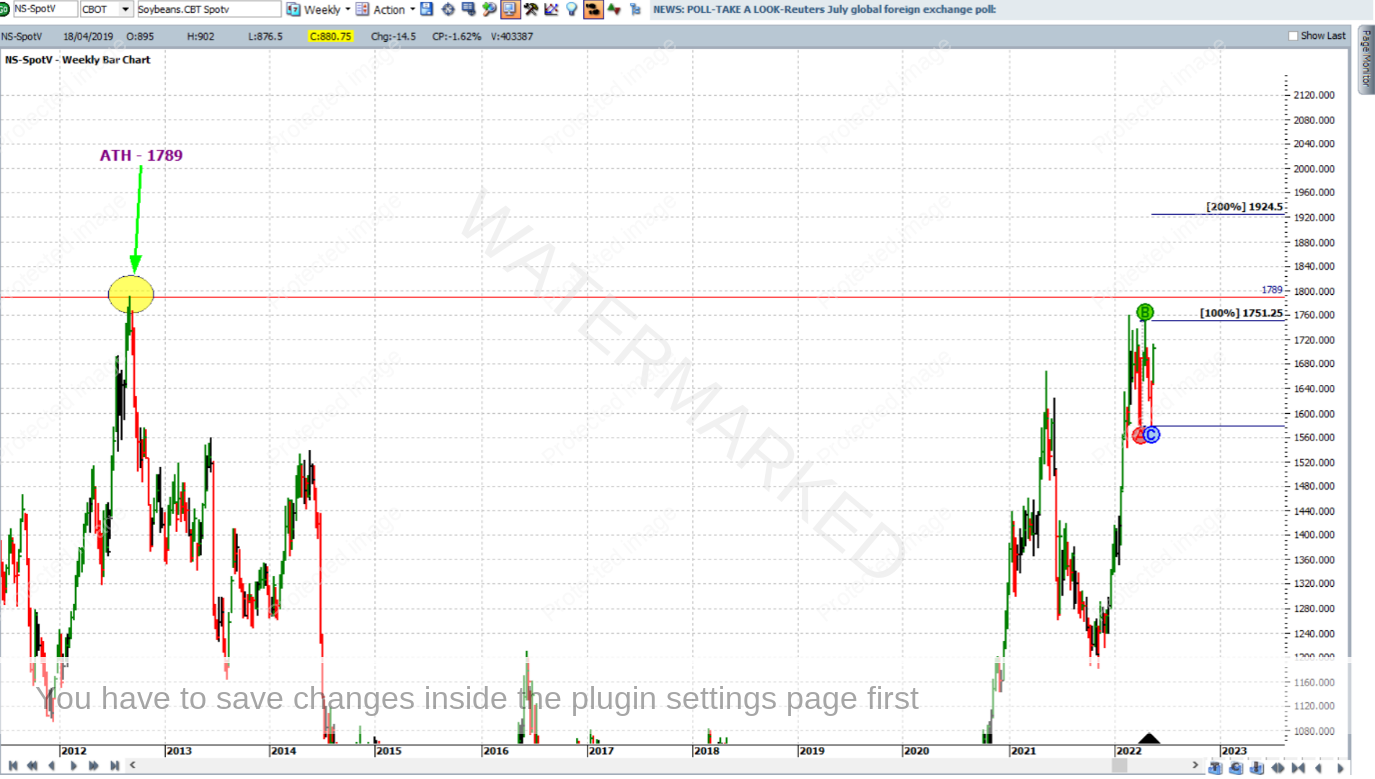
That’s completely fair enough. But, if you’ve kept an eye on the bigger picture analysis of this market, there was a slight problem if aiming for the 200% milestone. Zooming out (and using the weekly bar chart) you will see below that the All-Time High (ATH) from the year 2012 at 1789 cents was in the road of the 200% milestone of our current trade. In other words, a very large double top was potentially looming – not good if looking to stay long!
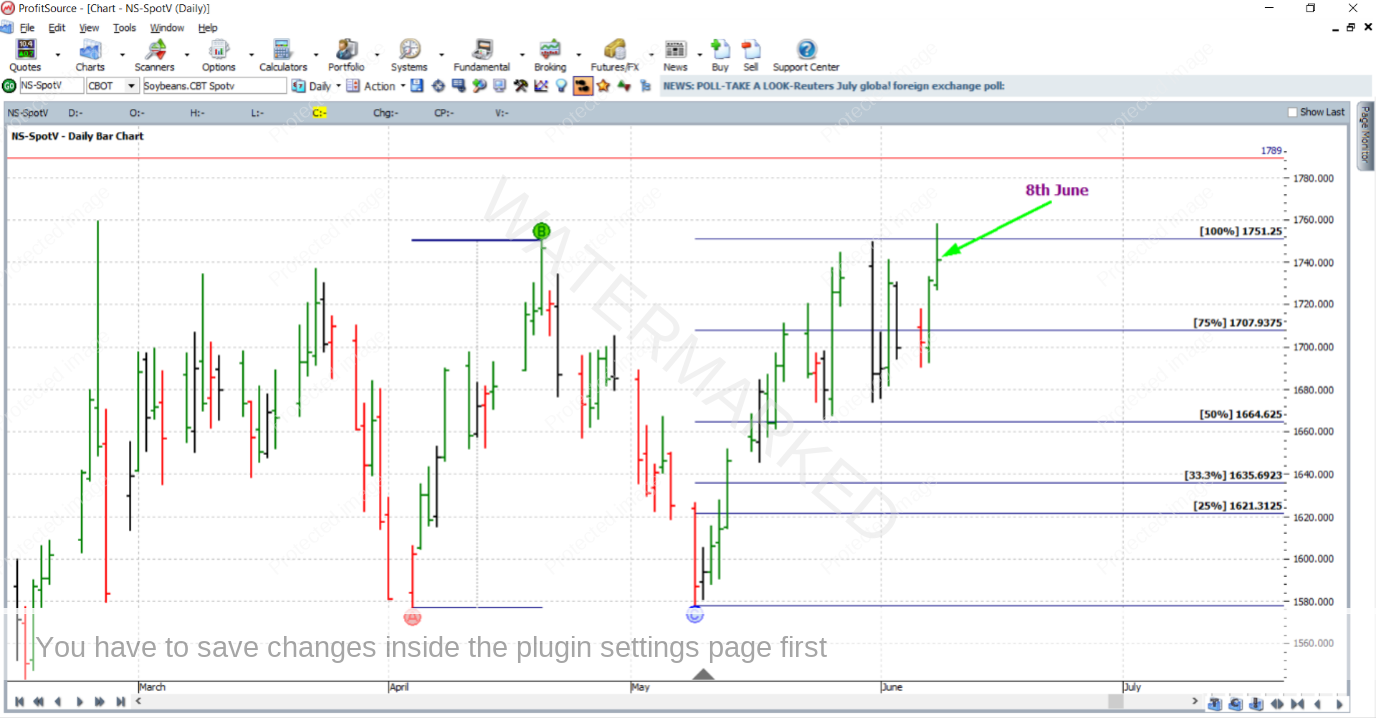
So to account for this, let’s aim for the 100% milestone instead (at 1751.25), managing stops currency style. Since the time frame (or chart resolution) of the reference range (weekly) is large enough in relation to the time frame (or chart resolution) of the entry signal (intraday i.e. hourly), a high enough Reward to Risk Ratio can still be obtained.
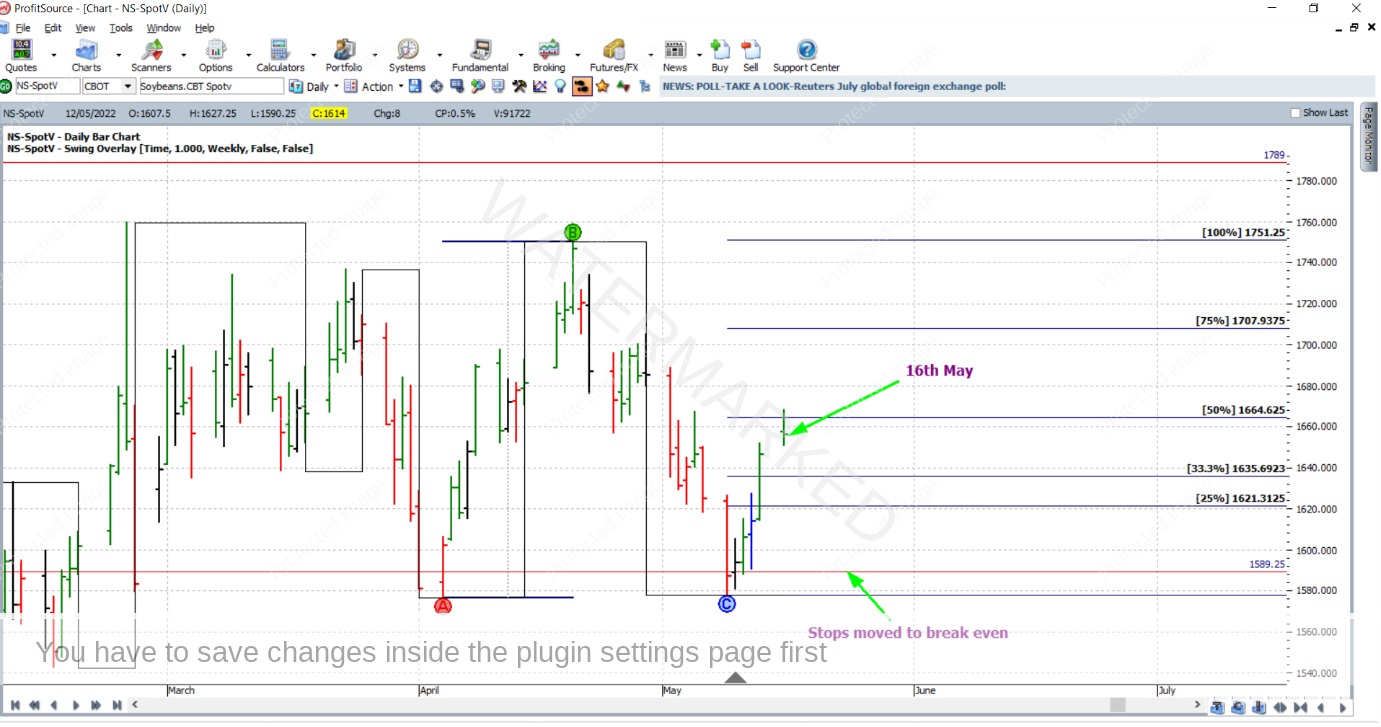
On 16 May 2022, the 50% milestone was reached with stops moved to break even.
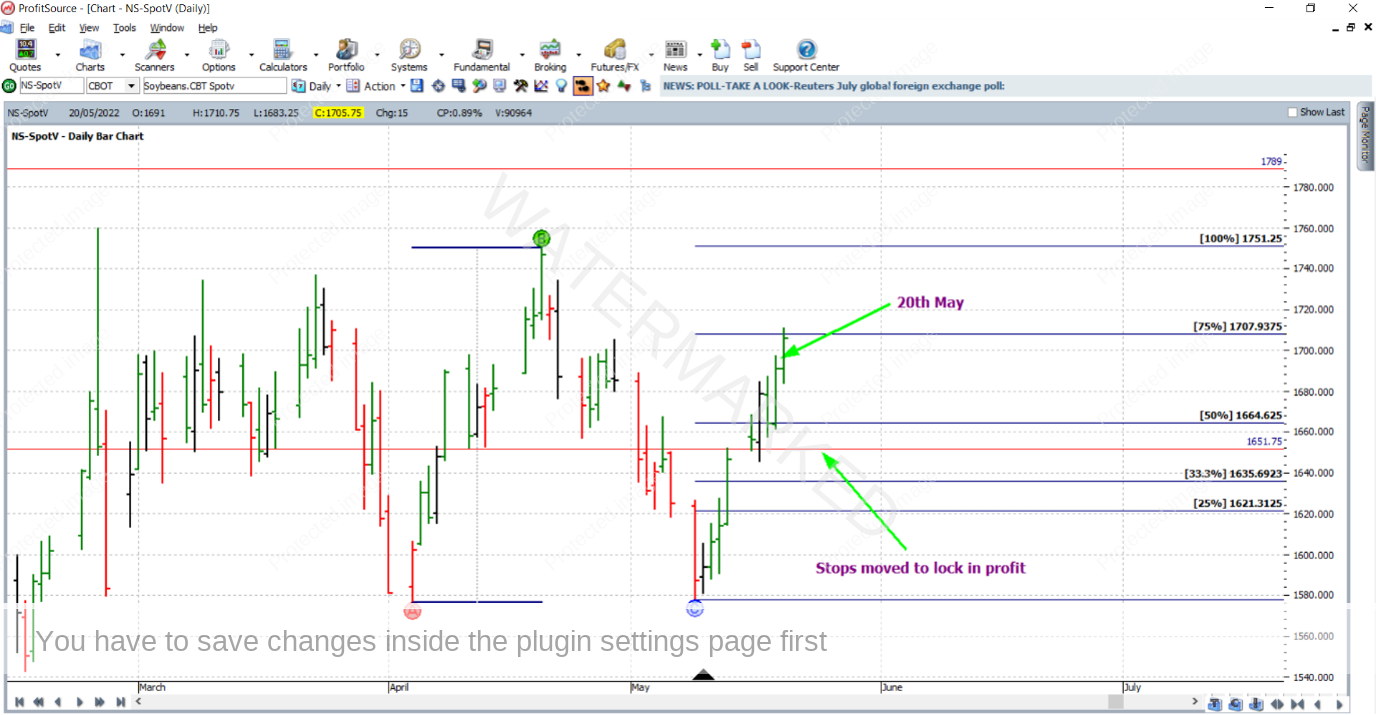
On 20 May 2022 the 75% milestone was reached and stops were moved to one third of the average daily range below the 50% milestone (approximately 12.75c at the time according to the last 60 trading bars), with stops moved to 1664.50 – 12.75 = 1651.75.
On 8 June 2022 the 100% milestone was reached and profits were taken at 1751.25.
And when breaking down the rewards, you’ll see that they were still pretty good despite exiting at 100% rather than 200%:
Initial Risk: 1589.25 – 1580.00 = 9.25 = 37 points (point size is 0.25)
Reward: 1751.25 – 1589.25 = 162.00 = 648 points
Reward to Risk Ratio = 648/37 = approximately 17.5 to 1
On the CME group website, the contract specifications for Soybean futures say that each point of price movement changes the value of one futures contract by $12.50 USD, so in absolute USD terms the risk and reward were:
Risk = $12.50 x 37 = $462.50
Reward = $12.50 x 648 = $8,100
At the time of taking profits, the reward in Australian dollars was approximately equal to $11,250.
If 3% of the account size was risked at entry the percentage change to the account would be as follows:
17.5 x 3% = 52.5%
If you’ve not done so already open up the chart for Soybeans (NS-SpotV in ProfitSource) and have a look at the market action that has unfolded recently. Make sure you zoom right out to the bigger picture (at least monthly if not quarterly).
Work Hard, work smart.
Andrew Baraniak
