Spot1, SpotV or Contract Month?
As Natural Gas pushes higher, we are now seeing a big expanding weekly swing up. This expanding weekly swing range has me questioning my bearish outlook and pondering, have I overlooked something? I may have been watching the continuous SpotV chart and the current contract month, but I had failed to check the Spot1 chart. This might be worth a look to give another perspective on the Natural Gas market.
The Spot1 market takes into account all days of trading for each contract month, rather than the contract with the highest volume like the SpotV market.
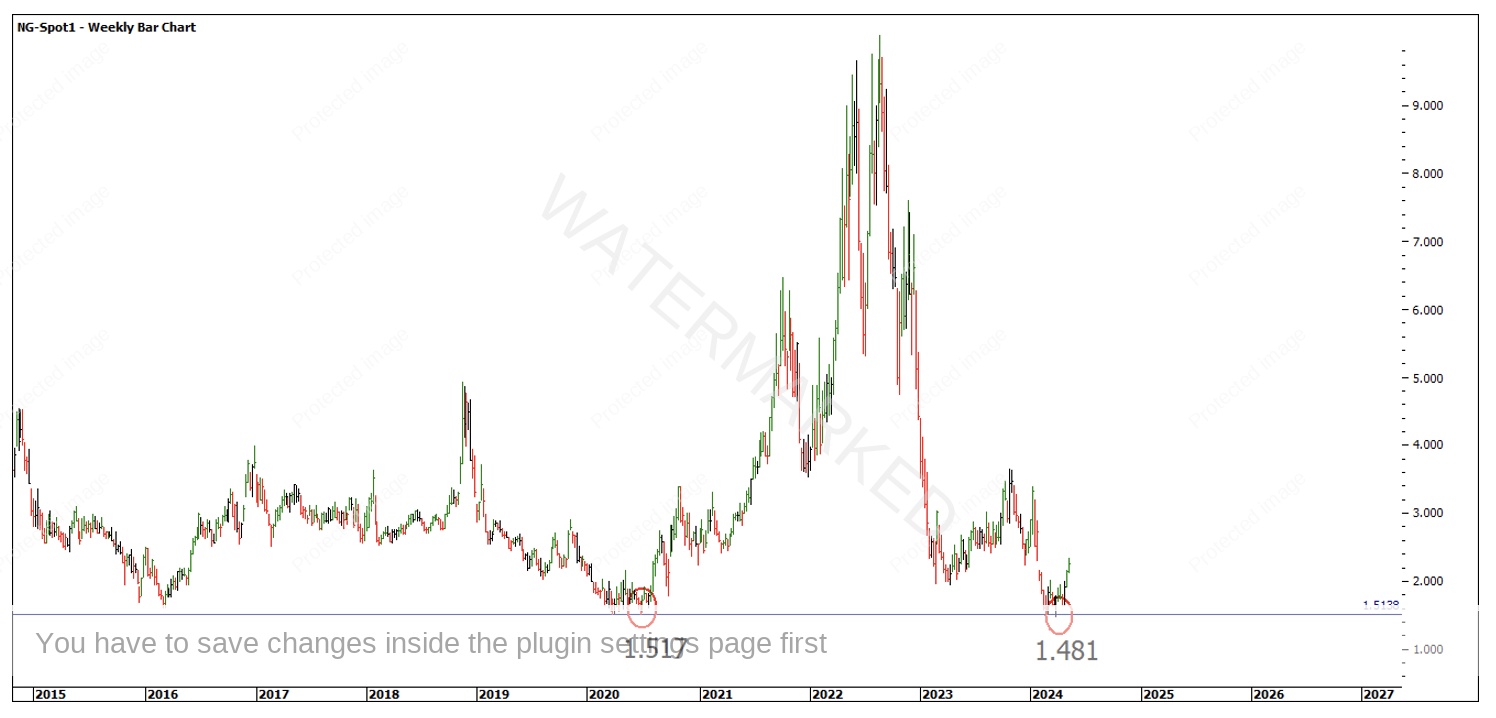
Taking a look at NG-Spot1, you can see that Natural Gas actually made a low on 26 March 2024 at 1.481 which was a false break double bottom with the June 2020 low! The SpotV chart however shows a slightly higher bottom.
Chart 1 – NG-Spot1
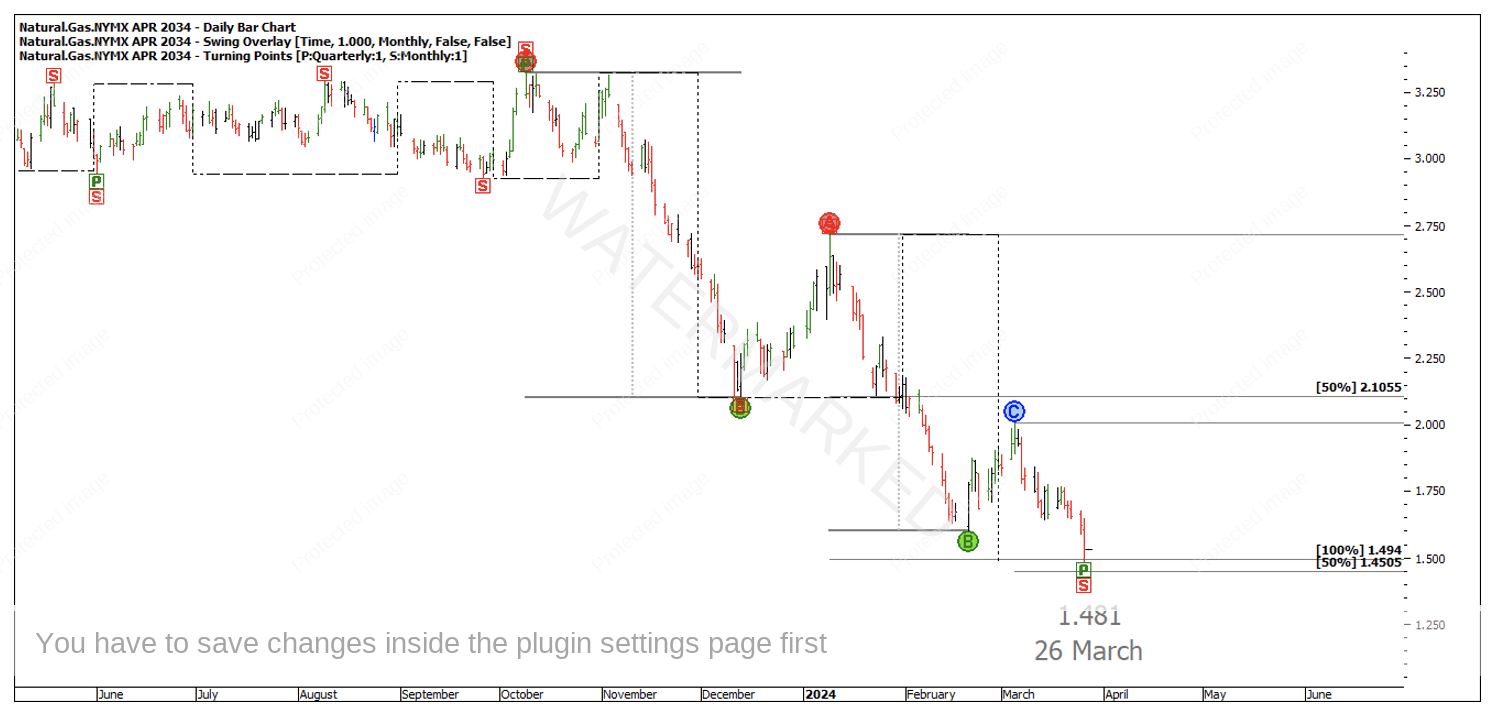
Looking at the individual contract month, you can see it was the April contract at the time and was the last day of trading before contract expiry. Interestingly enough on the contract month, there is a repeating monthly swing range into the 26 March low at 1.494. Within that monthly swing, there was a failed weekly swing down that fell just short of the 50% milestone at 1.4505.
Chart 2 – April Contract Month
This cluster showed up on the April contract month and doesn’t show up on the continuous Spot1 or SpotV charts. That means all three contracts are giving different prices! Not only that, the current June contract month gives us different prices again.
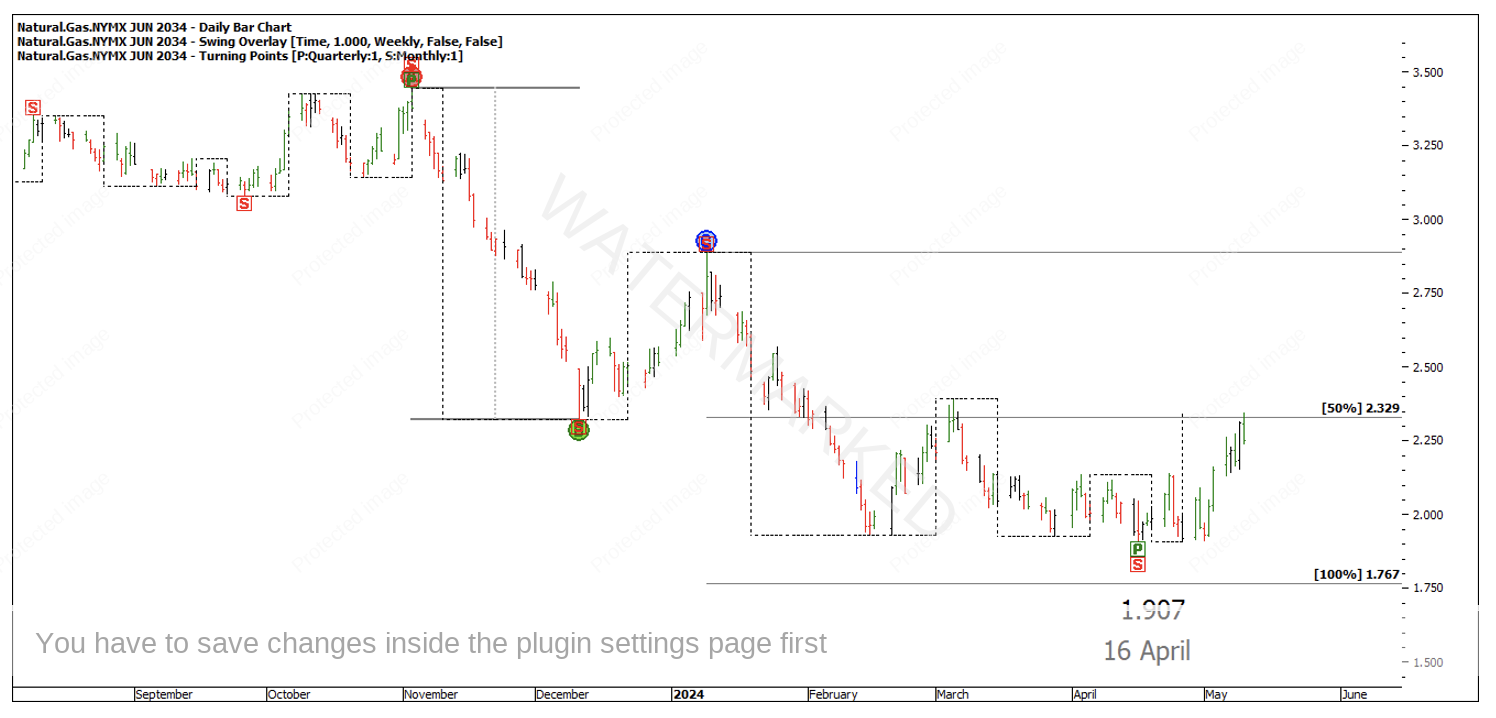
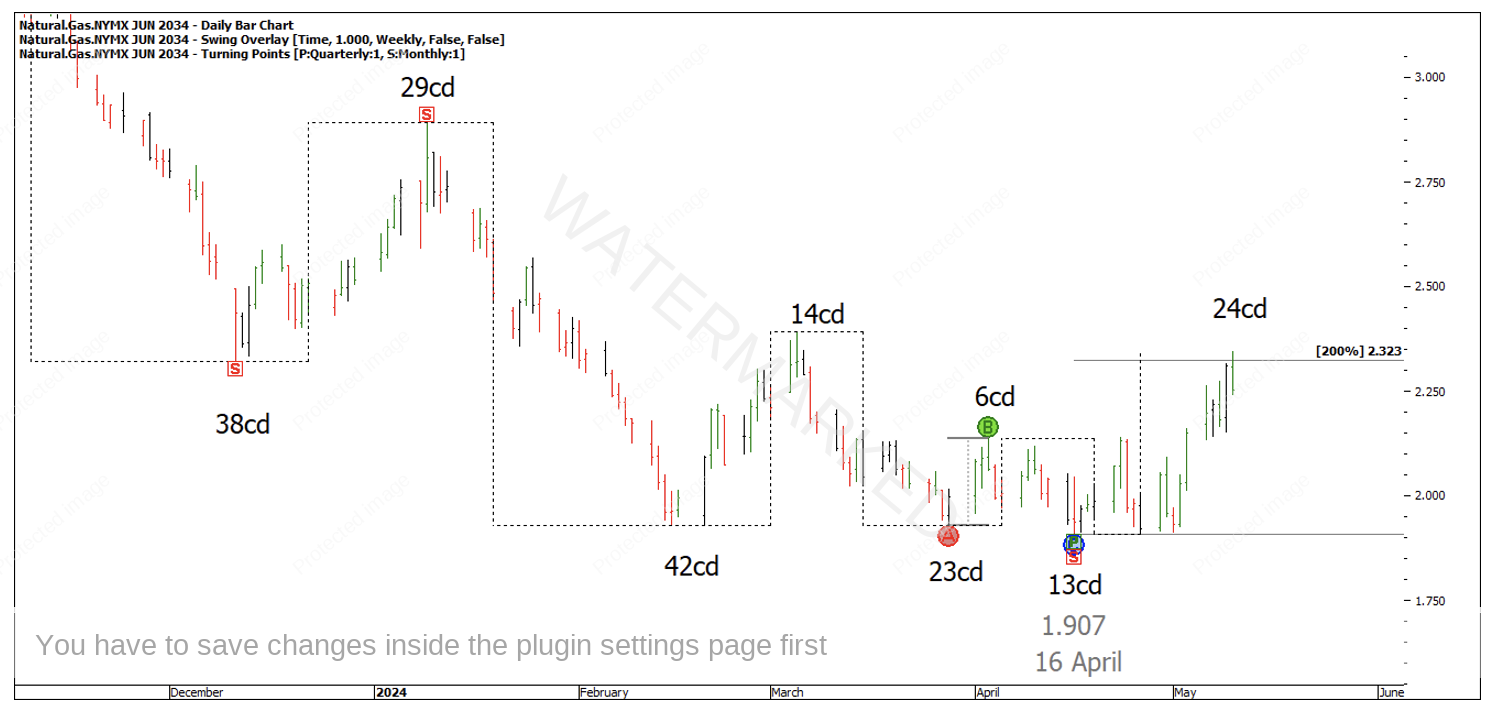
The below June contract shows a contracting monthly swing into a 16 April low of 1.907. Within the last monthly swing there have been three weekly swing ranges down, with the last two contracting into weekly swing triple bottoms.
Chart 3 – June Contract Month
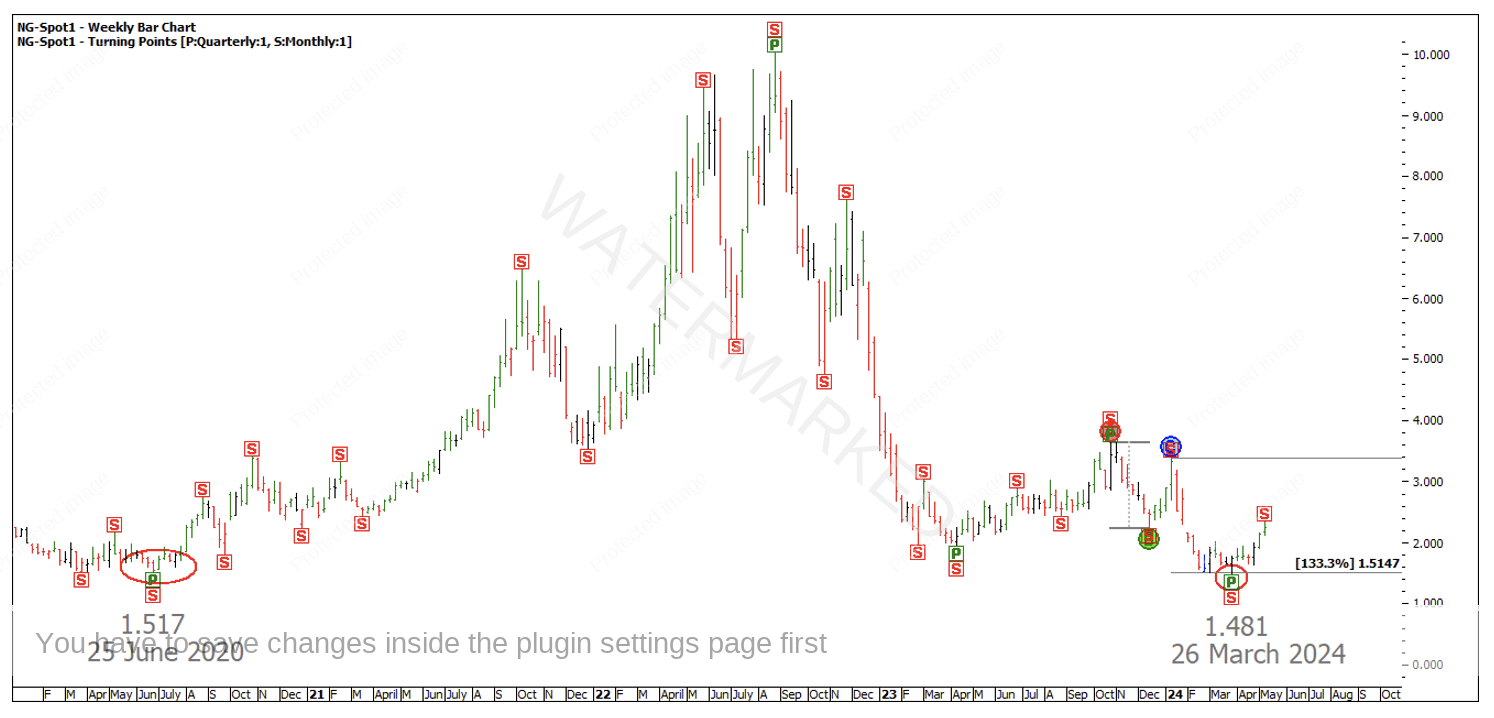
The Spot1 chart, however, shows an expanding monthly swing down at 133%.
Chart 4 – NG-Spot1
It’s going to pay to watch the Spot1, SpotV, current June contract and the upcoming contract when June is getting close to expiry.
A great attribute of trading is that you can stay out of the market until you see a clear setup. Letting the market prove itself first in the way of an Overbalance in time and price, followed by a cluster at Point C, could be the next opportunity on this market.
The current weekly swing up has overbalanced the last weekly swing range in time and price although it is still a small range compared with the two, weekly swings previous of 14 days and 29 days up.
Chart 5 – Weekly Time Trend Analysis
If this market has put in a major cyclic low, then there will be plenty of opportunities to get long over the coming months. We can rate the strength of this weekly First Range Out in time and price to help gauge if we’re looking at a new A-B range or still in a B-C range.
Happy Trading,
Gus Hingeley
