Staying on the Horse!
The wrap up from last month’s discussion on Crude Oil was to highlight that trades of all types come along and results, good, bad or indifferent are an expected outcome in any trading business. As is normal with much in the human condition the ability to discuss the failures and pain is often the hardest. The same goes for sport in the sense we learn nothing from a win but plenty from a loss.
The concept of loss aversion is also a well-studied and discussed human trait, we dislike all the attributes of loss so at some point all of us when faced with loss look to avoidance as a strategy, which can be to our detriment. In balancing the emotions of trading, we are tested to make sure we are not revenge-trading after a loss and have solid reasons for whatever we do next. The foundation of a robust trading plan here is crucial.
Crude Oil did just enough to “mug” me off the seasonal date turn. What was a short scenario turned and ran the other way. In a follow up to that move, we can break down the recent action and look at ways to find the next trade.
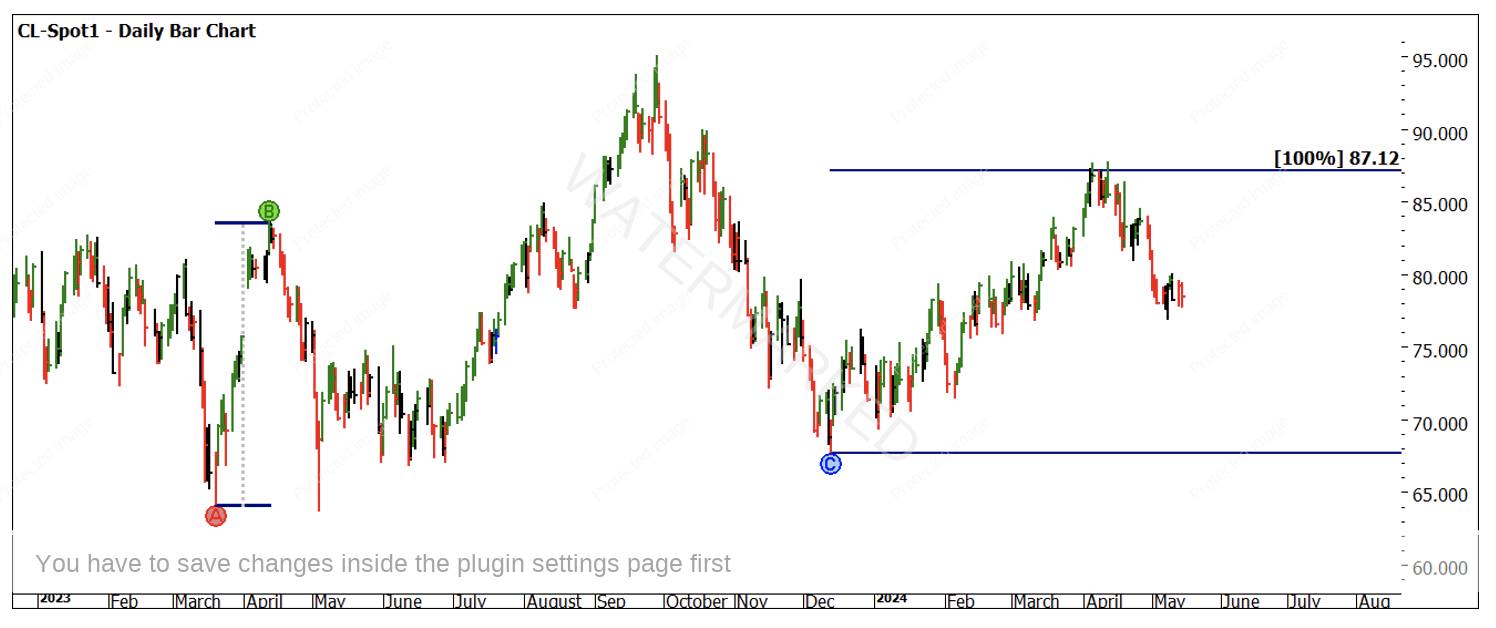
The reference area I am focusing on is what we can suggest is the small double top patterns of early April 2024. The price repetition of 2023 around the same period shows how slow this upside movement has been in time compared to the previous but is spot on 100% repetition in price.
Chart 1 – Daily Bar Chart CL-Spot1
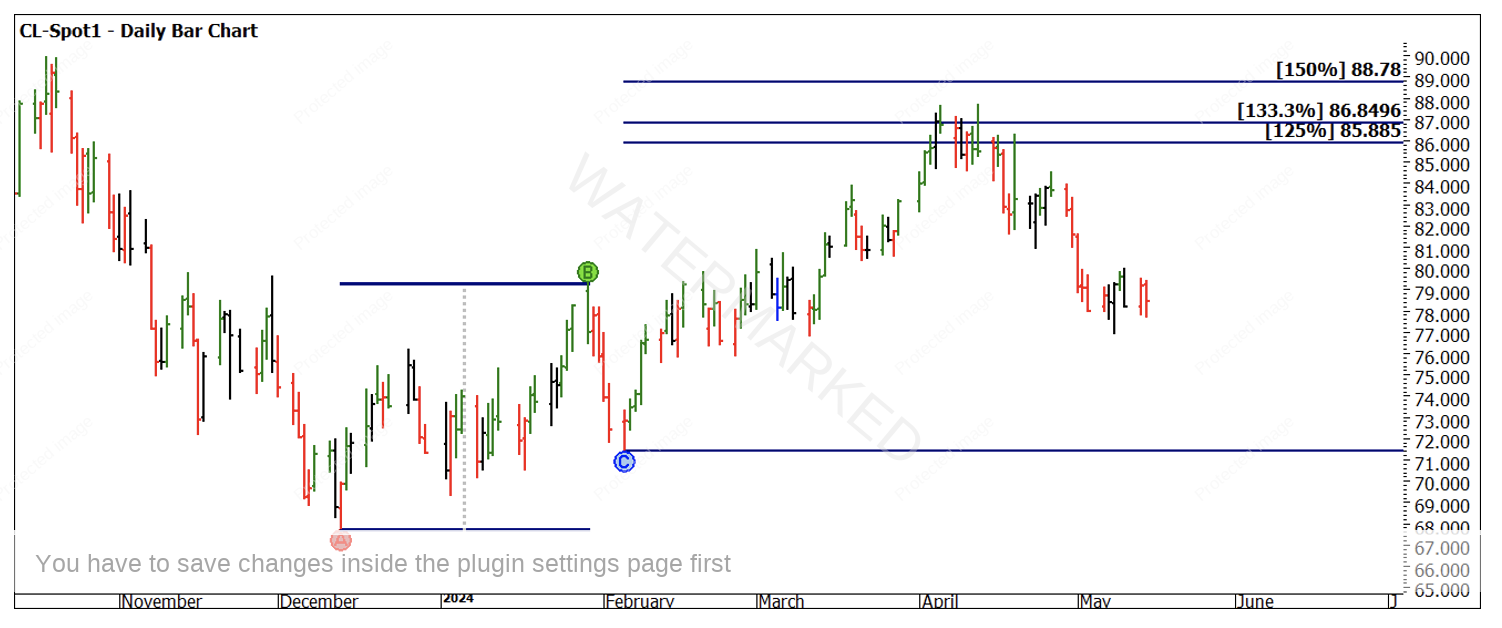
There were also several price projection tools that allowed for the creation of a cluster at the $87- $88 price area. Chart 2 shows us a 133% level.
Chart 2 – Daily Bar Chart CL-Spot1
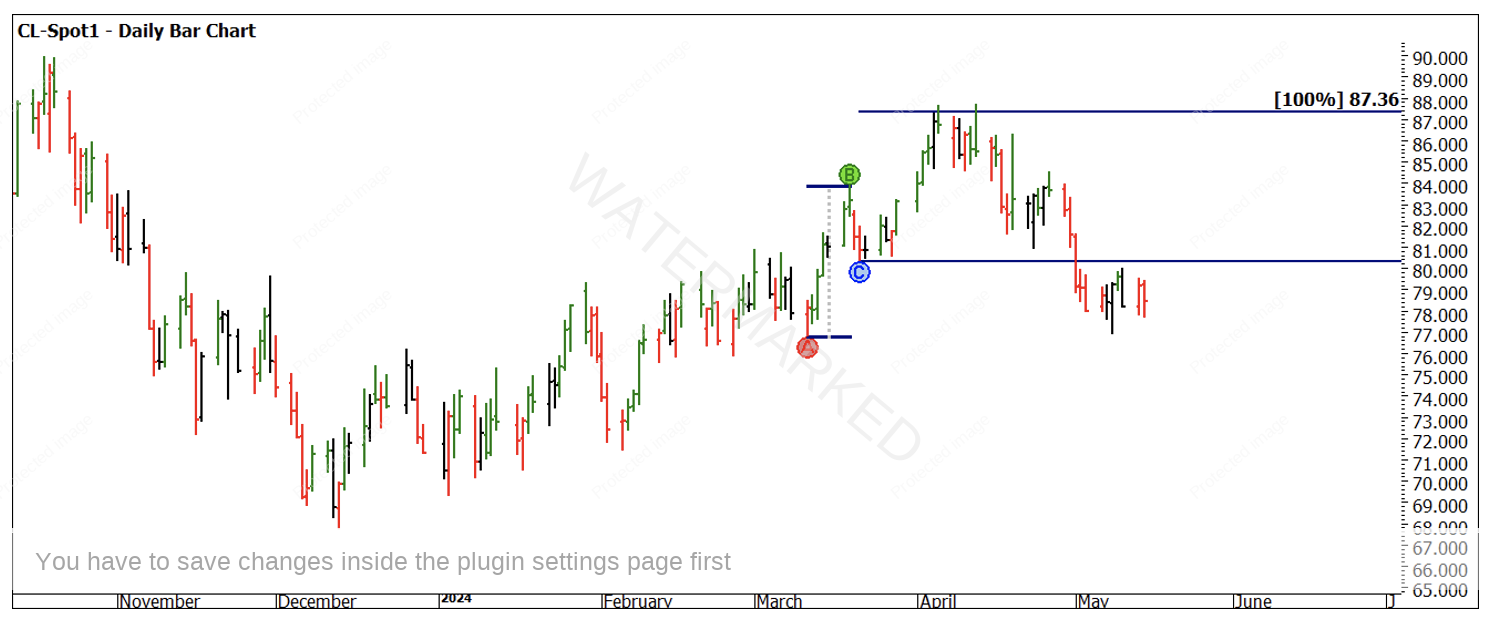
Chart 3 uses the final swing range into the top as a 100% repeat. This in many ways is combined with watching swing ranges moving into a turning point for the subtle signs of change.
Chart 3 – Daily Bar Chart CL-Spot1
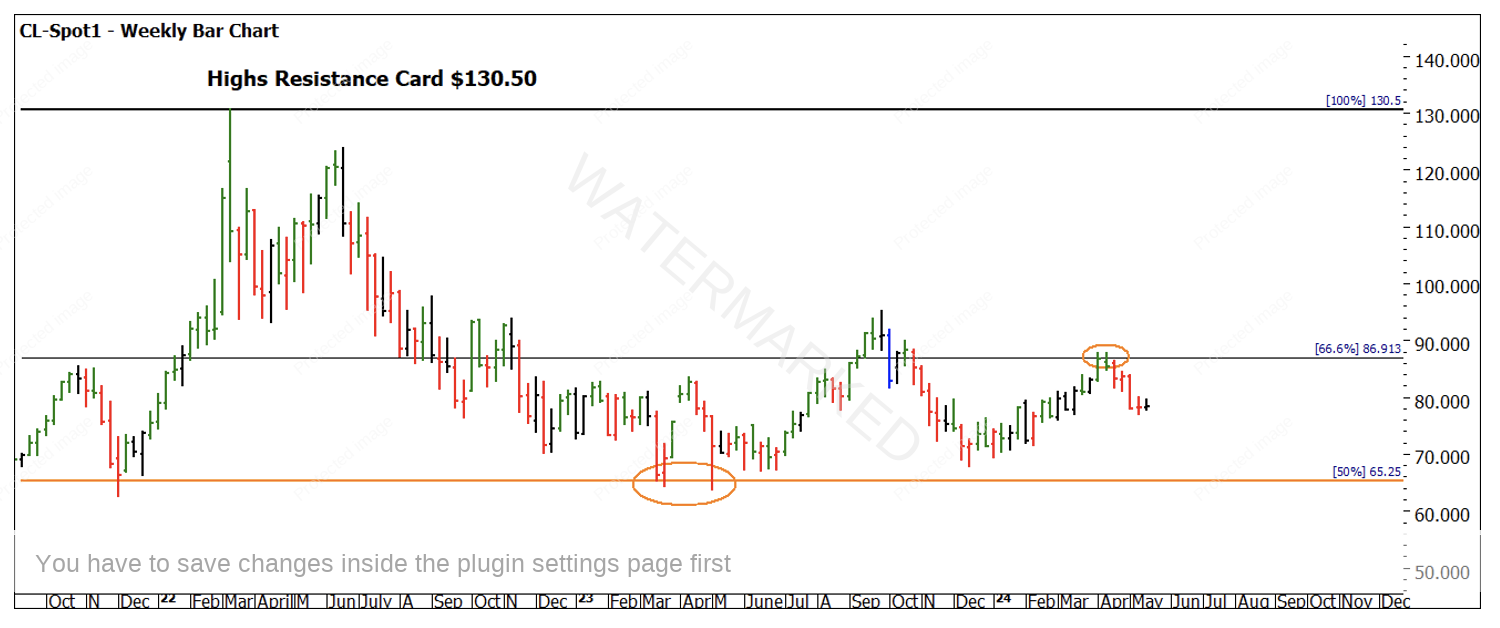
Chart 4 uses the Highs Resistance Card with the last major cycle high of $130.50. We can see how the 50% level has previously been helpful and now the 66% level has offered resistance.
Chart 4 – Daily Bar Chart CL-Spot1
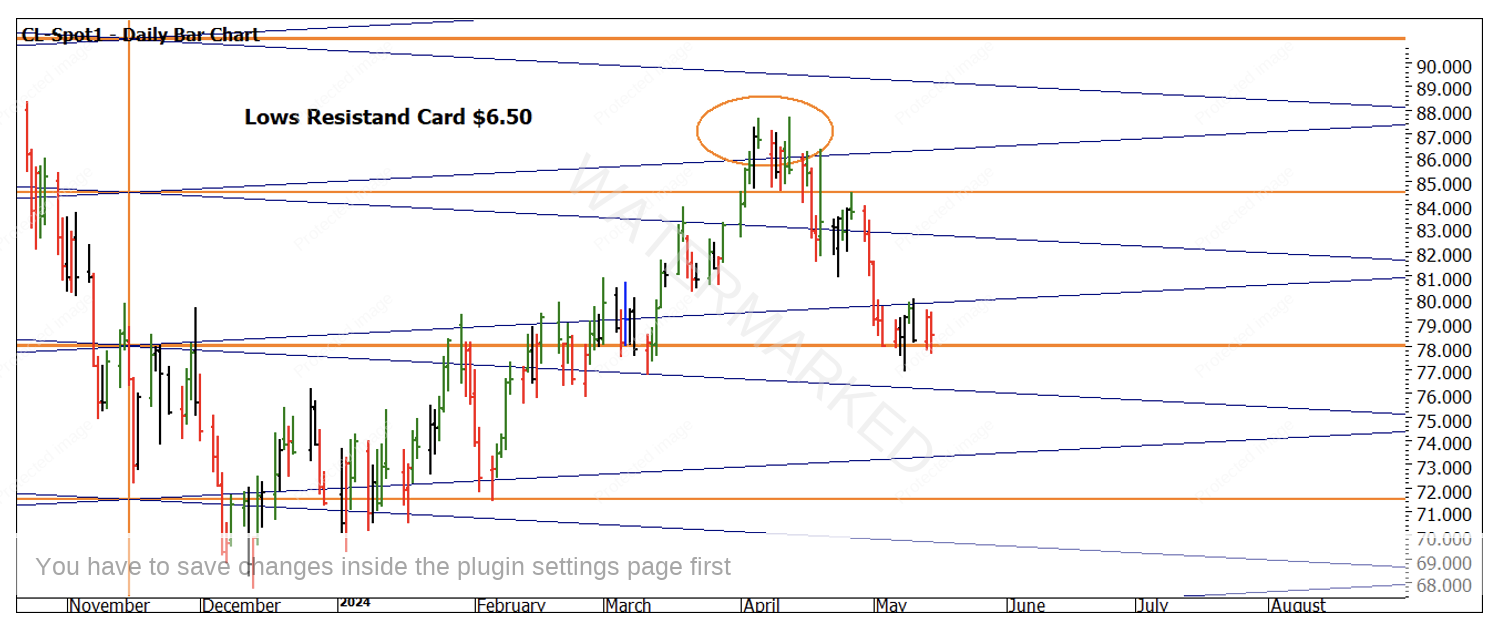
Chart 5 is the final price-based focus and in line with clustering with all our available tools the Lows Resistance Card from the $6.50 low in 2020 helps us understand the April top was weak in the square and the current price action in May has found some support.
Chart 5 – Daily Bar Chart CL-Spot1
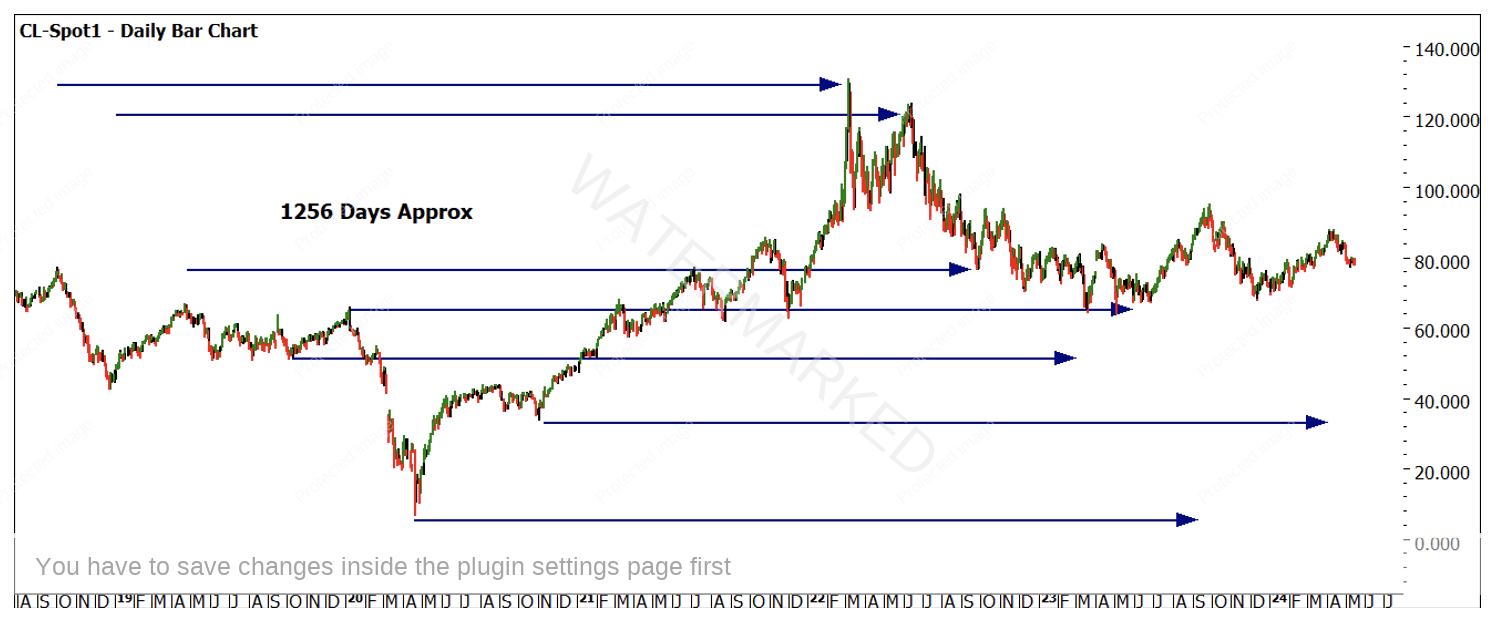
To attempt to lock this in for you I am running with a long-term time frame that has appeared within tolerance over a period of this market. 1,256 is a number that many may be familiar with, and it should become one you test on this market to your own satisfaction. Of note is that 1,256 calendar days is very close to being 180 weeks. Chart 6 shows some reference tops and bottoms you could measure against as a starting point.
Chart 6 – Daily Bar Chart CL-Spot1
By anchoring the low of 2020 in November and projecting forward we get April 11th, 2024. The second leg of the double top came in on the 12th of April at a high of $87.67. Prices are currently trading around $78 USD so a short sharp movement has occurred with the potential for more.
At this stage I leave you with the analysis and we can pick up next month the basis of entries and trade management. There are a number of other supporting time elements that can be blended into this setup so that may also act as a good homework opportunity before we discuss trade management.
Until then, good trading
Aaron Lynch
