Stock Index Revival
If we look at the last few weeks on many stock index markets around the globe, we could think that the bull may not yet be dead. The current landscape is exactly why we need to stick to the technical picture rather than the noise and opinion. That’s not to say that the narrative is all rosy and there are no challenges facing the global economies. We must ensure we don’t get too distracted by the possibilities of what may happen in the future, for example a global recession.
We have recently started to see earnings posted in many global markets both Australia and the US and for many companies their performances were still strong. Therefore, raising interest rates is a blunt tool as this can take several months to see change in a company’s performance. There are so many global indexes I could focus on with a similar picture but in this article, I want to focus on a less discussed but very important index, the Russell 2000 in the US.
Unlike the Dow, S&P500 and Nasdaq the Russell index focuses on smaller listed companies, but don’t be fooled into thinking these companies are small concerns. They list many household names and most likely represent many day-to-day businesses that people in the US engage with. The good news is that you can access this market with futures and ETFs depending on your focus.
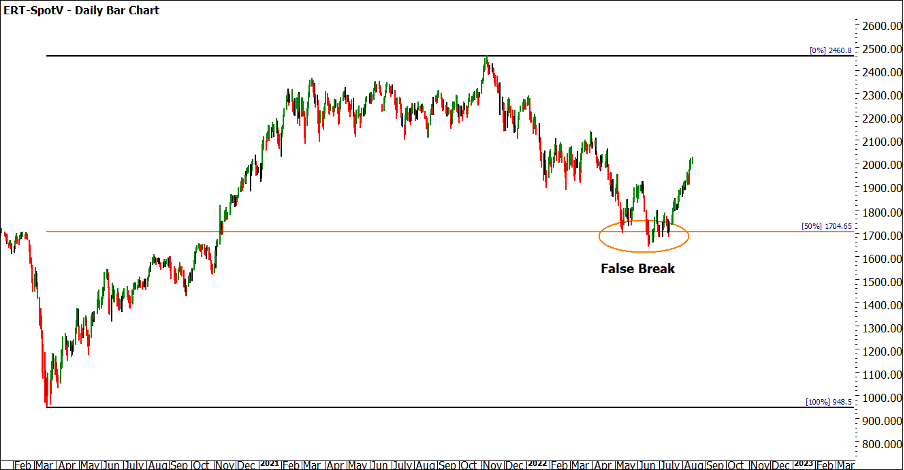
Chart 1 shows the last 2 years of price action and has captured the COVID low of 2020 and the recent sell offs. Note that the 50% level again delivers its value and the small false break below it and reversal back above is a good sign of strength.
Chart 1 – Daily Bar Chart ERT-Spotv
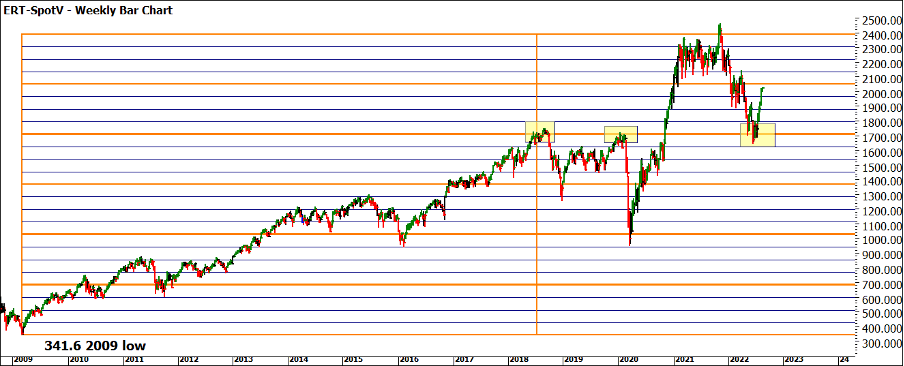
Following on from my theme of simple things done well we see in Chart 2 the value of a Low’s Resistance Card from 2009, the low following the GFC. The 2018 and 2020 highs were essentially double tops at 5 multiples of the low. Those highs then became a bottom in 2022. The use of old tops becoming new bottoms holds here for us.
Chart 2 – Weekly Bar Chart ERT-Spotv
For those using All-Time Lows as markets squares you should note the position of the tops and bottoms in relation to the square.
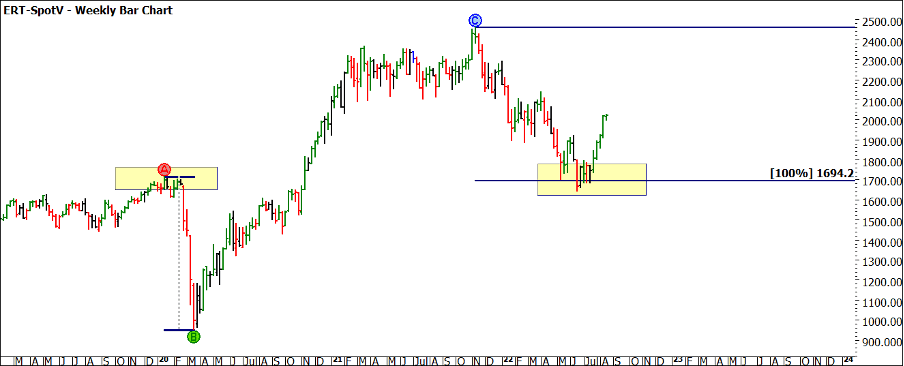
Chart 3 again just using 1st dimension price-based techniques measures repeating ranges. The COVID sell off of 2020 has essentially just repeated itself (100%) in 2022. I also can’t help but comment in the 2020 low arriving around seasonal time in March and the 2022 low close to the June seasonal date.
Chart 3 – Weekly Bar Chart ERT-Spotv
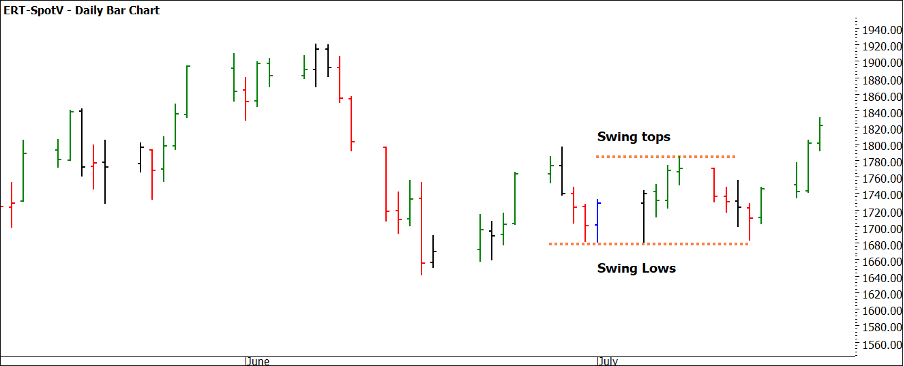
The next test for you is to review your swing ranges running into the 2022 low and see what information was helpful in expecting a potential change in trend. There were higher swing bottom opportunities to enter the market, however, the sideways period was challenging as patience was required.
Chart 4 – Daily Bar Chart ERT-Spotv
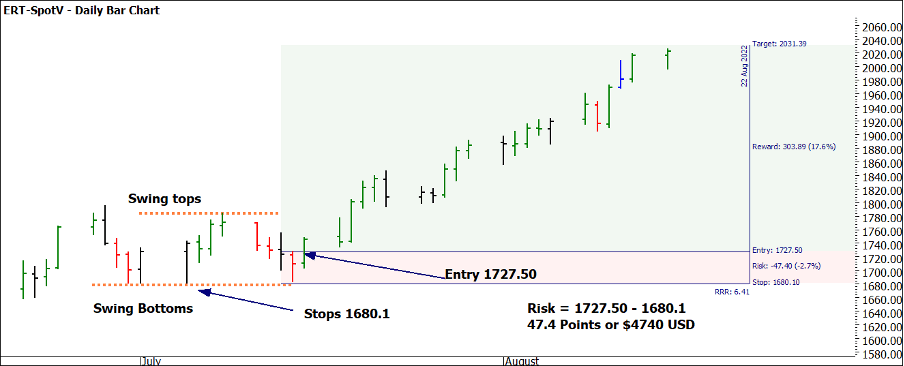
With the Russell it follows the 4 major trading months for indexes, being March, June, September, and December. Each tick is 0.10 of a point and is worth $10USD. Hence a full 1 point move 1700 to 1701 is 10 ticks or $100 USD. Chart 5 outlines one possible entry plan.
Chart 5 – Daily Bar Chart ERT-Spotv
There has been a move of more than 300 points with stop management being less challenging as we have seen a case of higher bottoms on the swing chart being formed.
Your homework now is to see if there are other indexes performing in a similar way across the board. The SPI 200 in Australia has moved back above 7000 points and there are other indexes that could be set to follow. There is also talk of a “dead cat bounce” creeping into the media, which may be our next “noise” moment to overcome.
Good Trading
Aaron Lynch
