Strong Trends
Greetings to all wherever you may be reading this. Many of us find ourselves again in lockdown due to COVID in Australia and this clearly has effects on our overall wellbeing. One of my outlets when Sydney last locked down was to use my time wisely and pick up some study projects. As a parent with active kids, I have found the largest time change to my routine is the lack of driving my kids to all the various events and activities they undertake. As this lockdown kicked in again, I was able to plan to divert some of that available time to some research and study projects.
This has been helpful from a state of mind perspective, and I would encourage you, if possible, to divert some time to yourself in whatever capacity brings you a healthy headspace.
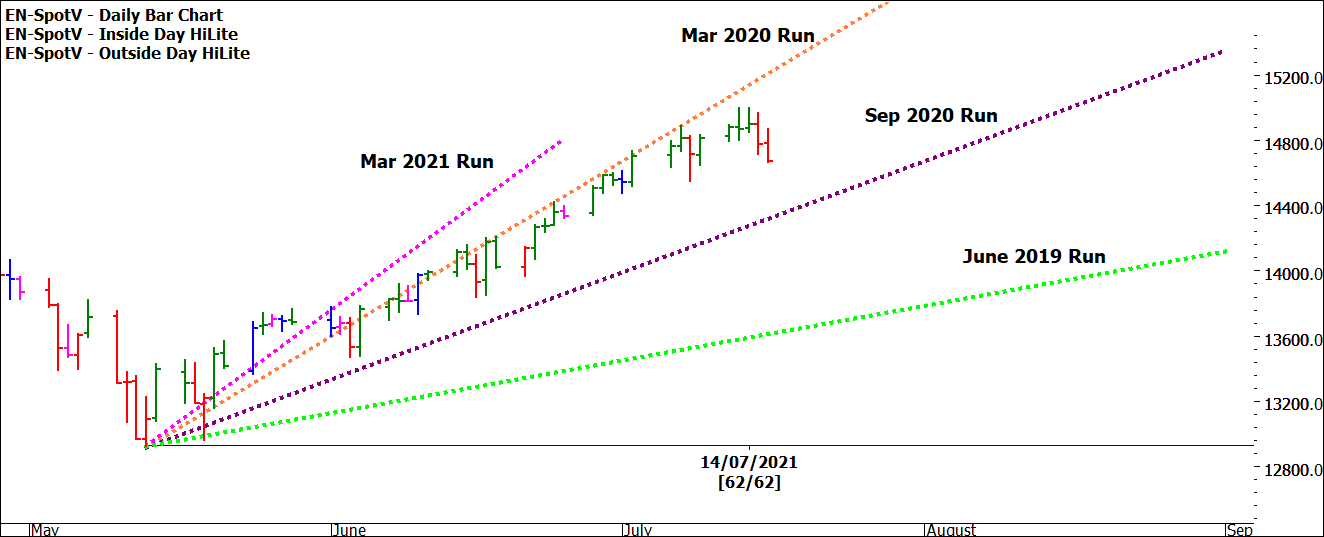
To the markets, we have been presented a mixed bag of activity. The Nasdaq has again been a standout index in terms of trend. We have seen the low in May 2021 springboard prices higher to the most recent high 62 days from the low. I have used David’s technique of speed angles to measure the pitch of the market (not to be confused with angles) to understand how this most recent move relates to previous bull moves.
Chart 1 highlights several notable patterns. Firstly, last week was the first time we have seen a true two-day reversal pattern i.e., 2 down days. This suggests a change of sentiment since the May low. The general momentum in this move shows that it is not the strongest move based on speed angles but also not the weakest. Buying the dips in this recent move and over the last 18 months has been a simple yet effective strategy.
Chart 1 – Daily Bar Chart EN-Spotv
In an ever-expanding market, we can look to Lows Resistance Cards as a guide to support and resistance as using a Highs or Ranges Card presents some challenges in determining price pressure.
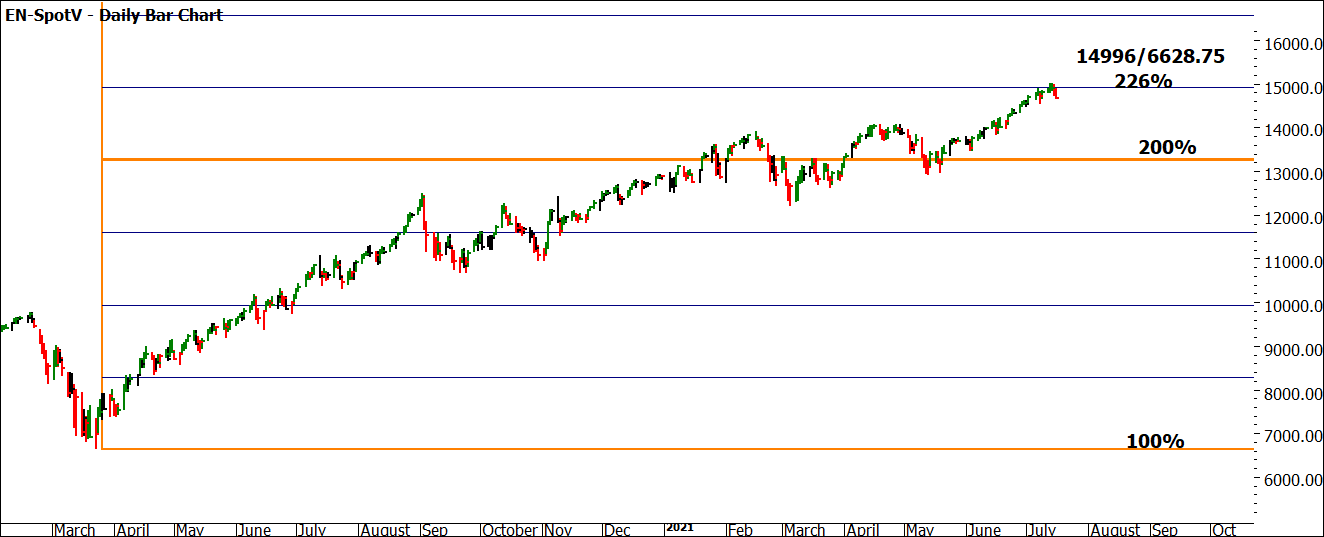
Chart 2 shows the chart and basic math associated with calculating the current high as a percentage of the low you are measuring against.
The COVID low of March 2020 is a solid analysis point to anchor our projections from. We can see the price action has run into resistance at 226% of the low point. Or another way of saying it is the low has repeated 125% in price (the orange line being double the low of 2020 6628.75). We could make a case as well that the orange line has acted as support and resistance in recent times.
Chart 2 – Daily Bar Chart EN-Spotv
The recent pausing in global equity markets has come about from the ongoing COVID concerns but also the inflation indicators that are appearing in markets, especially the US. In short, an increasing inflation rate puts downward pressure on equity markets, and this has raised concerns over how long-term growth can be achieved in shares.
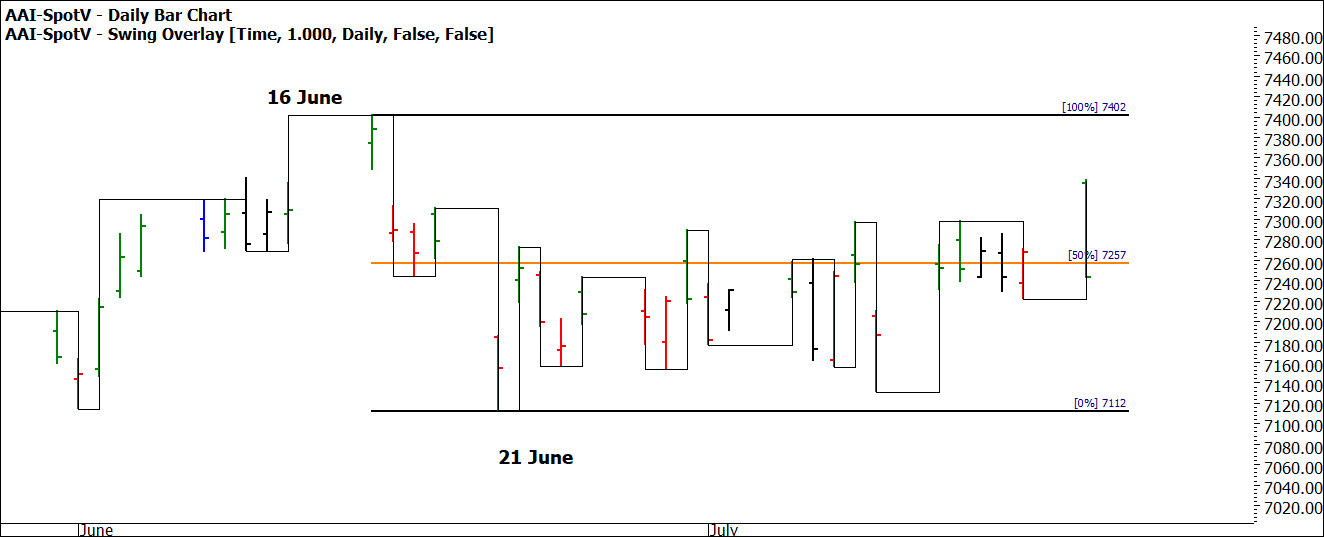
A worthwhile exercise for you is to review the global stock index markets and see what the overall trend and patterns are. There are multiple index markets we can study, Chart 3 below shows us our local SPI200. Since the record highs of June this year we have seen a sideways market develop. This price action tells a very different story when compared to the Nasdaq.
Chart 3 – Daily Bar Chart AAI-Spotv
If you review the position of the majors that would Include the Dow Jones 30, the S&P 500, the FTSE 100, Germany, France, Japan, China, and India you may find a similar pattern. If so, what does that mean for our potential trades within a trend?
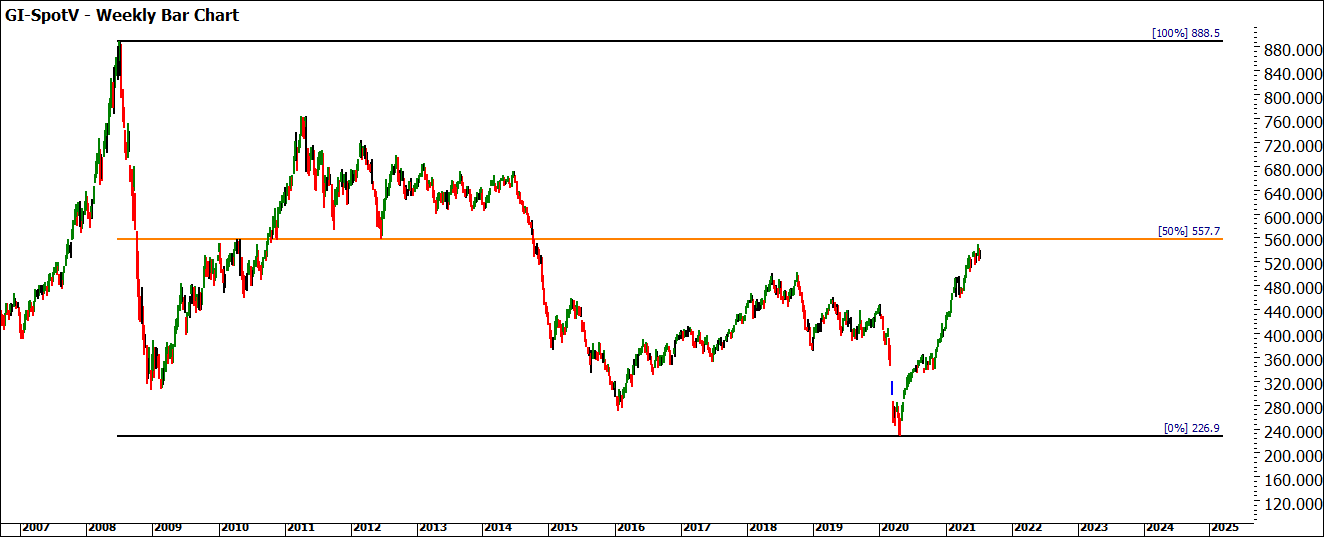
Can I suggest this time might also be useful to expand your coverage of markets? If we see a theme of increased inflation, one area of the economy that benefits from that is commodity prices. Chart 4 shows us the Goldman Sachs commodities index, a basket of commodities weighted towards the size of the underlying commodity.
Chart 4 – Weekly Bar Chart GI-Spotv
The 2008 high is a long way from current prices, as an asset class, this is likely the one that has the greatest potential recovery if it were to recover to its record highs. If we look at many shares, they are currently trading at record highs.
The concept of asset allocation and money flowing between those asset classes is always a challenging and up for debate discussion. I encourage you to broaden your horizons of markets, maybe commit to a lockdown goal of knowledge.
Stay Safe,
Aaron Lynch


