Subtle Signs!
2021 is now in the background and for many including me, there was some optimism about what 2022 would bring on the COVID front. When I last penned an article in early December 21 the reopening of New South Wales and optimism of more normal times meant that maintaining bullish sentiment was more in the balance of thought as opposed to the downside risk.
We identified the level of 15,567.5 on the Nasdaq as a point of significance in terms of resistance levels. The 50% of any range (the more major the better) offers us the chance to see what type of market we are in, weak, strong, or neutral. With the explosion of Omicron and the real concern of inflation climbing globally, equity markets have shown they are not runaway freight trains with only the upside in mind. We must note the subtle changes and make decisions accordingly if we are to be on the right side of our trades in 2022.
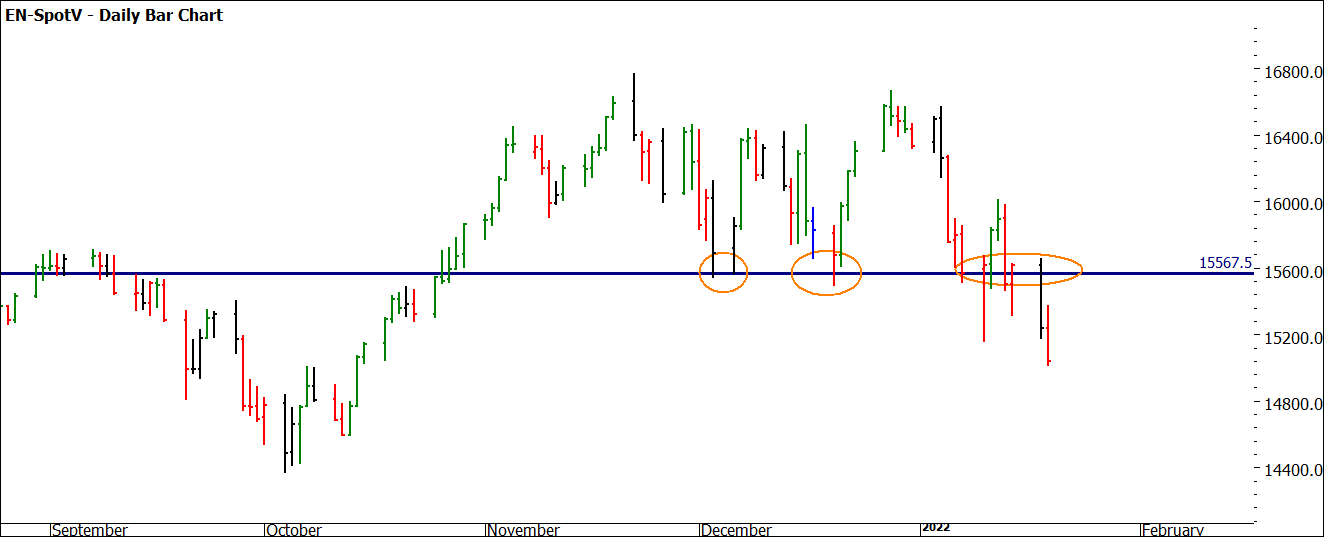
In Chart 1 we can see how the Nasdaq futures failed to deliver any Christmas rally and found the 50% level to be initial support and then resistance as the month of January has unfolded.
Chart 1 – Daily Bar Chart EN-Spotv
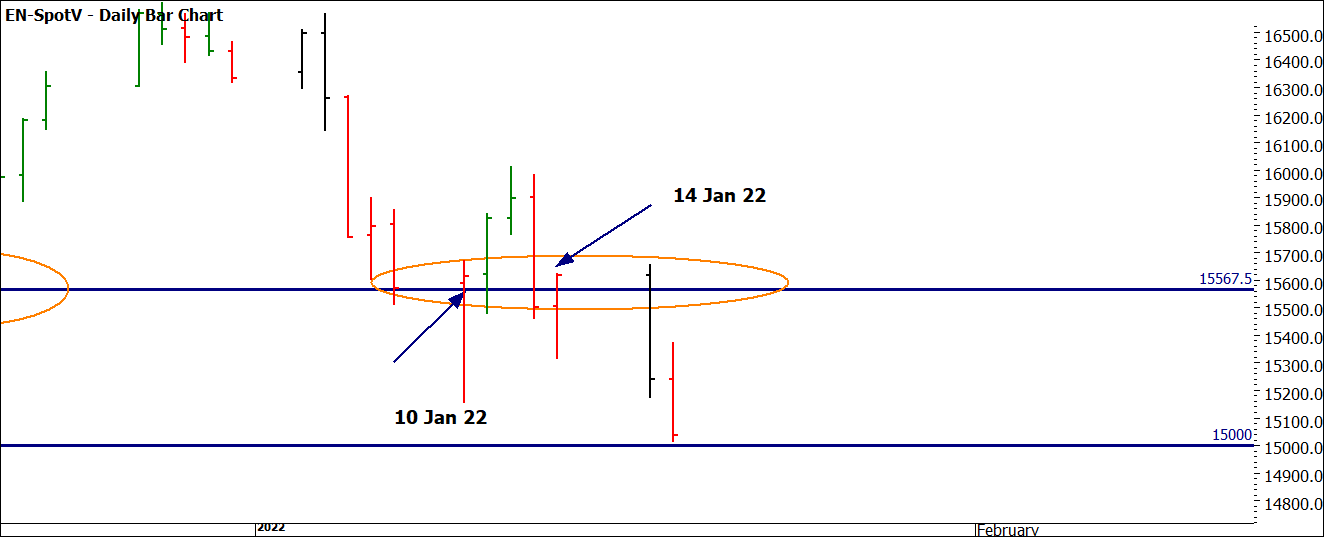
If we analyse the bar patterns, we are attempting to judge sentiment of bulls and bears and who is in control of momentum. In Chart 2 we see on the 10th of January 2022 a real test of the bull’s conviction as the price action breaks under the 50% level and was forced back up to close above. These types of days are well worth being on the sidelines for, as they generate a lot of intraday volatility and setting and holding positions can be challenging.
The 14th of January also proved critical as the bulls again held the line of support and again closed above the 50% level after giving back the previous 3 days gains. Of the two trading sessions this week we have seen the price action break under and close in a weak position. The 15,000-point level will be an interesting area to watch as it will represent a psychological test for this market.
Chart 2 – Daily Bar Chart EN-Spotv
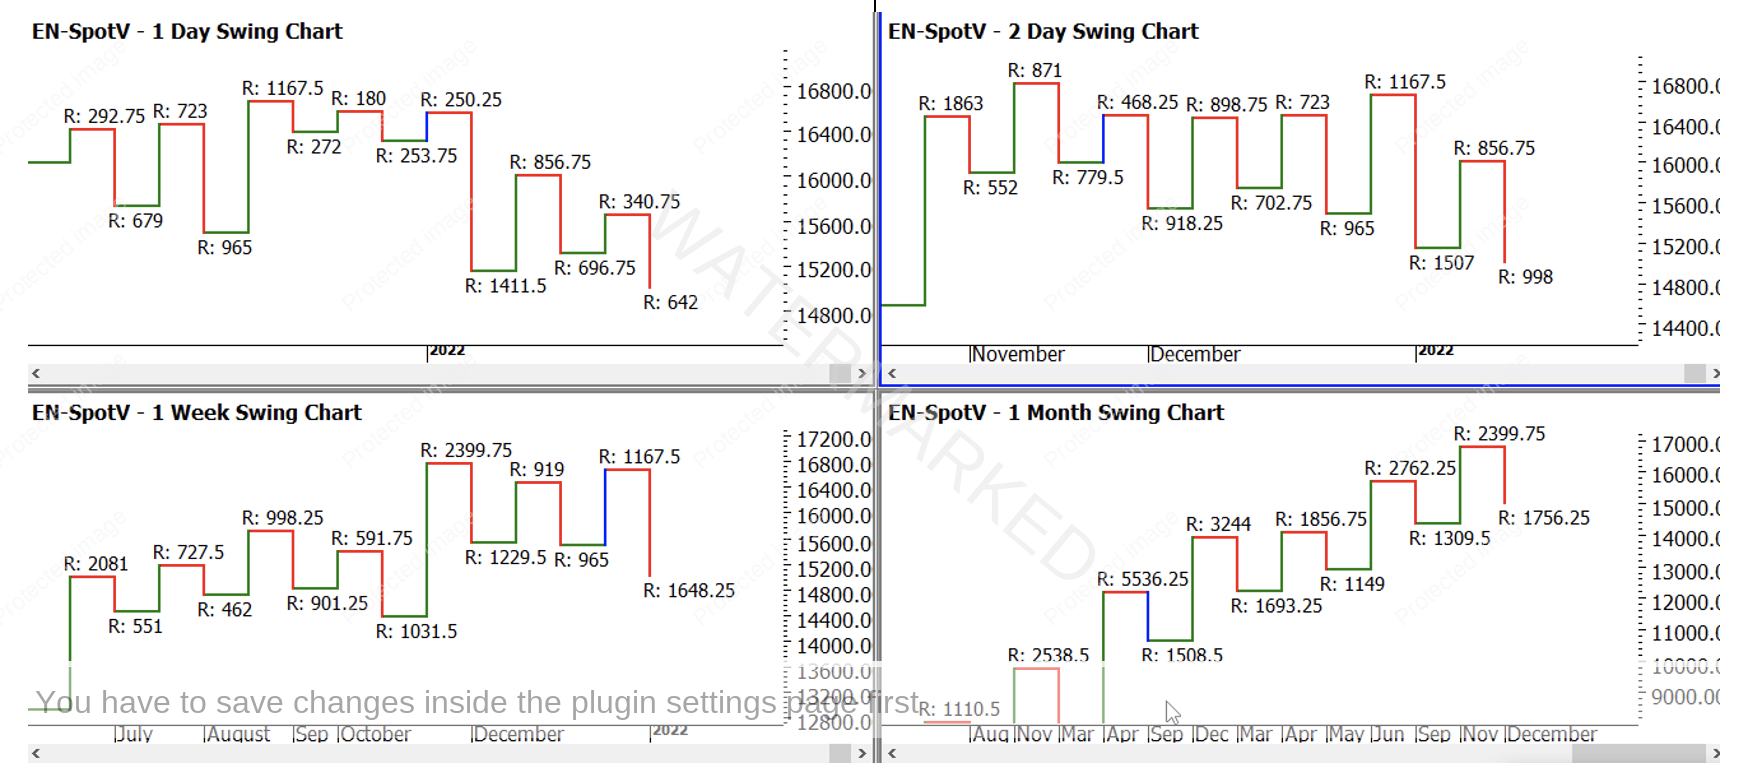
14,400 now looms as the next testing level for a variety of reasons, it’s an old low, important from the Lows Resistance Card and we can also see if we can tie in some swing ranges. Chart 3 displays the changing nature of our swing charts. The 1-day chart shows the trend as down, in line with the 2-day. The weekly swing chart is uncertain and the monthly remains up. Here is where we need to feel comfortable analysing different time periods and knitting together a picture of what is next. In the case where it’s unclear, that suggests you need to see more information before committing to a decision.
The next thing to consider is ranges and where we can establish expansion or contraction. That is your task to make sense of the patterns. For me the telling sign to warrant our attention is the expanding downside ranges on the weekly and monthly swing charts. They are not extreme yet in their movement, but its clear sentiment has changed, at least in the short term.
Chart 3 – Daily Bar Chart EN-Spotv
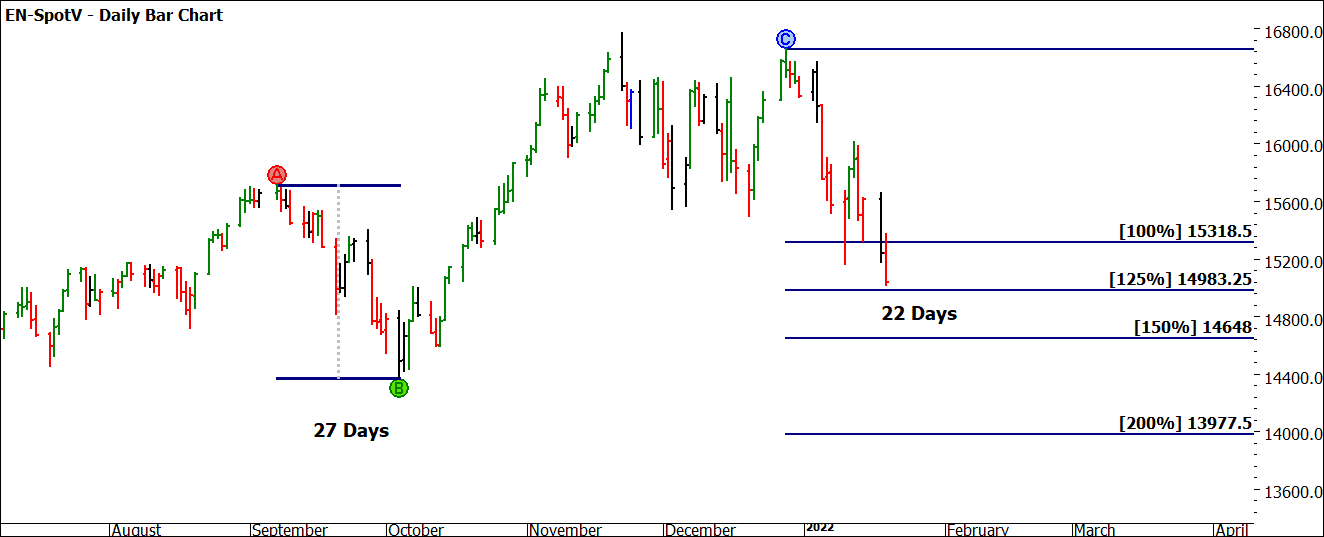
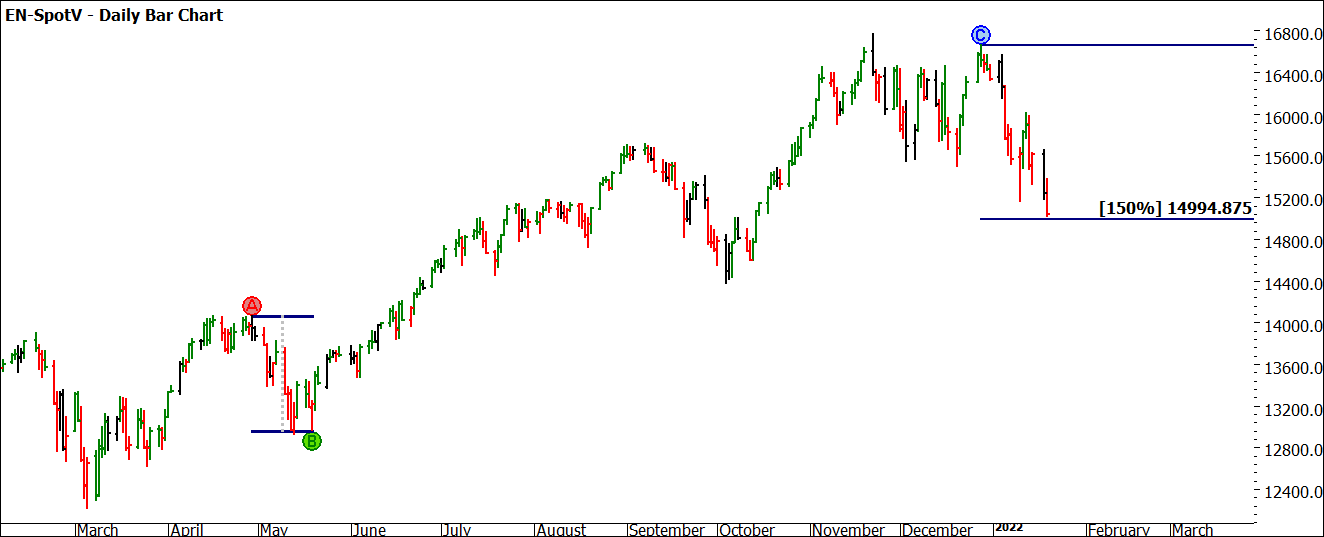
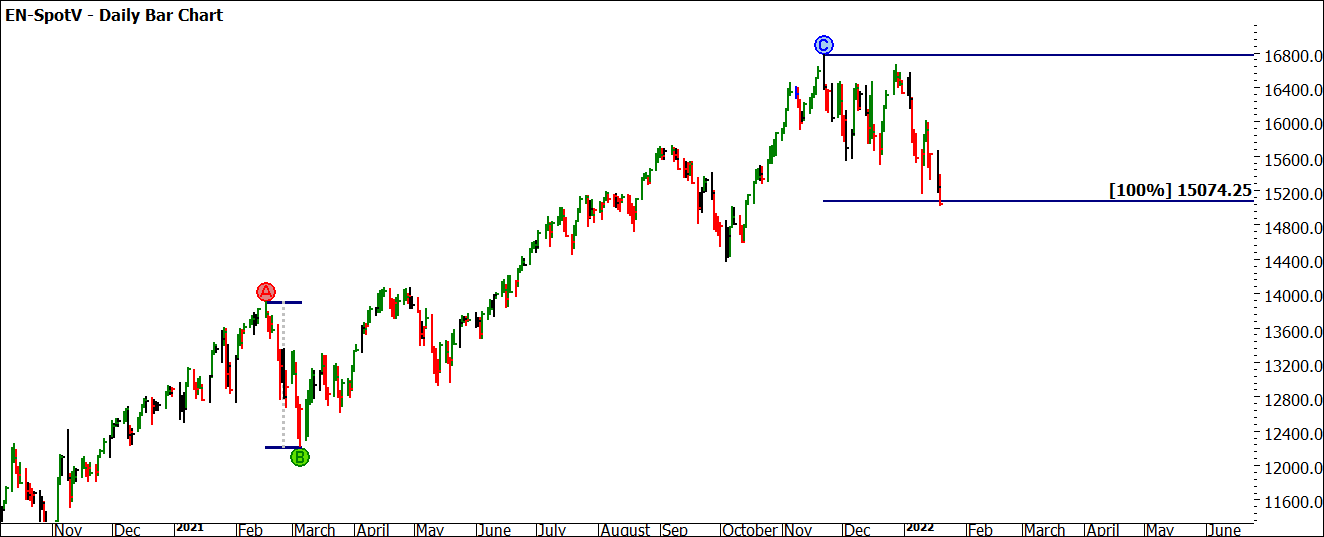
We can measure this current move south with the previous moves in the same direction, and this is where we need to look at history. There has not been a major set back on the Nasdaq for some time, so we are measuring relatively short / sharp drops. They are useful to measure against, but they are not major moves, so we should not weight them as heavily as bigger picture information. Charts 4 – 6 detail the bearish moves in comparison to now. We can see important milestones in play, in short if we are to see a change of sentiment and direction to the upside, I would expect one of these pressure points to play a part.
Chart 4 – Daily Bar Chart EN-Spotv
Chart 5 – Daily Bar Chart EN-Spotv
Chart 6 – Daily Bar Chart EN-Spotv
If we combine the pressure points from each Ranges Card, we get the value of 14,987.50 as a price cluster (15074.25+14995+14893.25)/3. Again, we could call this as good as 15,000 for general purposes and we now see how this could be a make-or-break point for the Nasdaq in the short term.
A quick comparison shows we are also 225% off the COVID low of 2020 @ 6628.75 and approximately 250% of the 2018 low. Clearly there is a lot to consider for the Nasdaq, we have seen such strong movements in equities. There could still be good times ahead for stocks but are we due some sort of rebalance? Time will tell.
Good Trading
Aaron Lynch
