Symmetrical Price Cluster
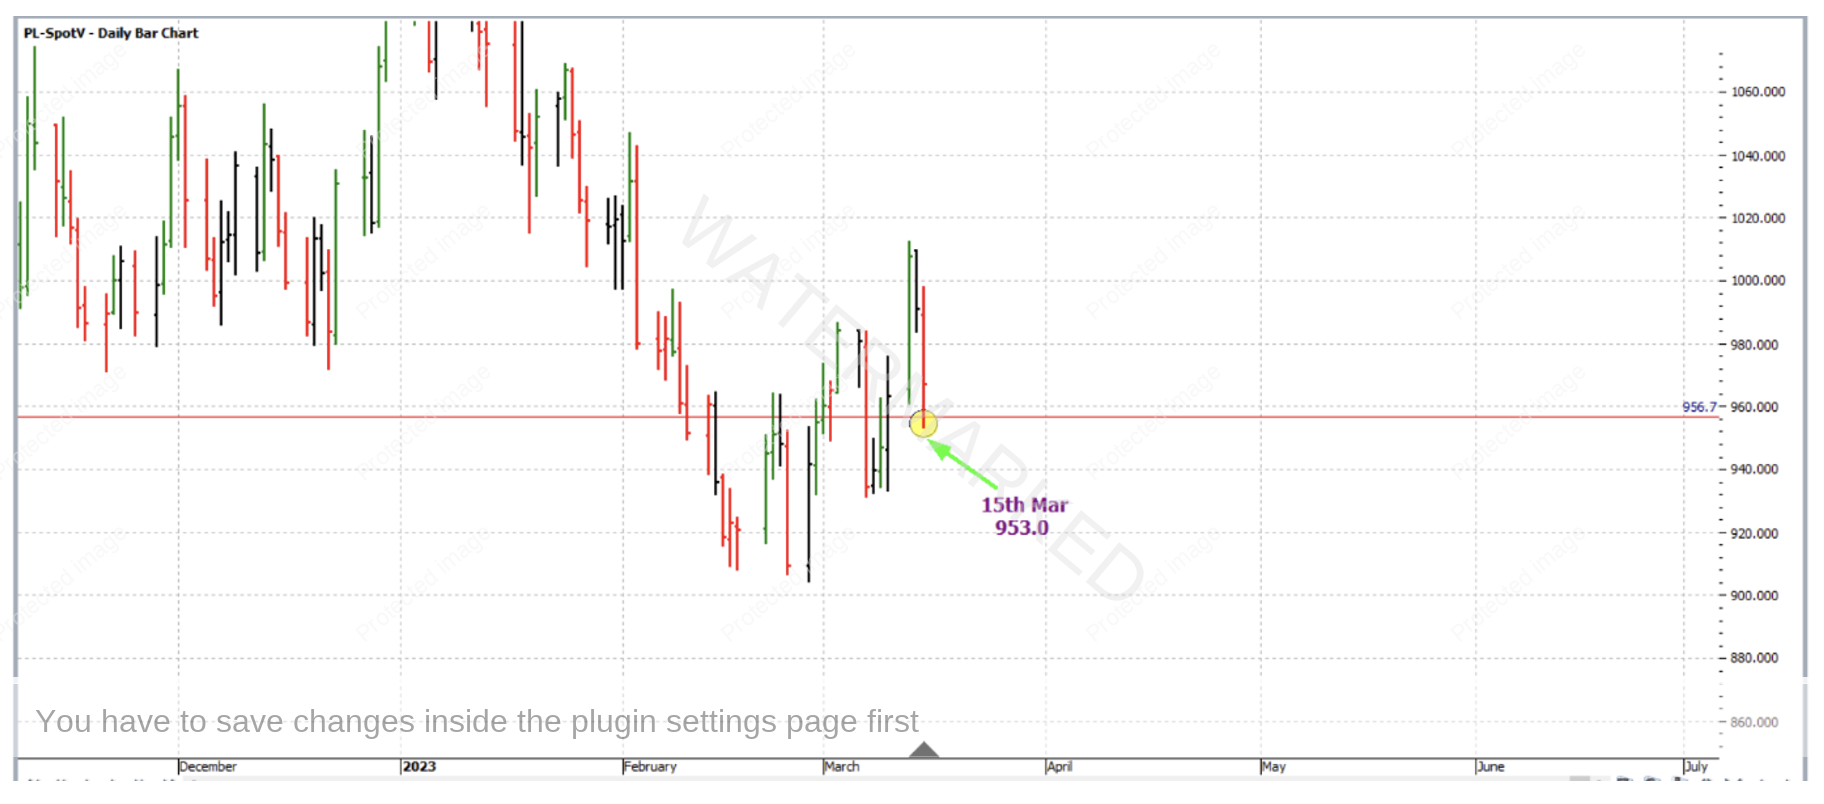
By 15 March 2023, the Platinum futures market had sold off briefly to reach a price cluster, with four definitive price analysis inputs averaging at approximately US$956.70 per troy ounce. The actual low on the day was US$953.00, with the false break of the cluster being very small in relation to the average size of a daily bar in this market. This is shown in the ProfitSource chart below in Walk Thru mode, chart symbol PL-SpotV.
In order to reproduce the analysis which created this price cluster, three applications of the Ranges Resistance Card (Gann Retracement tool) and one application of Repeating Ranges (ABC Pressure points tool) are required. But first, a few hints to get you started in applying the analysis to your chart:
- Hit the + key a few times – this encourages engagement of the bigger turning points.
- Go into the Properties of the Gann Retracement tool (Retracement Levels tab) and switch off all but the 0%, 50% and 100% resistance levels. Save these settings as temporary defaults.
- This type of cluster largely resembles that of one of the case studies from our October 2018 monthly newsletter.
If successfully created, you will see the price cluster was a strong one, with exactly the same type of “symmetry” that Gann was referring to when he said you could make a fortune from trading the “half way point(s)” alone.
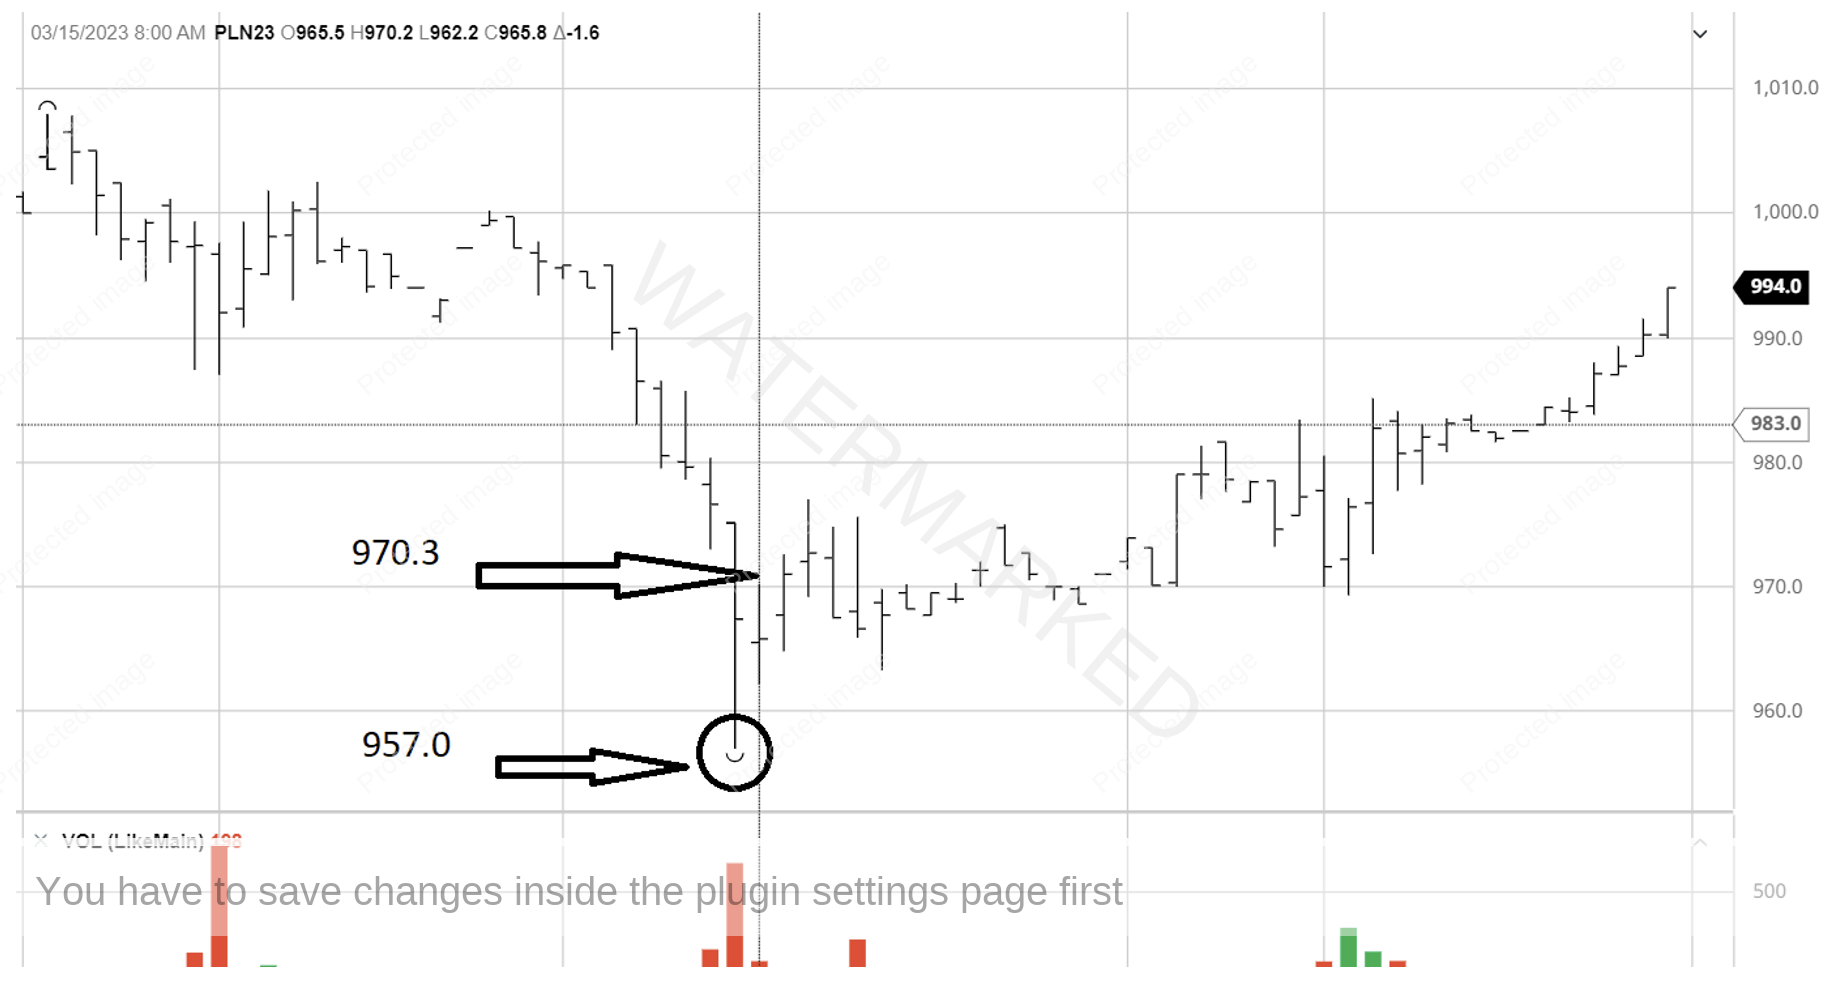
So with the market having reached what was a strong high quality price cluster, what about a trade? Usually the Platinum futures market rolls from its April contract to its July contract in the last week of March. Given that the trade we are about to consider came in mid-March, we will consider the entry offered by the July contract, which by mid-March was only rising in liquidity/volume even if a week or two off taking over the SpotV chart. Entering this contract was always going to potentially save that little extra logistical effort and cost of a contract rollover (which would have been necessary if initially instead entering the closer to expiry April contract in mid-March). Not only that, in the chart shown above, the low of US$953.00 was from the April contract but the low of the July contract was US$957.00 – just that little bit closer to the cluster itself.
Therefore, below is the 60-minute intra-day bar chart from barchart.com for the July 2023 contract with the US$957.00 low shown. The 9am (Central Time in the US) hourly trading bar was up, turning the hourly swing chart up. Taking this entry signal would have had you long Platinum at US$970.30 with an initial exit stop at US$956.90.
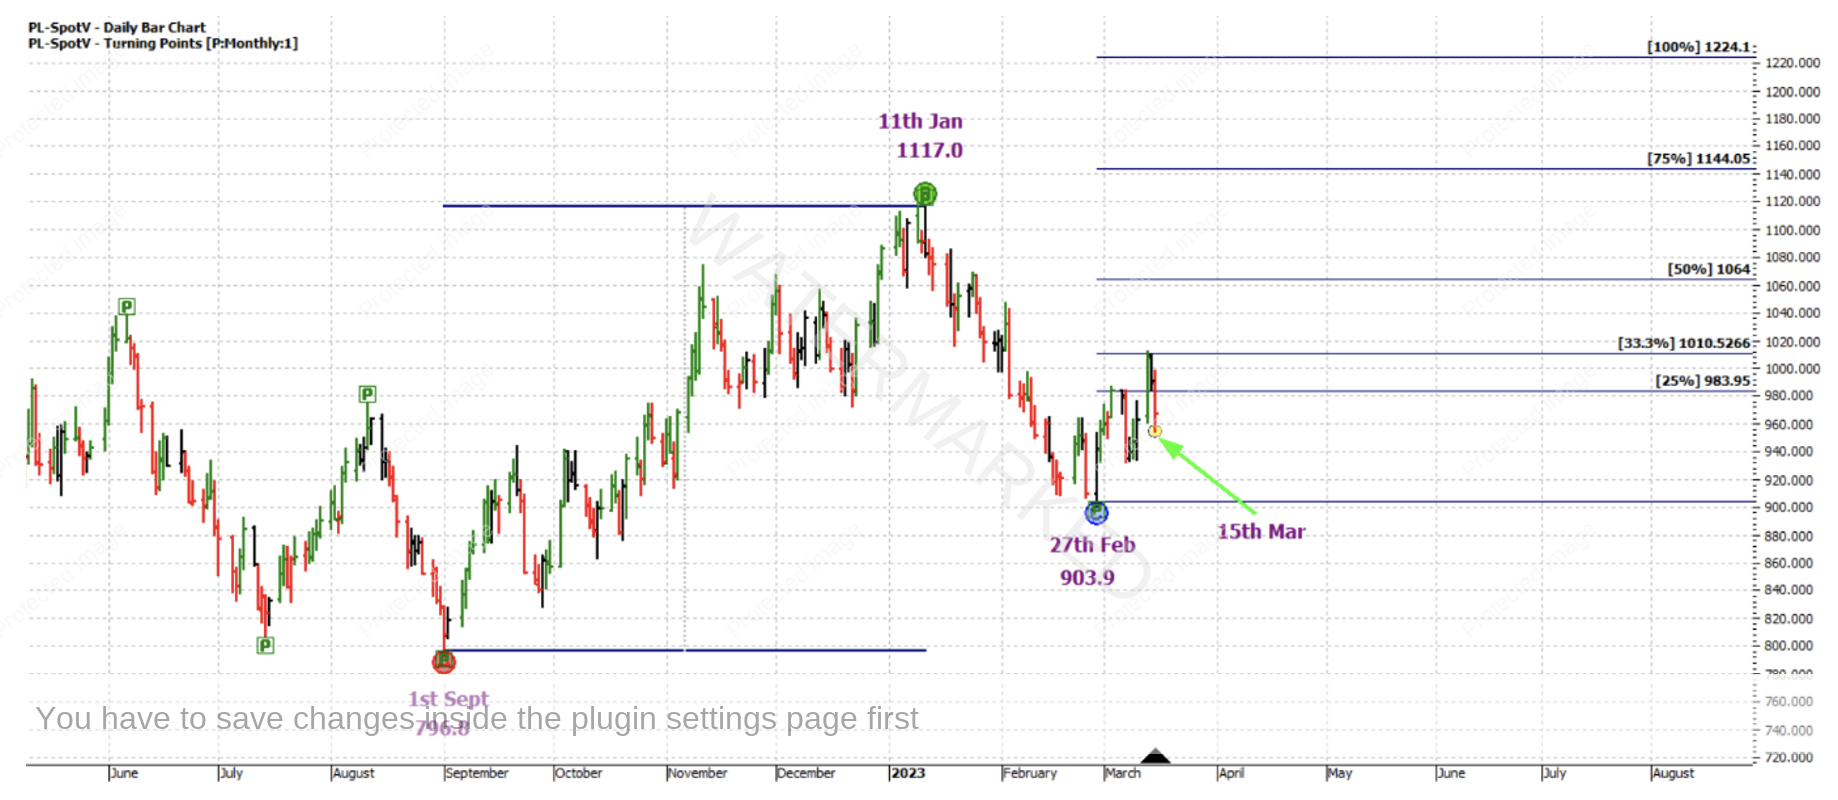
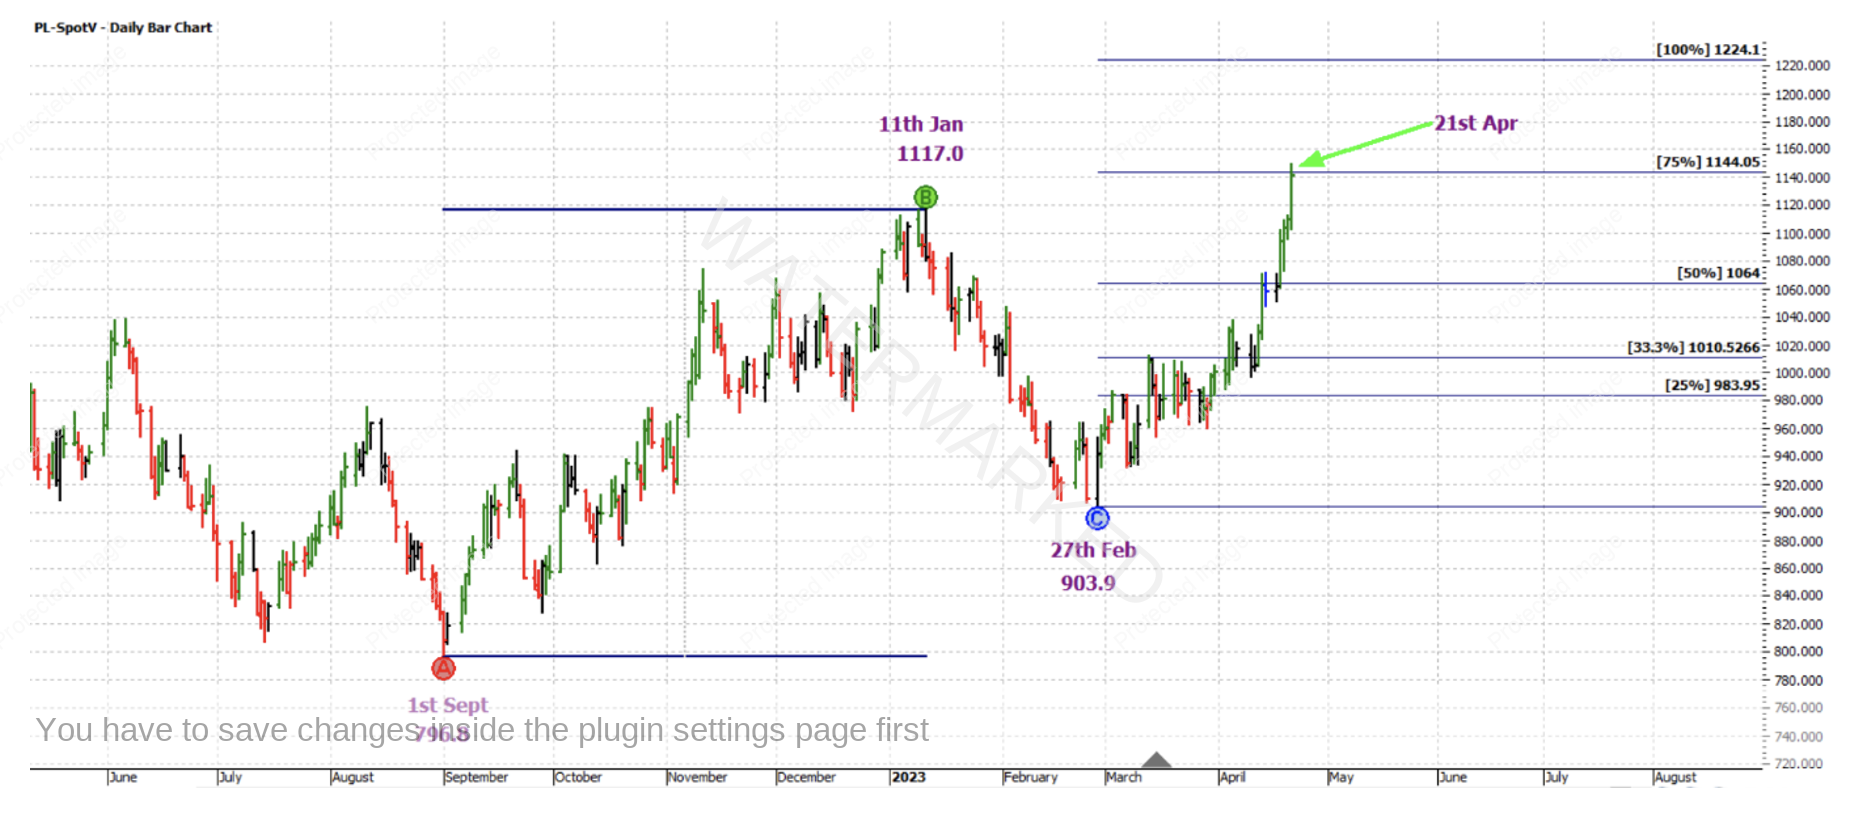
Back to ProfitSource, the reference range for the trade was the last monthly upswing. This is shown below, with Point A on the low of 1 September 2022, Point B on the high of 11 January 2023 and Point C on the low of 27 February 2023, all on the SpotV Chart.
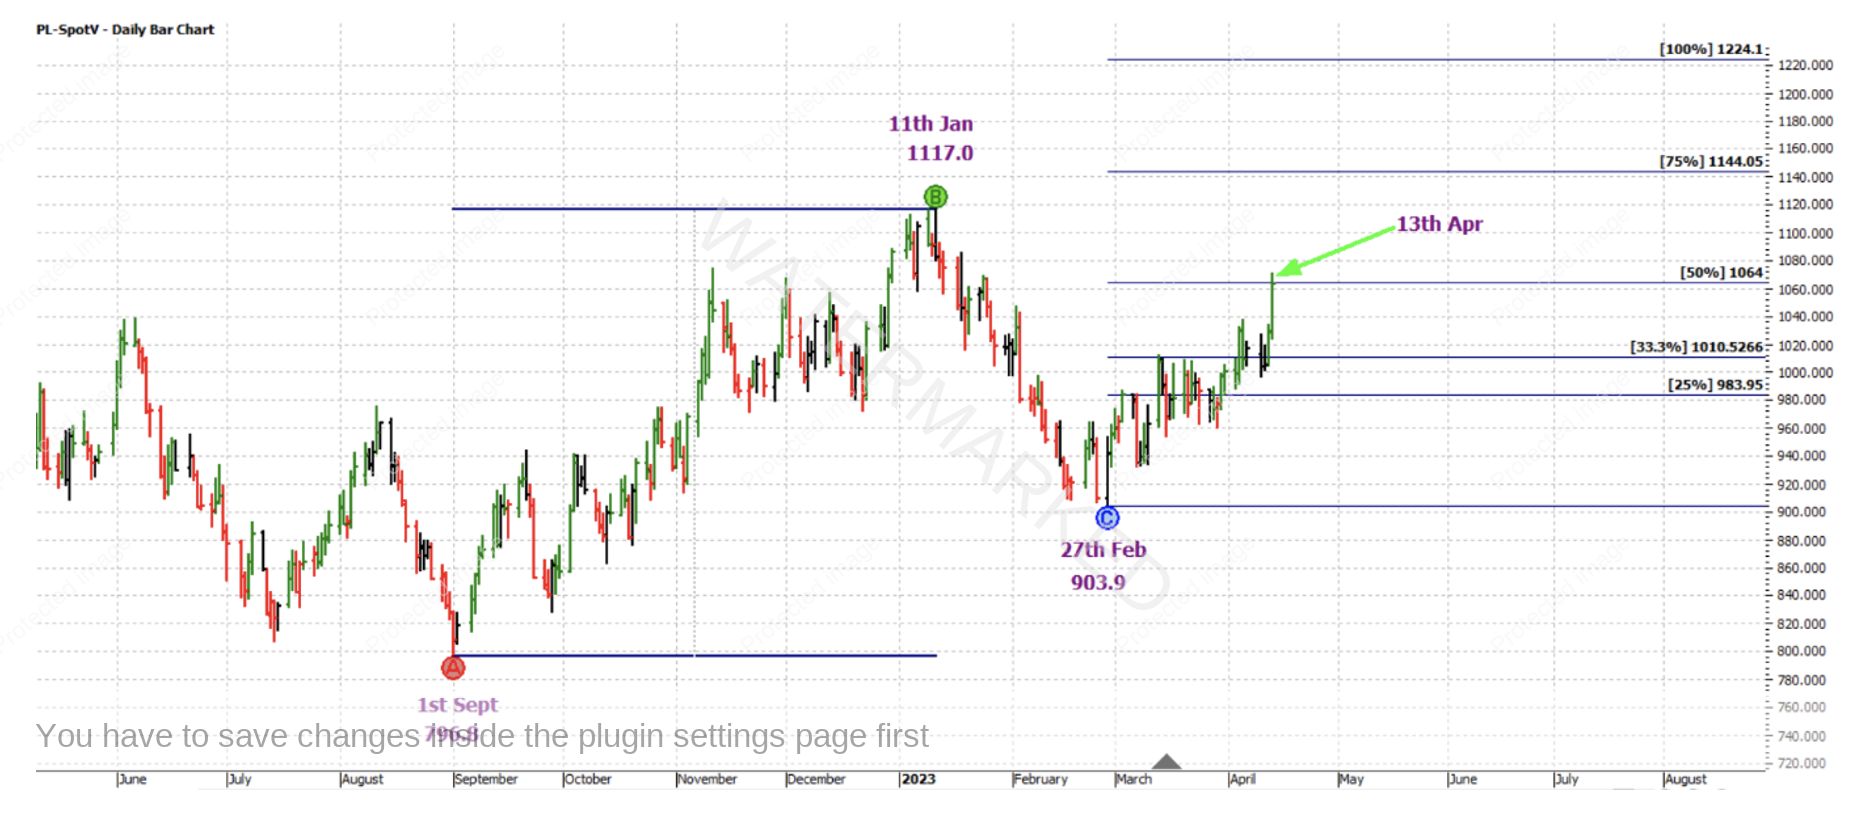
With stops managed “Stock Style”, when the market reached the 50% milestone on 13 April 2023, exit stops were moved to break even.
0n 21 April 2023, profit was taken when the market reached the 75% milestone of US$1,144.00.
Let’s now take a look at the rewards of this analysis and execution. Reward to Risk Ratio:
Initial Risk: US$970.30 – US$956.90 = US$13.40 = 134 points (point size is 0.1)
Reward: US$1144.0 – US$970.3 = US$173.70 = 1737 points
Reward to Risk Ratio = 1737/134 = approximately 13 to 1
Taking such an entry on the intra-day chart and trading a large chunk of the last monthly swing would normally be considered aggressive but remember with some good work on the analysis side, a strong price cluster was revealed.
Assuming that 2% of the account size was risked at trade entry, the gain in account size would be as follows:
13 x 2% = 26%
Each point of price movement changes the value of one Platinum futures contract by US$5.00. So in absolute USD terms the risk and reward for each contract of the trade is as follows:
Risk = US$5.00 x 134 = US$670
Reward = US$5.00 x 1737 = US$8,685
At the time of taking profit, in AUD terms this reward was approximately $12,905. This market is also accessible with much smaller position sizes by way of a CFD.
Work hard, work smart.
Andrew Baraniak
