Technical Setup – ANZ
It’s been a while since the Trading Tutors desk has contributed an article from anything other than the commodities sector, so this month let’s take a look at a stock – ANZ:ASX. And why not – all it takes is applying the same techniques in the same routine fashion. In particular, we’ll be examining a setup that occurred in this market in the second half of February of 2020.
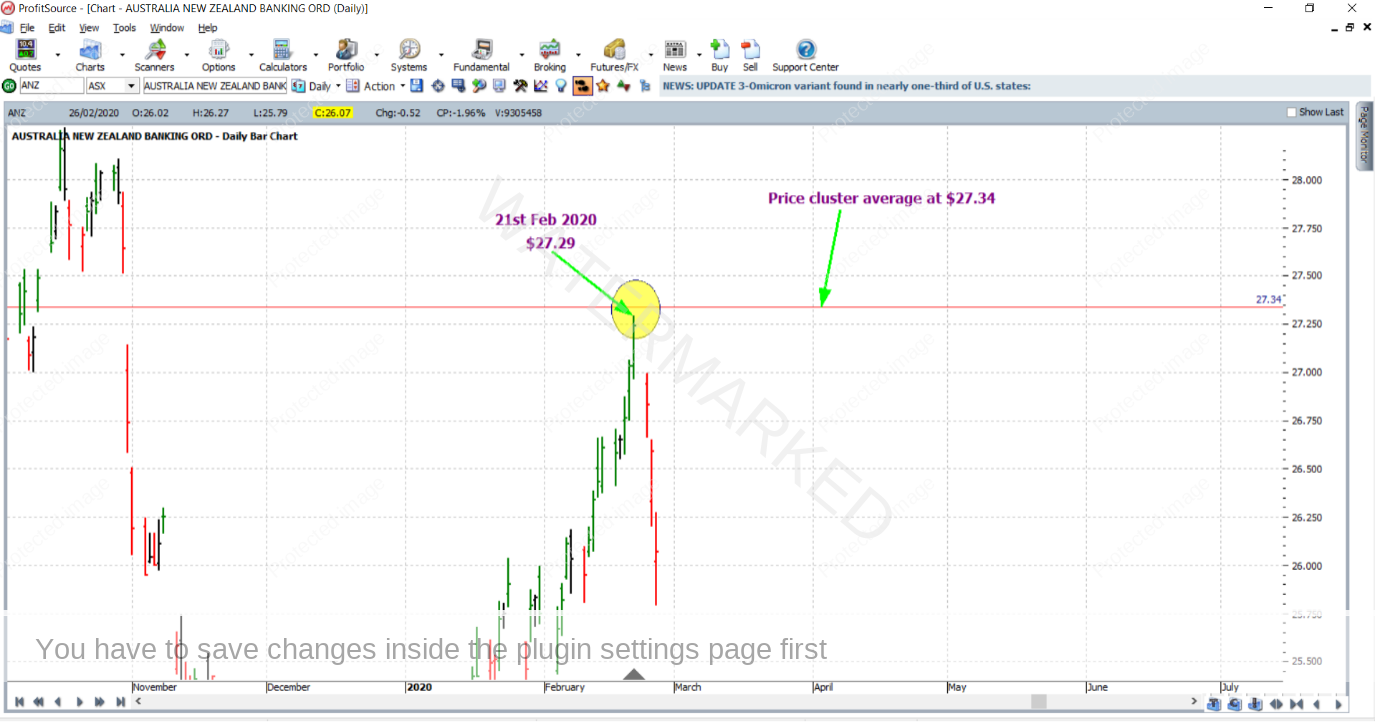
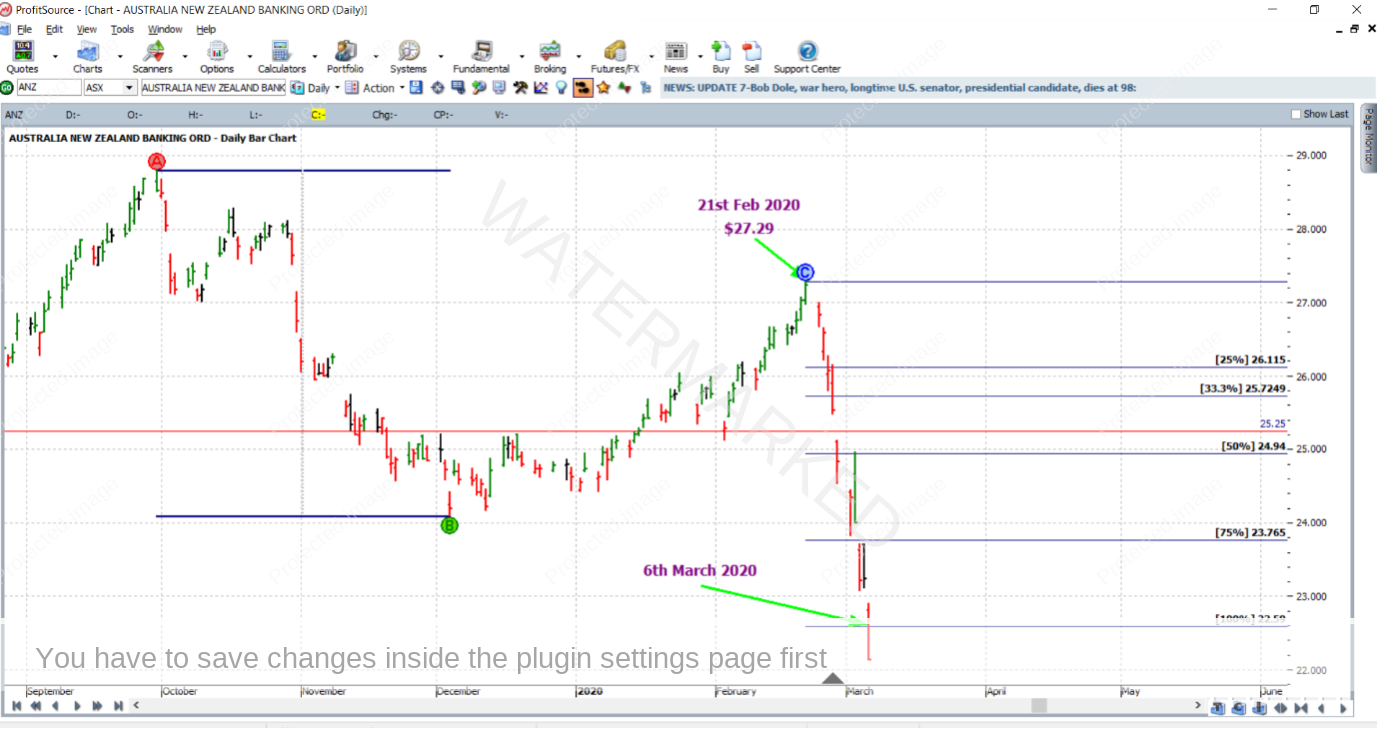
By mid-February of the same year, it was evident that four solid price reasons had clustered together at an average price of $27.34, giving us enough reason to look for a reversal, in this case to the downside. A very strong turning point did eventuate not far from this price cluster. The actual top came in at $27.29; 5 cents shy of the price cluster itself. This is illustrated in the ProfitSource chart below, and as you can see the 5 cents of error was relatively small in relation to the average size of a daily bar in this market.
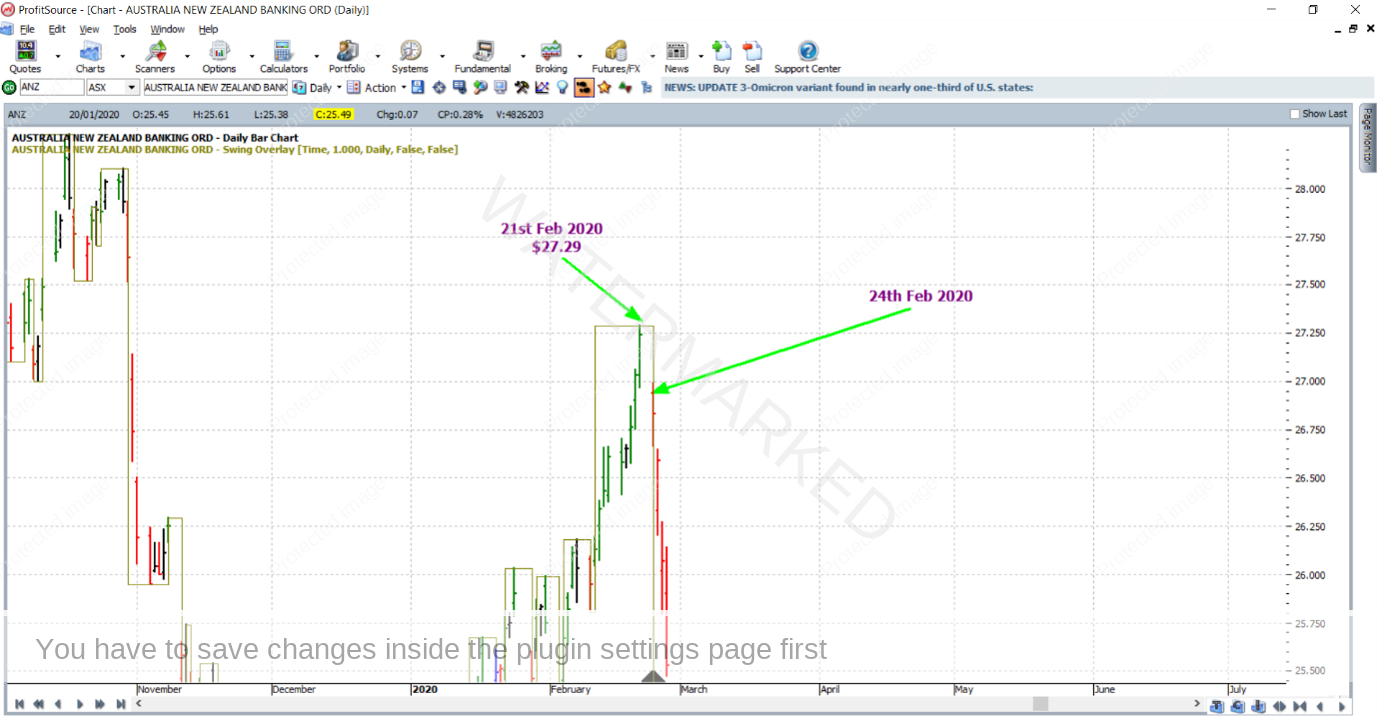
The price reasons for this trade were strong – they were based on key milestones and resistance levels from very significant turning points and price ranges. And the cluster was a fairly tight one, with the prices involved grouping together quite closely to one another. This justified one of the most, if not the most, aggressive entry signals that we use with an end-of-day chart – that at the turning of the daily swing chart. And this entry signal was triggered on the following down day which was Monday the 24th at $26.94, on market open.
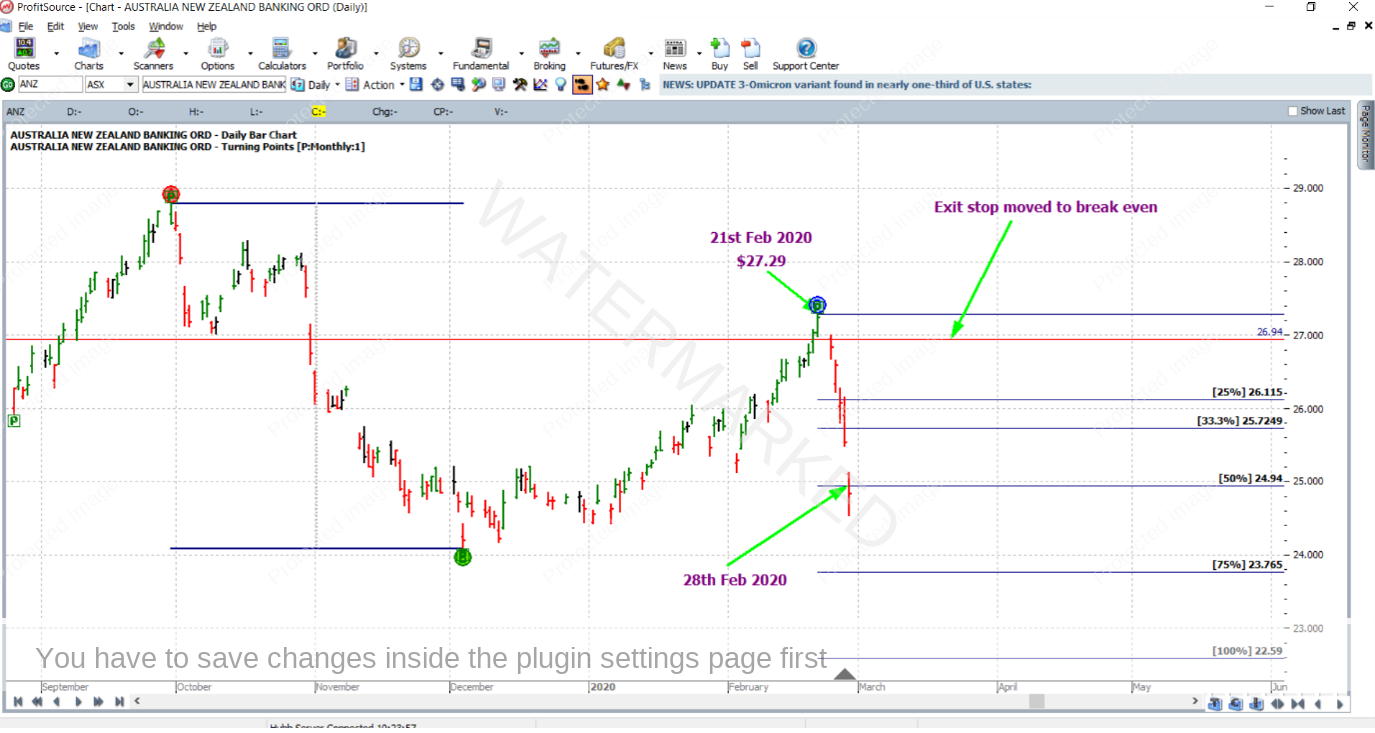
As for trade management and an exit target, let’s examine the outcome of using the last monthly swing in the same direction (in this case, of course, the last one down) as a reference range. Stops will be managed “Currency style” i.e. moved to break even when the 50% milestone is reached, and moved to lock in profit when the 75% milestone is reached.
As you can see this was a very fast run – on the 28th of February the market had already reached the 50% milestone with stops being moved to break even.
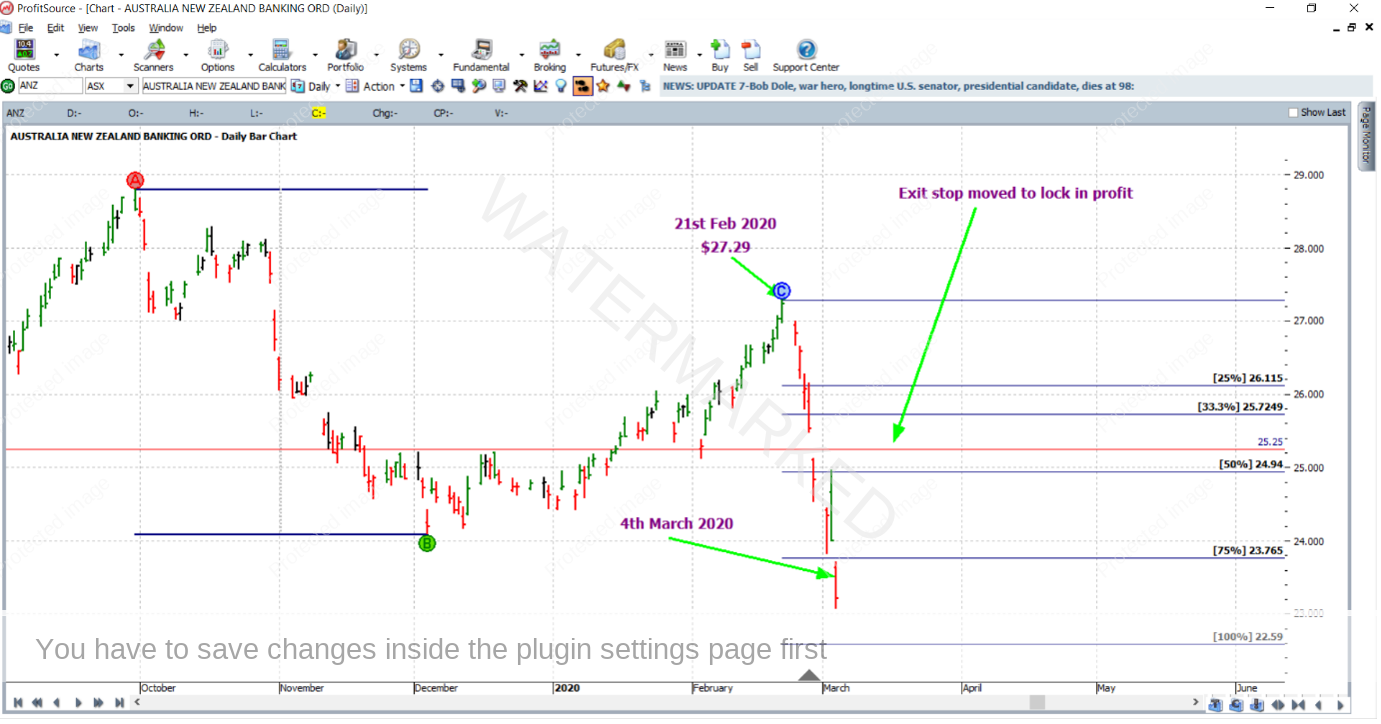
On the 4th of March, the market gapped down below the 75% milestone and the exit stop was moved to lock in some profit. This was done by placing the exit stop at 31 cents above the 50% milestone. The 31 cents was approximately one-third of the average weekly bar size at the time, based on the last 60 weekly bars.
And it was definitely a fast run. Only two days later the market reached the 100% milestone on the 6th of March.
Now for a few different perspectives on the reward. In terms of the reward to risk ratio:
Initial risk: 27.30 – 26.94 = 0.36 = 36 points (point size is 0.01)
Reward: 26.94 – 22.59 = 4.35 = 435 points
Reward to Risk Ratio = 435/36 = approximately 12.1 to 1
In percentage terms, let’s assume that 5% of the account size was risked at entry. This would have the gain in account size calculated as follows:
12.1 x 5% = 60.5%
In absolute dollar terms, assuming that 5% of a $10,000 account was risked, i.e. $500, the reward would be:
12.1 x $500 = $6,050
Work Hard, work smart.
Andrew Baraniak
