Tesla Breakout
When it comes to technical analysis, there are many ways to analyse markets and of course there are grades of complexity that can be measured from the easy end to the most complicated. There is no extra reward provided in monetary value if our analysis is more complicated to get the same result.
Today we’re going to try and keep it simple and explore breakout setups. A breakout setup essentially takes place when a congested market breaks out of its sideways pattern with an explosive move. In many ways it’s like a coiled spring being let go, the challenge is to know which way it will breakout, this can be analysed to lessen the risks by understanding the patterns and then of course mitigating risk by using a stop loss.
Tesla is a market that we have followed in our coaching program this year, in numerous ways it’s not really linked to underlying fundamentals but more due to the personality of its founder and of course the tech related boom that has lifted many stocks in that sector.
Chart 1 shows the recent movement of price as the sideways pattern has moved closer to the 50% level from the 2024 high to the April low this year. There is a second retracement applied to the May – June range and we can see the rising bottoms above 50% in recent times (blue line) compressing into the larger 50% (orange line).
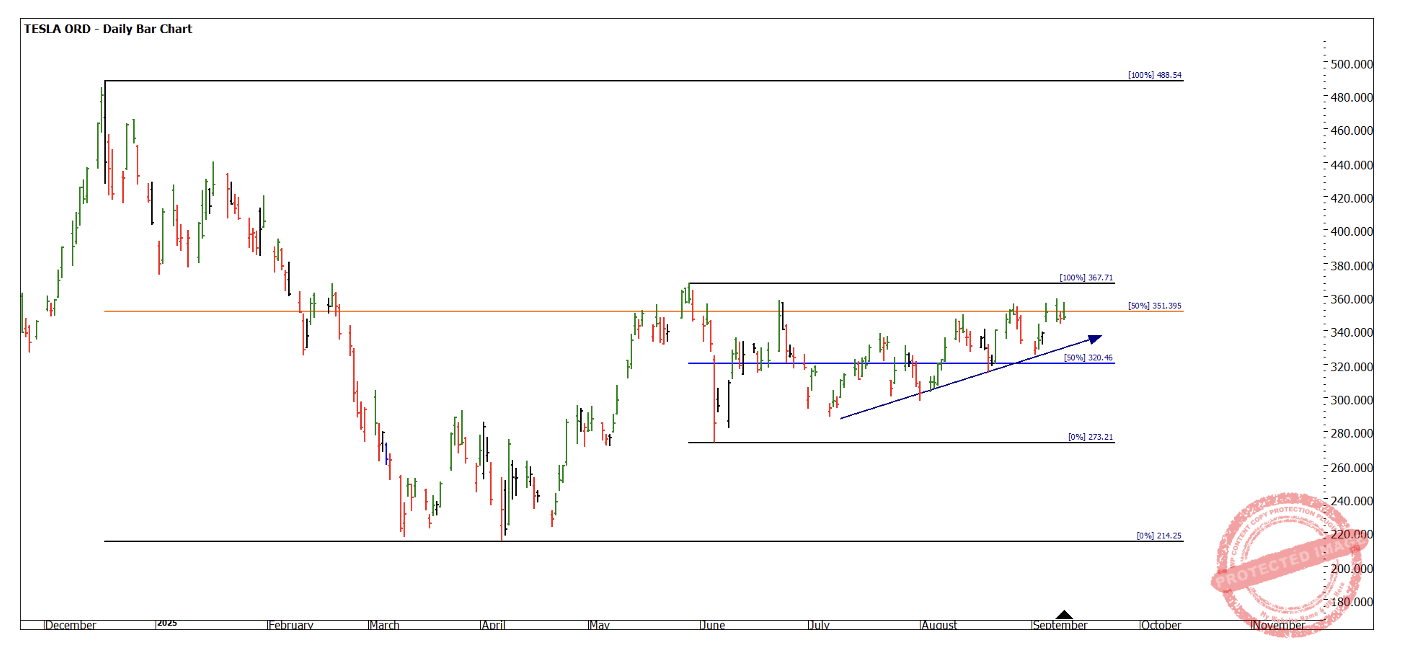
Chart 1 – Daily Bar Chart TSLA
Stepping back and applying a 2-day swing chart to the price action helps remove a small amount of noise and chop. This allows for a better understanding of the trend.
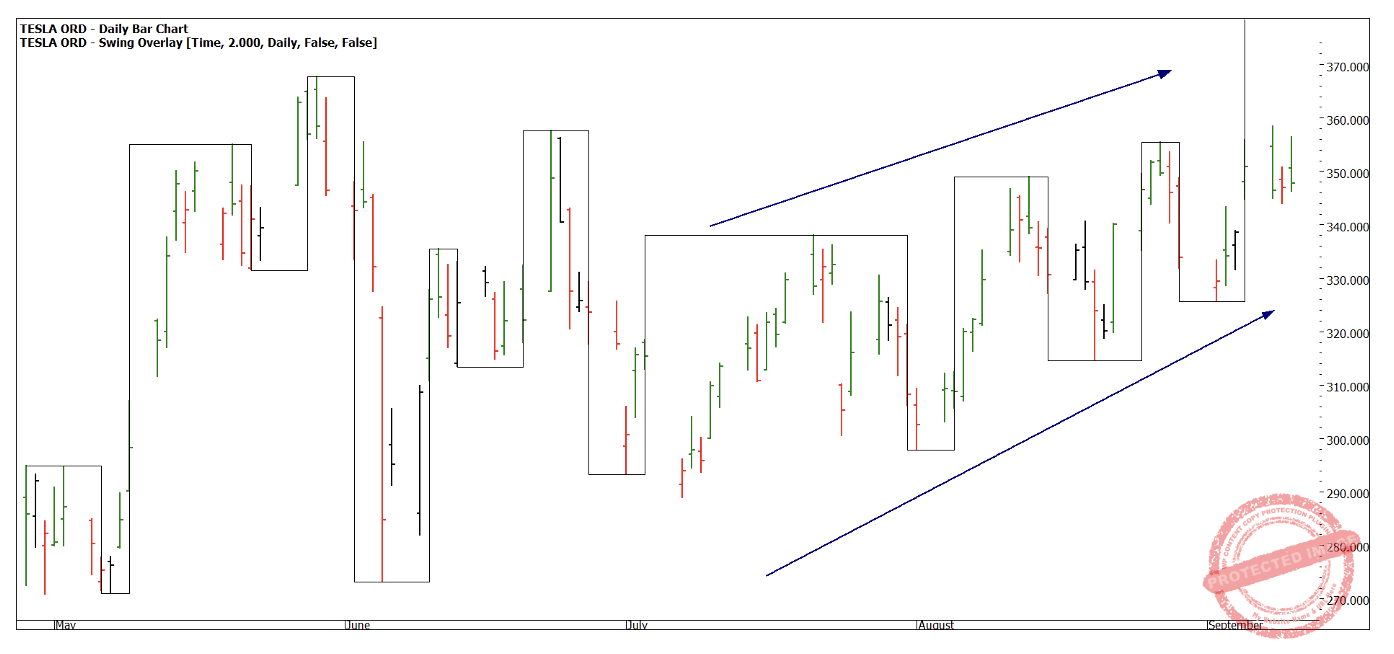
Chart 2 – Daily Bar Chart TSLA
The swing overlay allows us to confirm higher tops and bottoms into the previously listed 50% level. The challenge for these types of setups (which we learnt in the Number One Trading Plan ) as with breaking of multiple bar chart tops (and bottoms), is do we wait for confirmation of the market move or do we get set prior to the move to capture what can be a large jump?
This is very much a personal choice, as there are pros and cons with either method. Chart 3 shows us this when we apply the ABC points on the bar chart. We can see there has been a number of ABC points highlighted in the sideways move, some have worked and others not, so this is the balance I have mentioned above, I do note the most recent ABC moving into the resistance at $360.
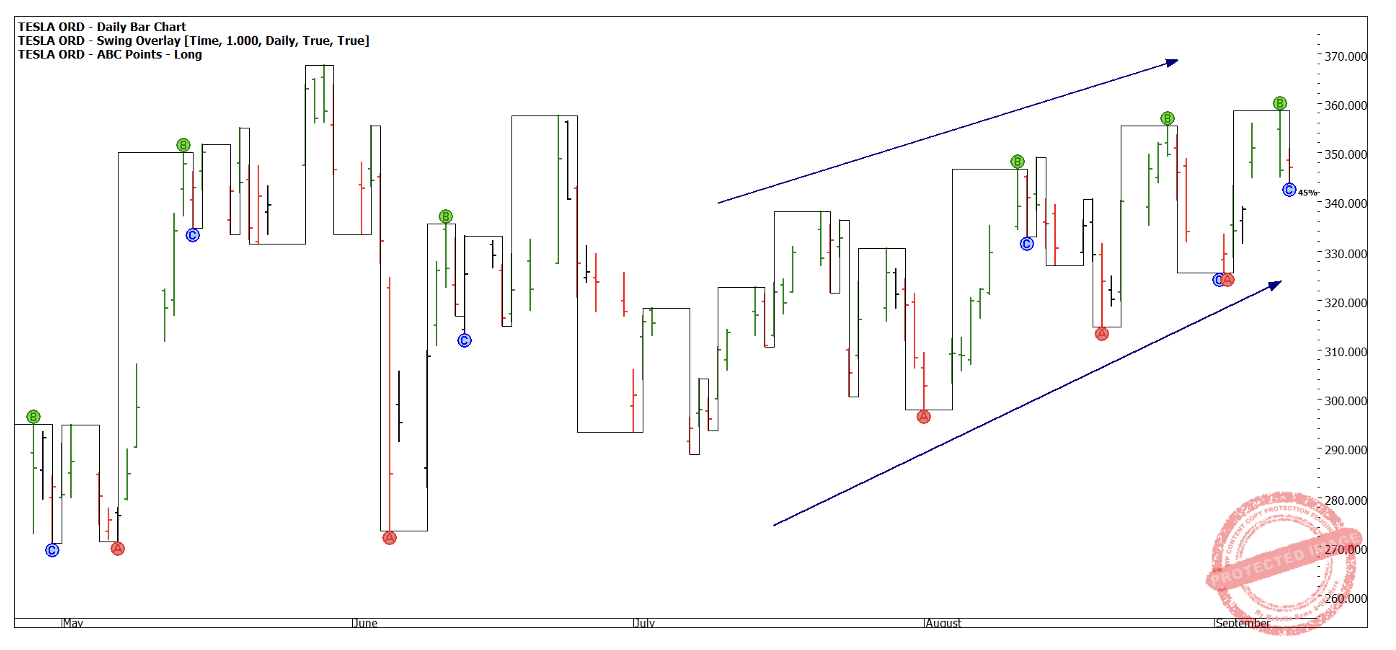
Chart 3 – Daily Bar Chart TSLA
If we bring the chart to current date, we can see now the breakout has seen an acceleration of price through the $360 and the last session closed at $410 with a high of $425. A $65 move in a handful of trading sessions.
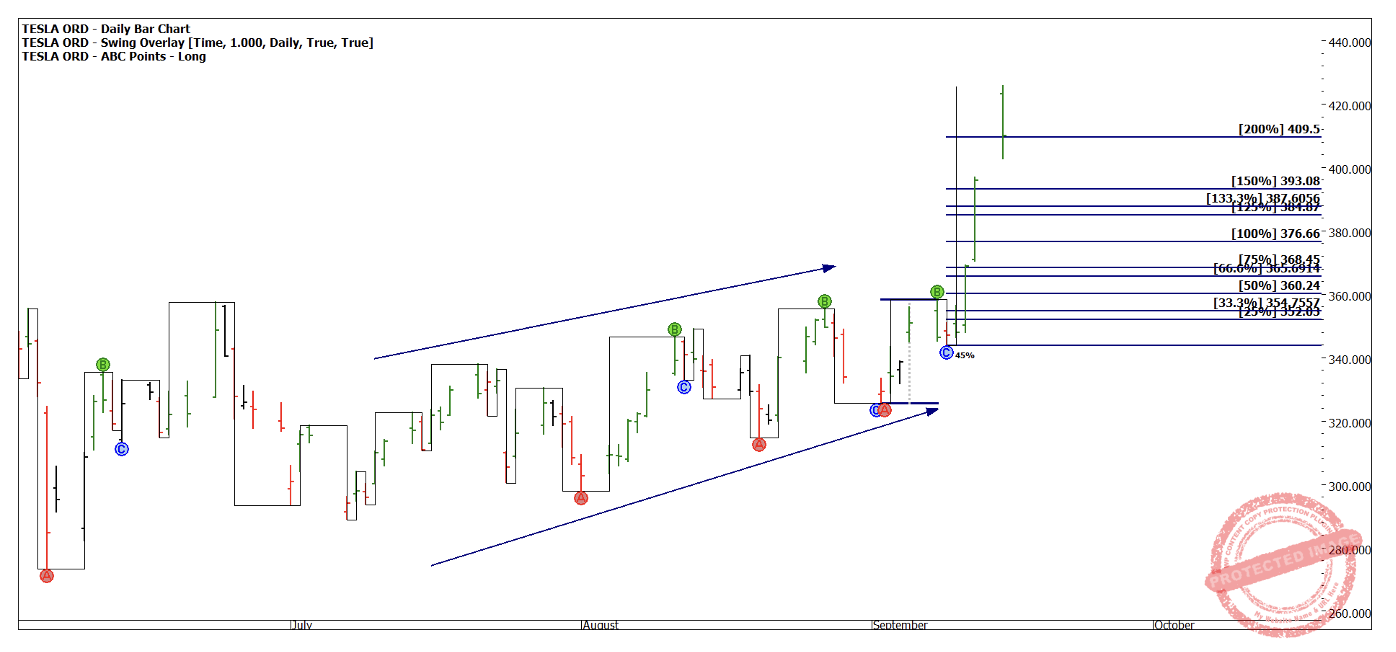
Chart 4 – Daily Bar Chart TSLA
The sharp acceleration has drawn out buyers into the breakout scenario. We must now continue to analyse if there is sustained momentum or if the move is short and sharp. The next chart steps out how to use the previous bigger ranges as a guide. The 50% of the major range grabs the current price action at approximately $407, this will be a good guide to understanding what’s next.
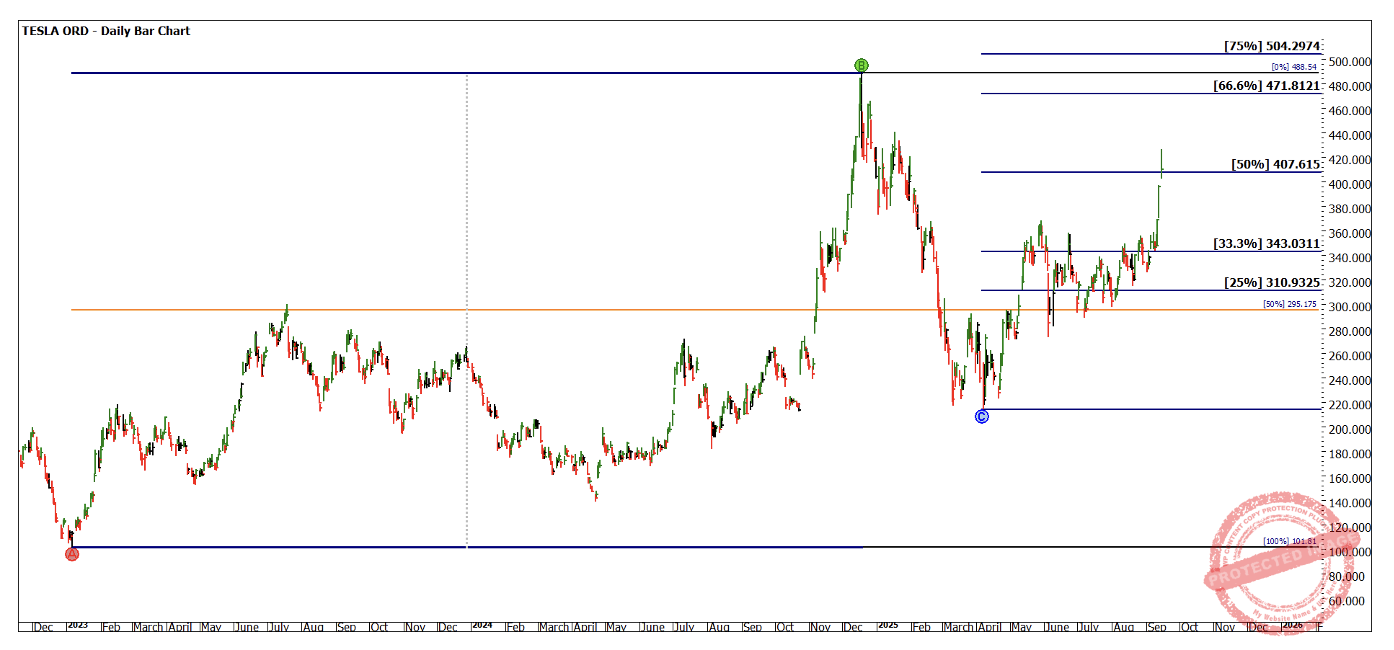
Chart 5 – Daily Bar Chart TSLA
Where we may see support and resistance is in a Lows Resistance Card as discussed in our Active Trader Program coaching session last week. The 2023 low and its multiples have been a reliable endeavour thus far, so see if you can put together this Lows Resistance Card and plot where we might find some pressure points going forward. This could be saved as a separate chart or used as an overlay of your bar and swing charts.
After such an explosive move we now have the volatility component for the requirements of a Classic Gann Setup. There may yet be more movement to come in Tesla.
Good Trading
Aaron Lynch