Tesla Time
Having spent a considerable time in markets I have researched, reviewed, tested and filed many methods to trade. There is no significant barrier to entry when looking at trading, a funded account is really the only bar that needs to be cleared. As we develop and become exposed to the methods to analyse (especially in the technical analysis space) we come to understand that there are some methods that resonate with us and others we part easily with.
The concept of time and timing markets is often disregarded by the wider community as not possible and certainly a course of study that should be avoided. We take a different view but struggle with the steep climb to master the variables as we are searching for what is hidden in plain sight. This is framed by the fact that even when we align cycles into a pressure date, we then must wait for confirmation and trade it effectively and with a disciplined trading plan. There must be a better way.
The basis of why we look for clusters in price and time is to ideally identify turning points to enable a larger reward to risk ratio. Overall, we want high probability turning points that we can then apply risk management around. Once we have done that, we are in the hands of the market to see what comes from it.
Tesla as a stock has been one I have been following this year as part of our coaching group. It has proven to be an interesting and challenging market and has not always proven easy to get set and hold positions in. The aspect of time has been helpful in understanding where price may change direction.
The seasonal date in September was initially one to watch and I also nominated late in the month around the 29th as being a date to watch. Chart 1 shows the big picture weekly chart and the 144-cycle suggesting we are in the ballpark for our cycles to repeat.
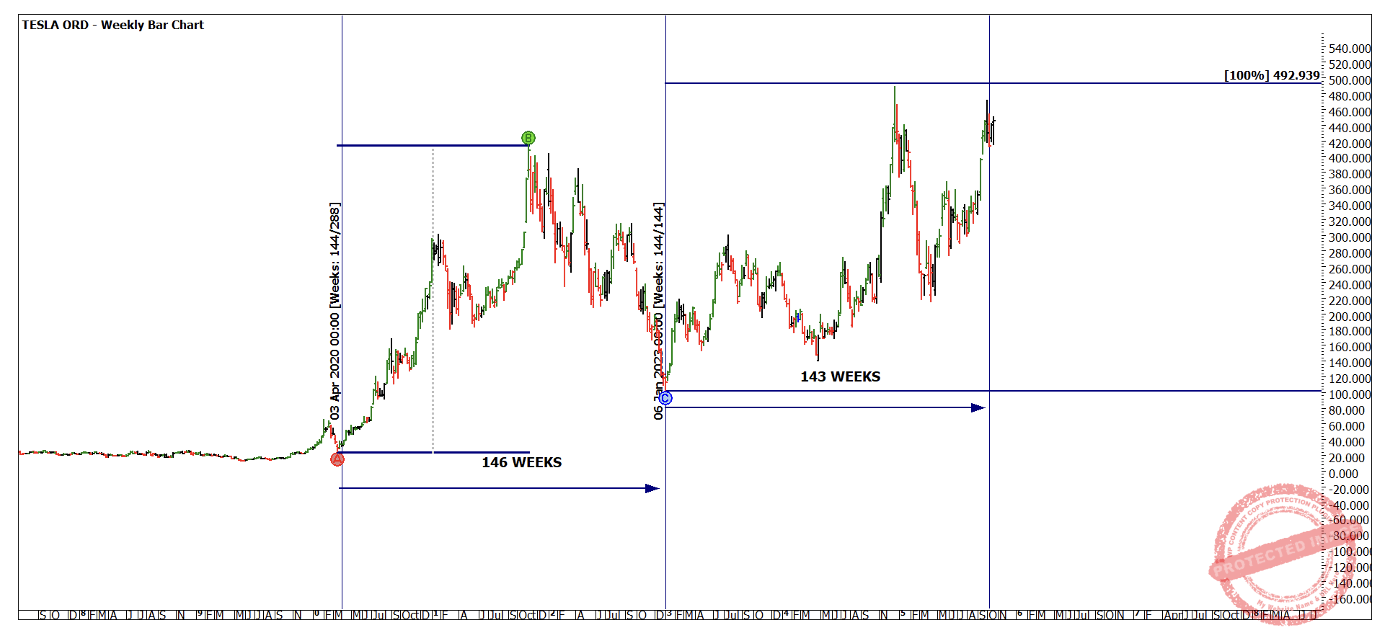
Chart 1 – Weekly Bar Chart TSLA
The price action has shown us we have come close but not yet hit the 100% price range. Ideally this price and time would have landed together but we are seeking results not perfection.
Chart 2 shows several other areas in history where 144 weeks has delivered some smaller turns. This is an area you will need to test for yourself.
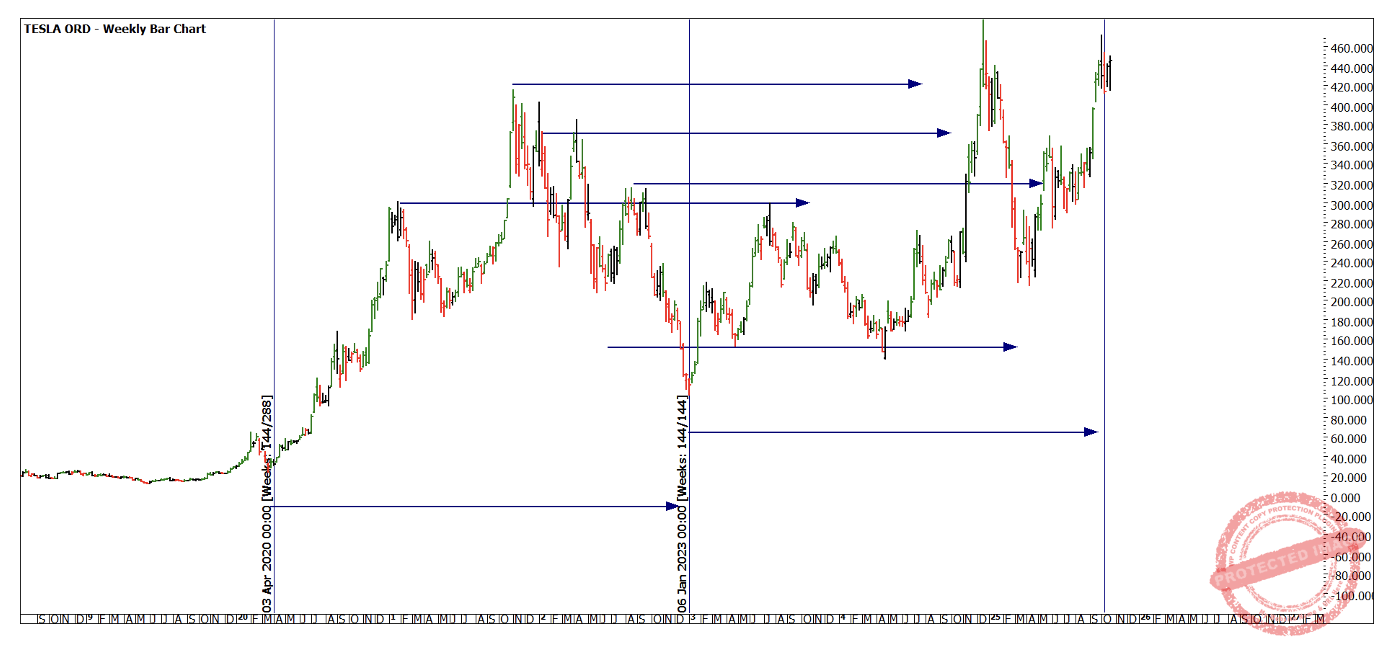
Chart 2 – Weekly Bar Chart TSLA
Using the same idea of analysis and reducing the time frame to days we see where 144, 72 and 288 all deliver some repetition in either calendar or trading days in the most recent price action.
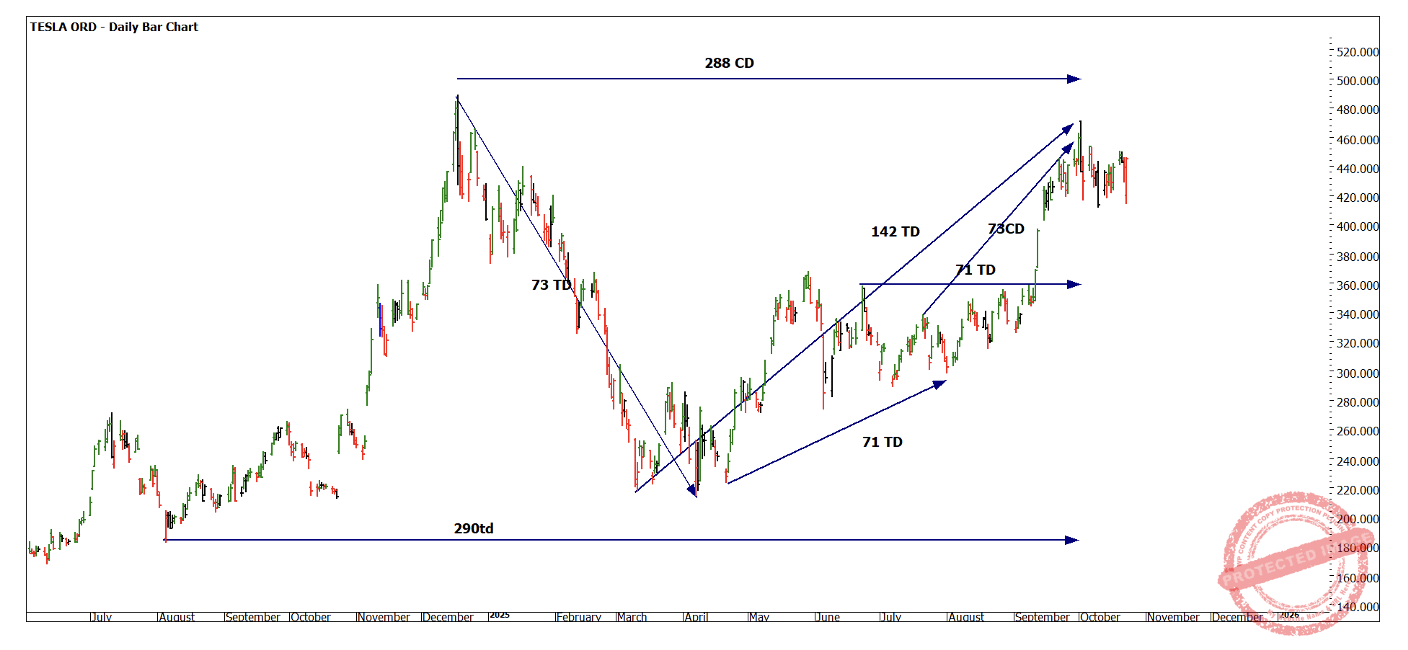
Chart 3 – Daily Bar Chart TSLA
We see a similar pattern as we head into the intraday patterns where the chart below on the 4-hour bars align in a similar way. When we discuss the Wheels Within Wheels concept this is a good example of big picture all the way down to small picture aligning.
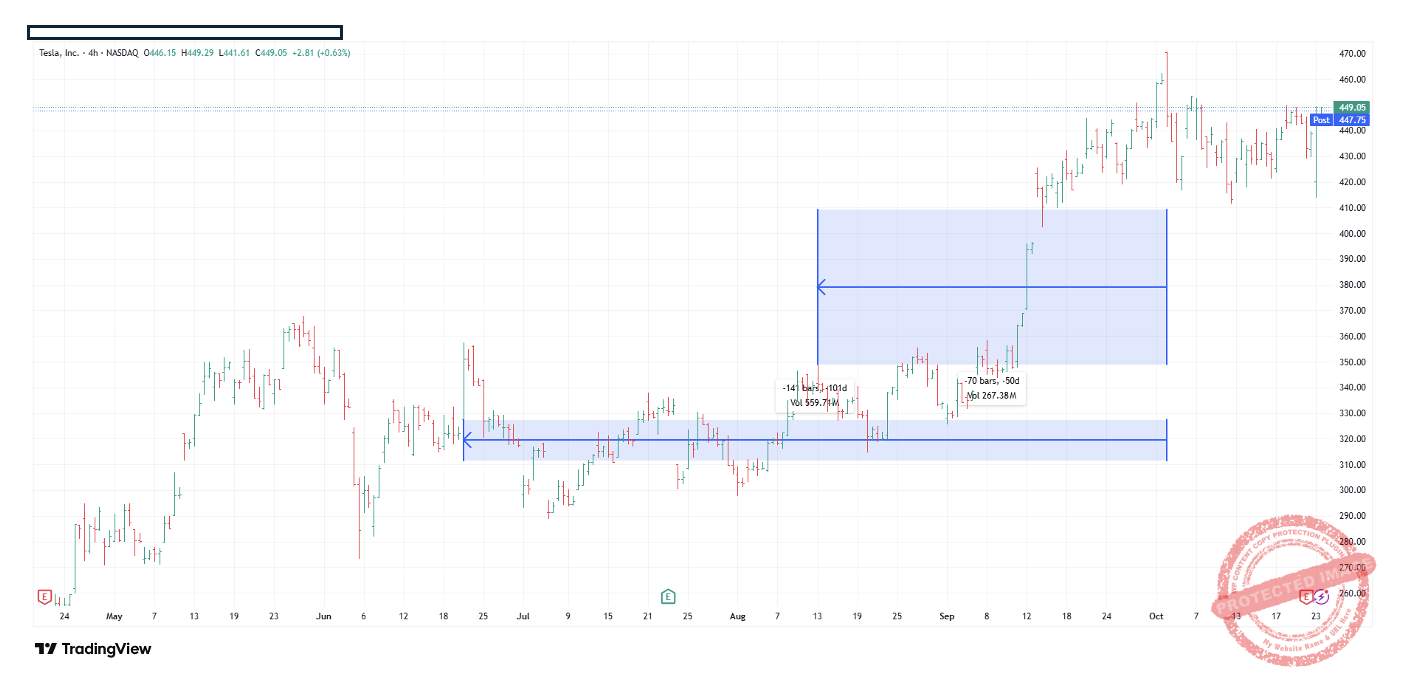
Chart 4 – 4-hour Bar Chart TSLA
This alone as we know is not enough to be profitable. Chart 5 shows how the price action has shown positive signs of moving lower, only to be followed up with a strong reversal.
Chart 5 brings us up to date with the current picture, we have seen the first lower swing form, on the 2-day chart with a strong close on relatively low volume.
This highlights the value of our trading element over the forecasting one. The turning point may be proven to be a top or not, but we must be able to trade the movement from it in such a way to benefit if it does move away. These are the times we are tested most as traders.
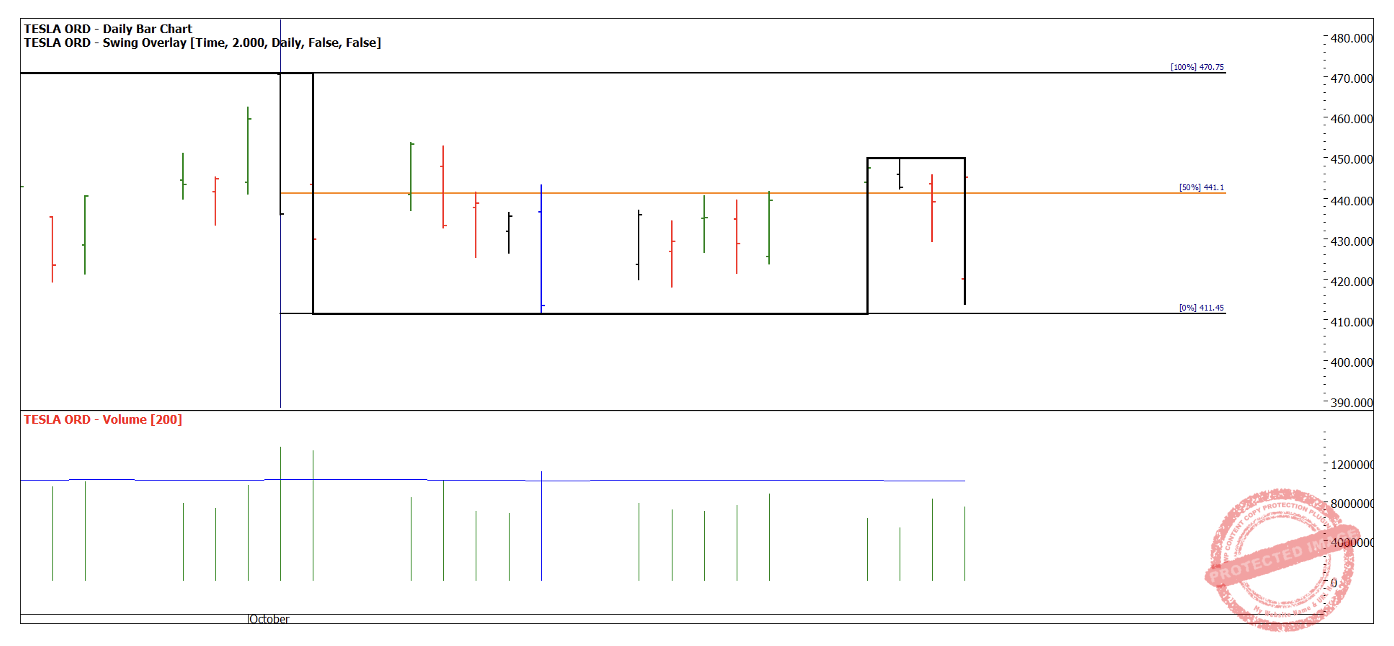
Chart 5 – Daily Bar Chart TSLA
The 50% retracement of the 2-day swing range down has acted as resistance but with today’s close above we must form read what occurs from here to understand what may be next.
Good Trading
Aaron Lynch