Testing, Testing, Testing
The original trading method David Bowden teaches us in the Smarter Starter Pack is a mechanical ABC trading system. In the Number One Trading Plan, there are advanced filters designed to increase the probability of making a profitable trade.
A great question to ask yourself is, what is the probability of success of any techniques that you use?
I wanted to know for the SPI200 how many weekly swing ranges get to 200% of the previous swing range in that direction, in one move. It’s simple to test as the guidelines are clear.
Since 1 January 2014, there have been:
- 225 completed individual weekly swings.
- 27 swings (or 12%) hit the 200% milestone of the previous range in one swing.
- Of the 27 swings, 18 were an Overbalance in Price swing (or pull backs against the main trend), and 9 were continuation swings.
An example of what I define as a Continuation swing and Overbalance in Price swing is shown below in Chart 1.
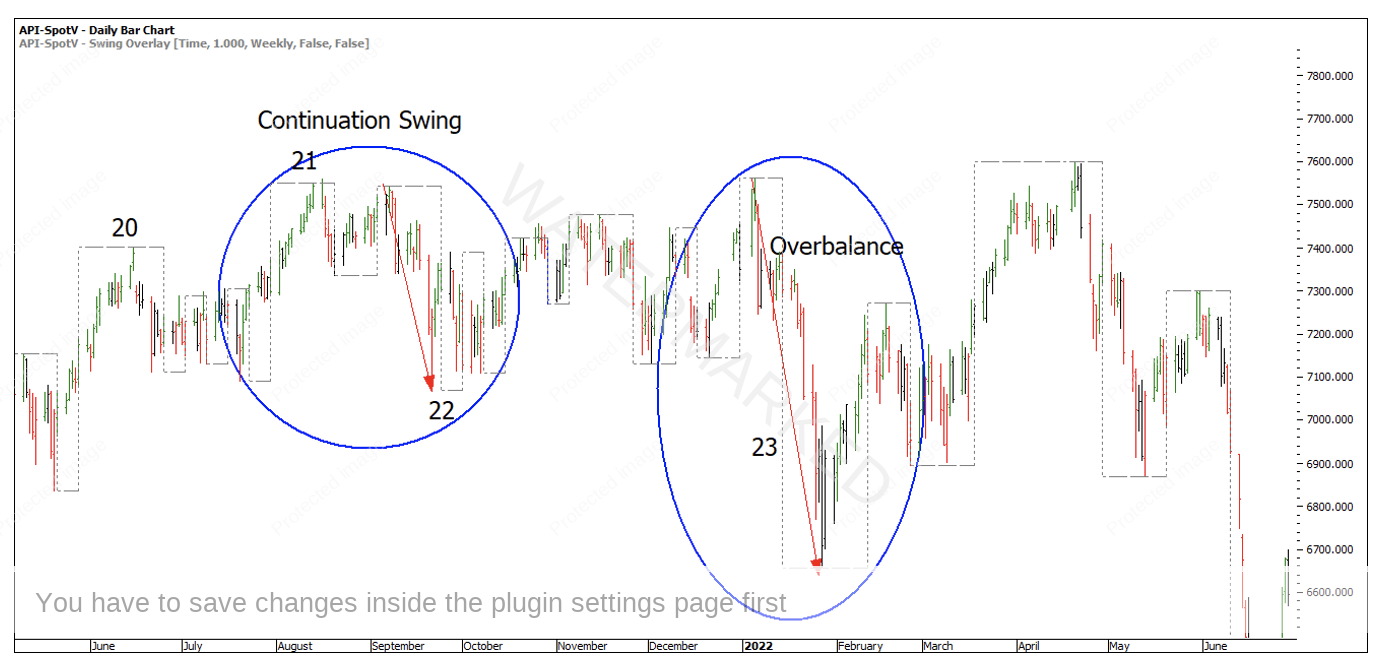
Chart 1 – Defined Swing Types
This means that only 4% of continuation swings get to 200% in one swing range.
I was surprised, I thought this number would be higher or maybe I just hoped it would be higher! But this is extremely valuable information to know how far a move will go before the next pullback and whether you want to sit through that if holding a position.
Let’s look at some other stats. Of the continuation swing ranges only three made it to 225% and only two made it to 250% and zero made it to 300% or further. That means in nearly 11 years:
- 1.3% of weekly swings make it to 225% in one hit and,
- 0.8% of weekly swings make it to 250% in one hit.
These numbers seem so low it feels a bit deflating! Although, what about the flip side??
Continuation swing results:
If the swing hits 200% of the previous weekly swing range in one move, there is 44% probability the market will give you a weekly turn.
If the swing hits 225% of the previous weekly swing range in one move, there is a 78% probability the market will give you a weekly turn. Now we’re talking good probabilities in a trader’s favour!
If the swing hits 250% of the previous weekly swing range in one move there’s nearly a 100% probability (according to the stats over the past 10 years) that the market will give you a weekly turn.
Overbalance in Price swing results:
If an Overbalance in Price hits 250% in one move there is a 61% chance of a weekly turn. If the Overbalance in Price hits 300% in one move there is a 78% chance of a weekly turn!
I know this is really numbers heavy, but these kinds of statistics mean you learn about your market, and it helps reduce the emotion.
In previous testing I also found that:
On a three-day swing chart, 83% of Overbalance in Price swings, without an overbalance in Time, ended up being a pull back and DID NOT result in a change in trend.
Let’s have a quick look at an example of where this might help from a setup perspective.
12 November 2018, the SPI200 showed a weekly pull back or Overbalance in Price at 250% of the previous swing range in that direction. I now know from the above stats that there is a 61% probability that 250% is the end of the move.
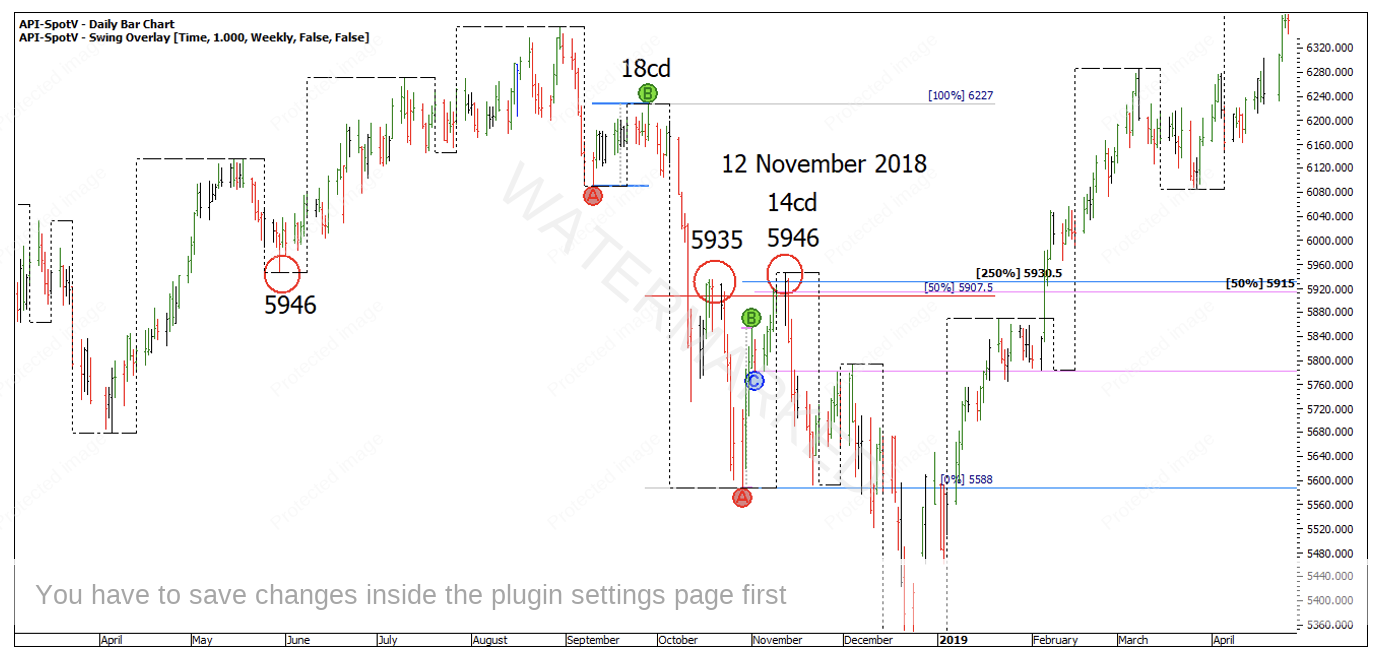
Chart 2 – SPI200 Setup
The weekly and three-day swing is the same here and as you can see it was an Overbalance in Price but not an Overbalance in Time! I also know from the above statistic that means there is a 83% chance that this move is just a pullback against the main trend.
Now adding in some Price Forecasting and form reading, there is a false break double top on 50% of the weekly range.
- 50% weekly swing range = 5,905
- 50% of the daily First Range Out = 5,915
- 250% previous swing range = 5,930.5
- 2 day swing top = 5935
- False break double top by 11 points
- Contracting 3rd daily swing range into 5,946
- Old low = 5,946
In summary, we have a Price Forecasting setup backed by high probability swing chart analysis that resulted in a good tradeable move. However, you would need to do your own testing on your own market to help formulate your own probabilities.
Happy Trading,
Gus Hingeley