The Average Range
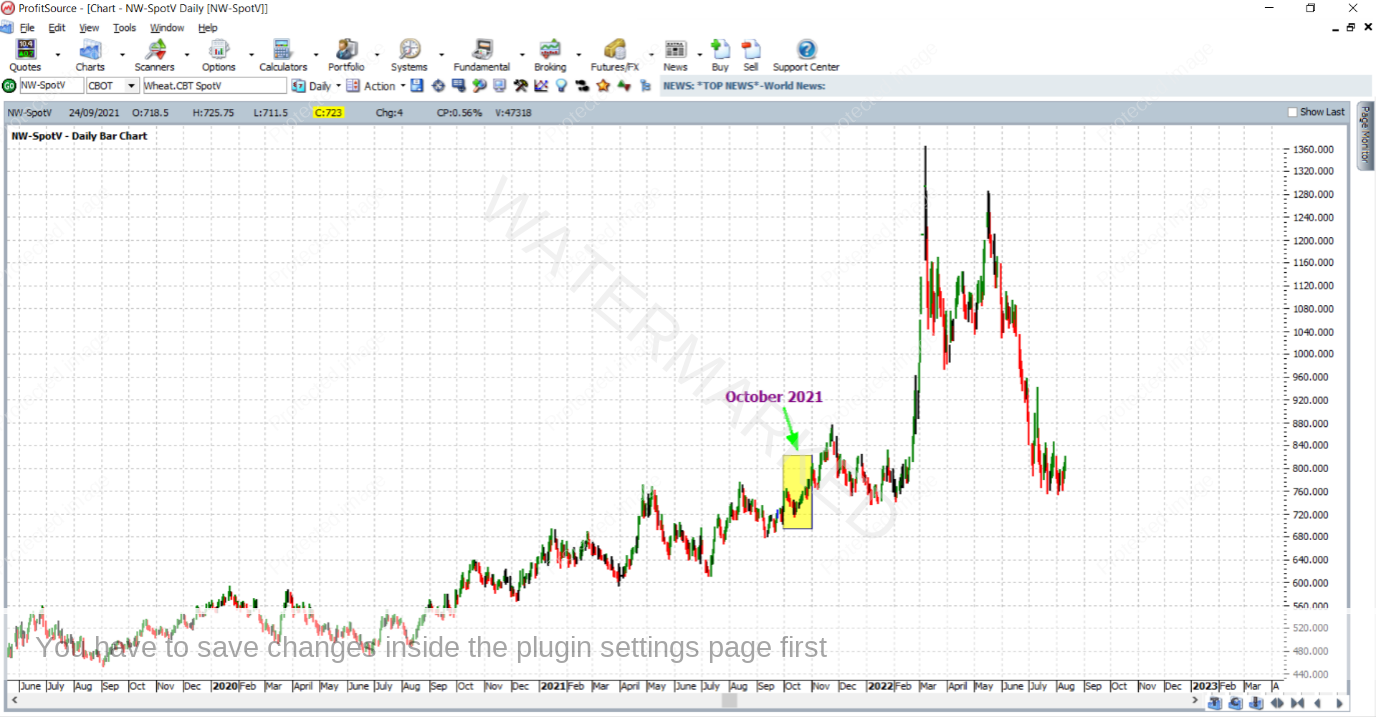
This month I’d like to look at the average trading bar sizes in the Wheat futures market. Before taking a look at a recent trade, there is some useful information to consider. Below is a screenshot of the said market (chart symbol NW-SpotV in ProfitSource), with the last few year’s worth of data. Highlighted in yellow is a fairly typical period of tradeable market action, that of October 2021.
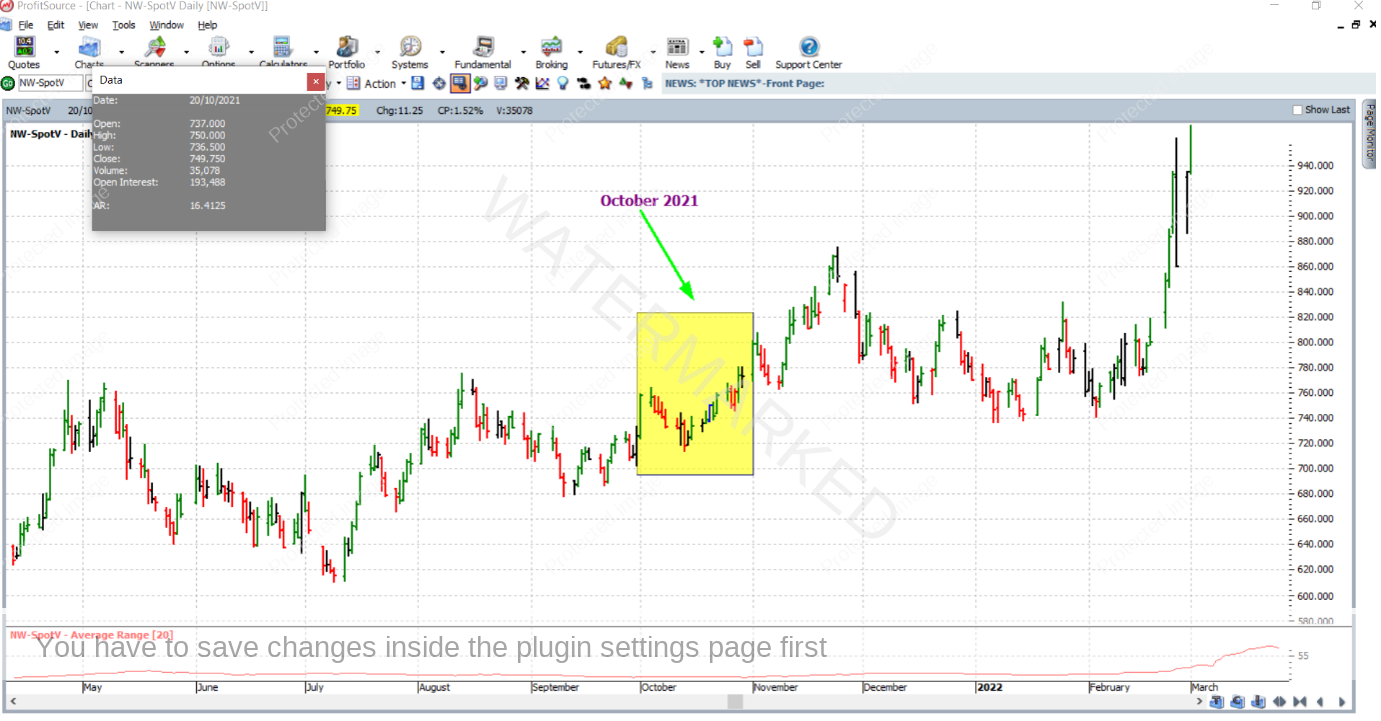
Let’s consider the average size of a daily bar from the above bar chart during the period highlighted. To do this, you can apply the Average Range indicator (“AR” in ProfitSource’s Indicators tool box). With the “Periods” setting of this indicator set to “20” we get the average daily bar size for the 20 trading bars up to and including the day to which the indicator is applied. If we apply it to 20 October 2021 we get roughly 16.50 cents as the average daily bar size for the first 20 days of last October. This is shown in the chart below.
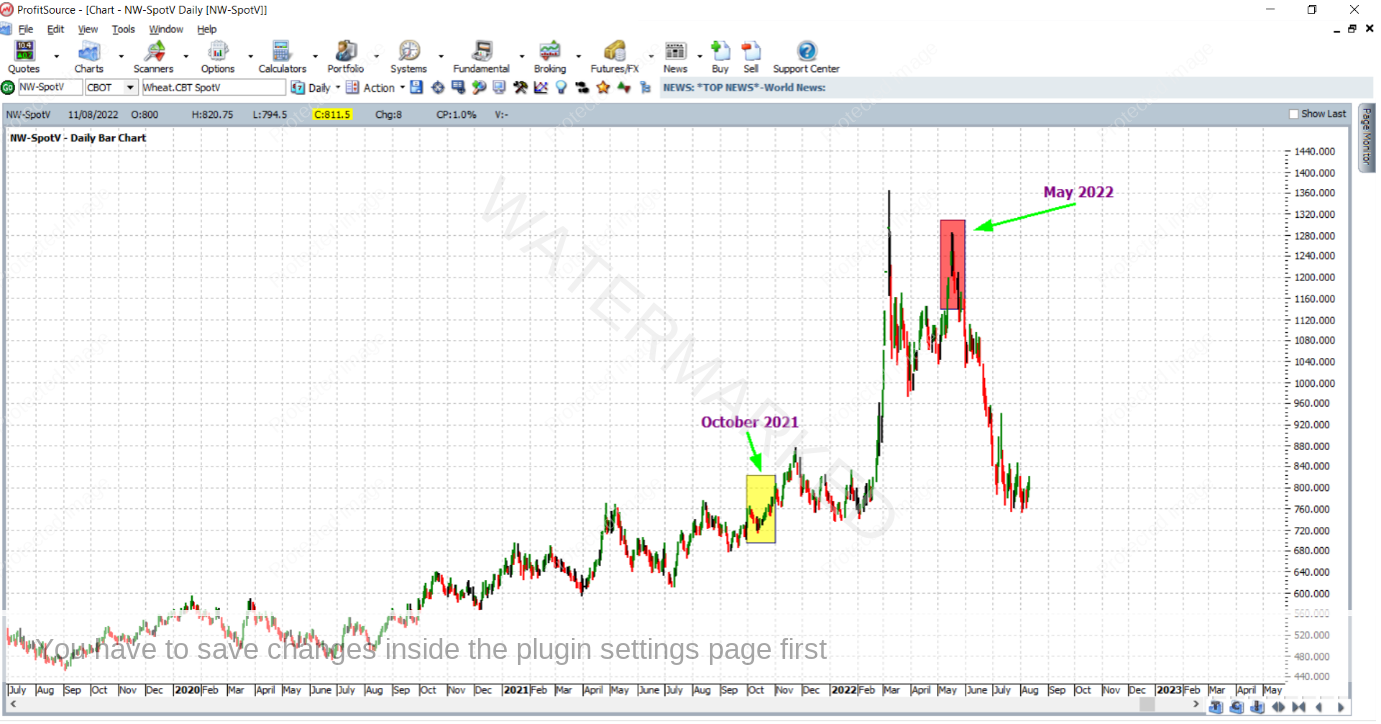
Now let’s take a look at something else. Firstly, back to the original chart, but this time also highlighted, in red, is the market action of May 2022, part of a much more volatile period of market activity.
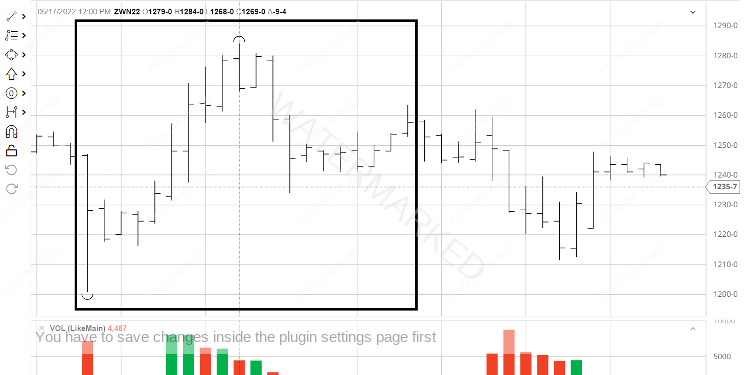
Let’s consider the average size of a trading bar leading into the actual top for May which came in at 1284 cents on 17 May 2022. Only this time it will be from the intraday hourly bar chart. Below is a screenshot of the hourly bar chart of the July 2022 Wheat futures contract from barchart.com. Highlighted by the black box are 20 hourly bars – roughly 10 either side of the 1284 top itself.
If you run the same calculation as was done earlier in this article by ProfitSource, the average size of each of these 20 intraday bars is approximately 16.50 cents, which is interesting to note! In other words, here we have a period of market activity which is volatile enough for intraday bar chart sizes to be as large as the more typical daily bar chart sizes in this market. Keep this in mind as you read on….
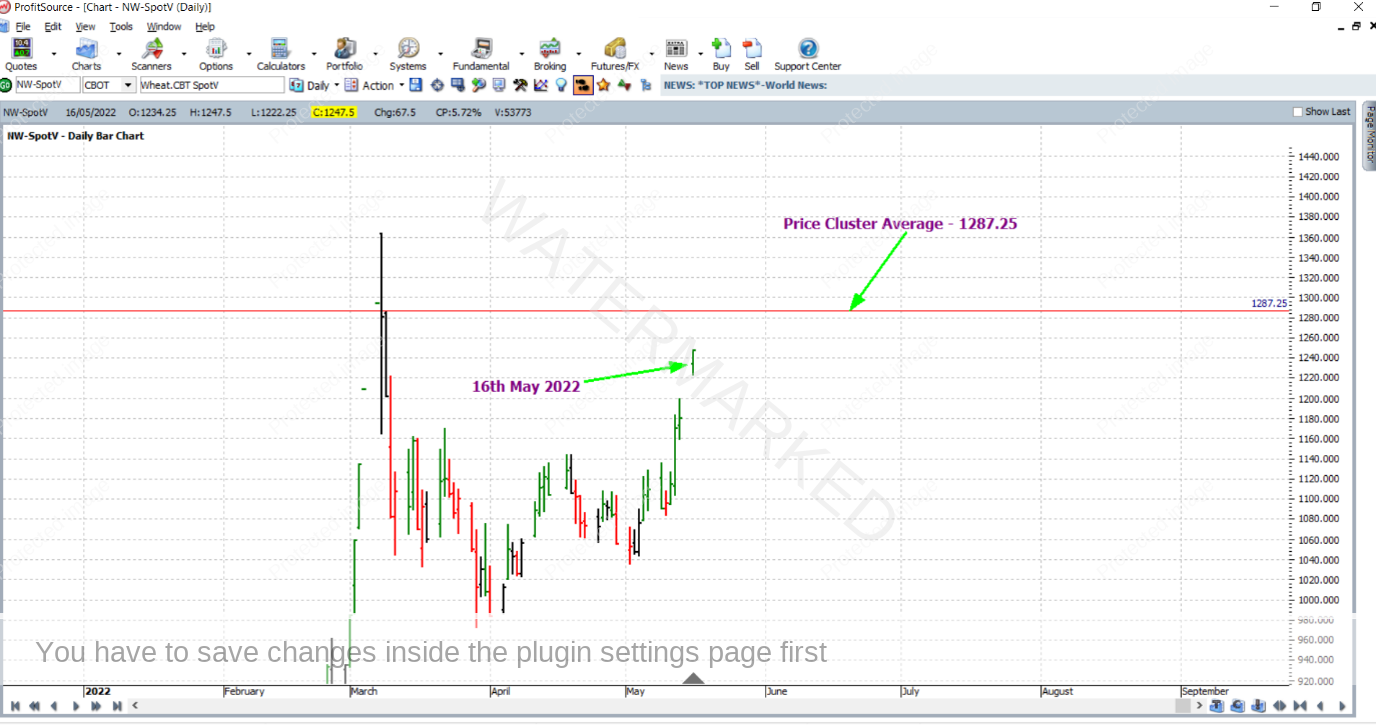
Now for the trade. By the middle of May, three solid price reasons had clustered together at an average of approximately 1287.25 US cents per bushel, and the market was trending strongly up towards this level. This is shown in the ProfitSource chart below in Walk Thru mode. See if you can use your price forecasting skills to come up with the same average.
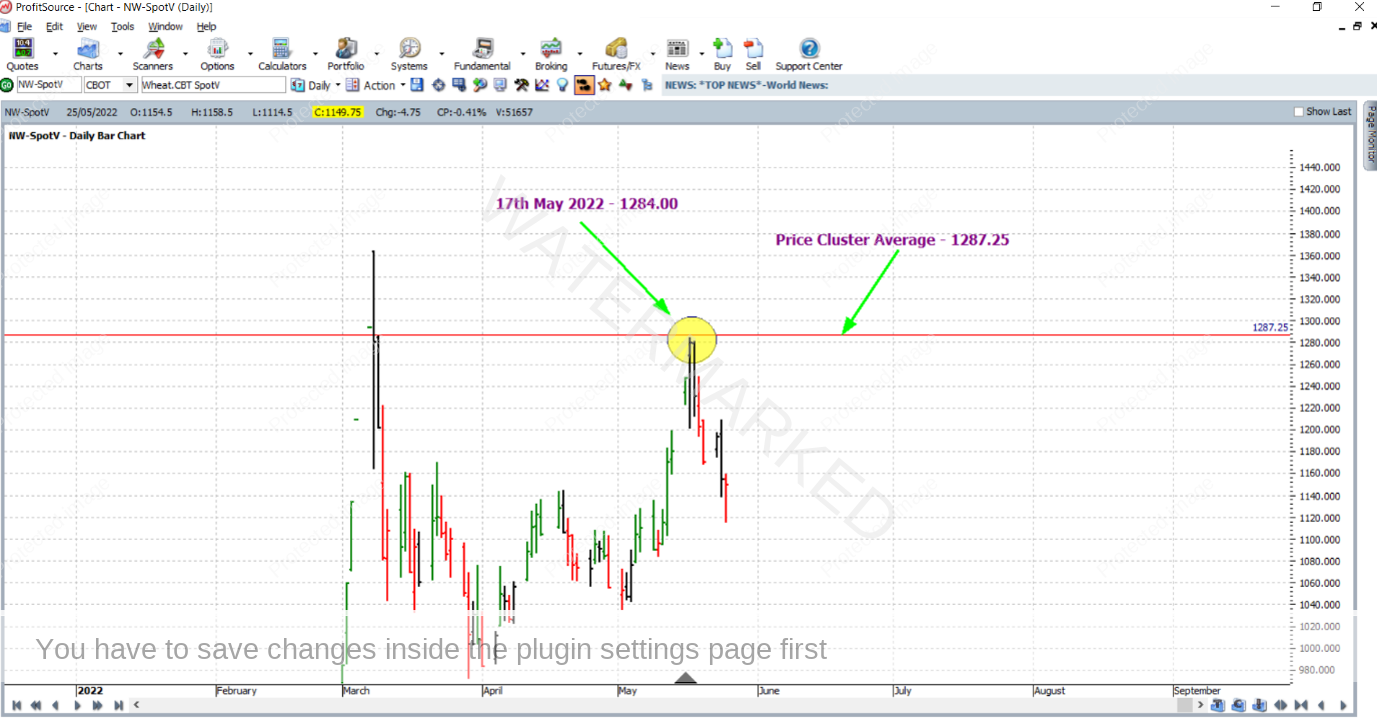
And a very strong reversal came after 17 May 2022 when the market had topped at 1284 cents, only failing to reach the price cluster average by a few cents.
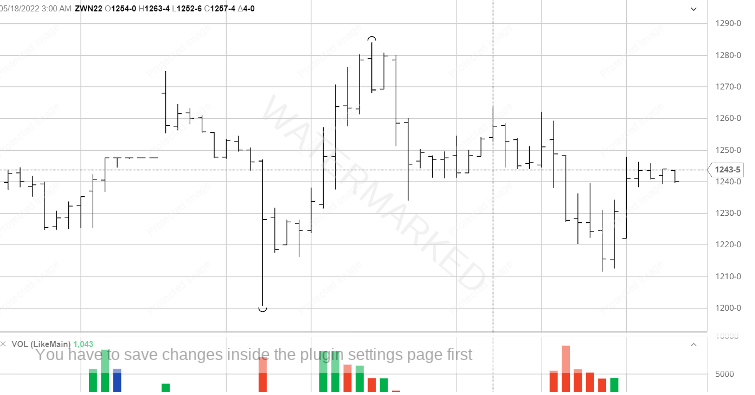
As for an entry, the hourly bar chart offered a first lower swing top entry signal in the early hours of 18 May 2022 Chicago time. This would have had you short Wheat at 1252.50 cents with an initial stop loss at 1263.75, as per the screenshot below, again from barchart.com.
In the weeks and months leading up to this trade, there was a lot of volatility in this market. Wheat had gone limit up a few times and there were a few genuine gaps in the chart. And intraday entries don’t offer the same degree of confirmation as entry signals from the end of day data charts, so we certainly had ourselves a very high risk trade.…or did we?!
Think back to the beginning of this article for a moment. Remember it was found that around the time of market entry, the hourly chart was giving average ranges that were basically as big as those found on the daily bar chart in a more typical period of market action. And the bigger the ranges on any bar chart, the stronger the degree of confirmation that its swing chart can offer. So maybe the entry detailed above had stronger confirmation than we would have thought without doing such a detailed study to begin with. Remember what David said: “Get to know your market like a cow knows it calf”.
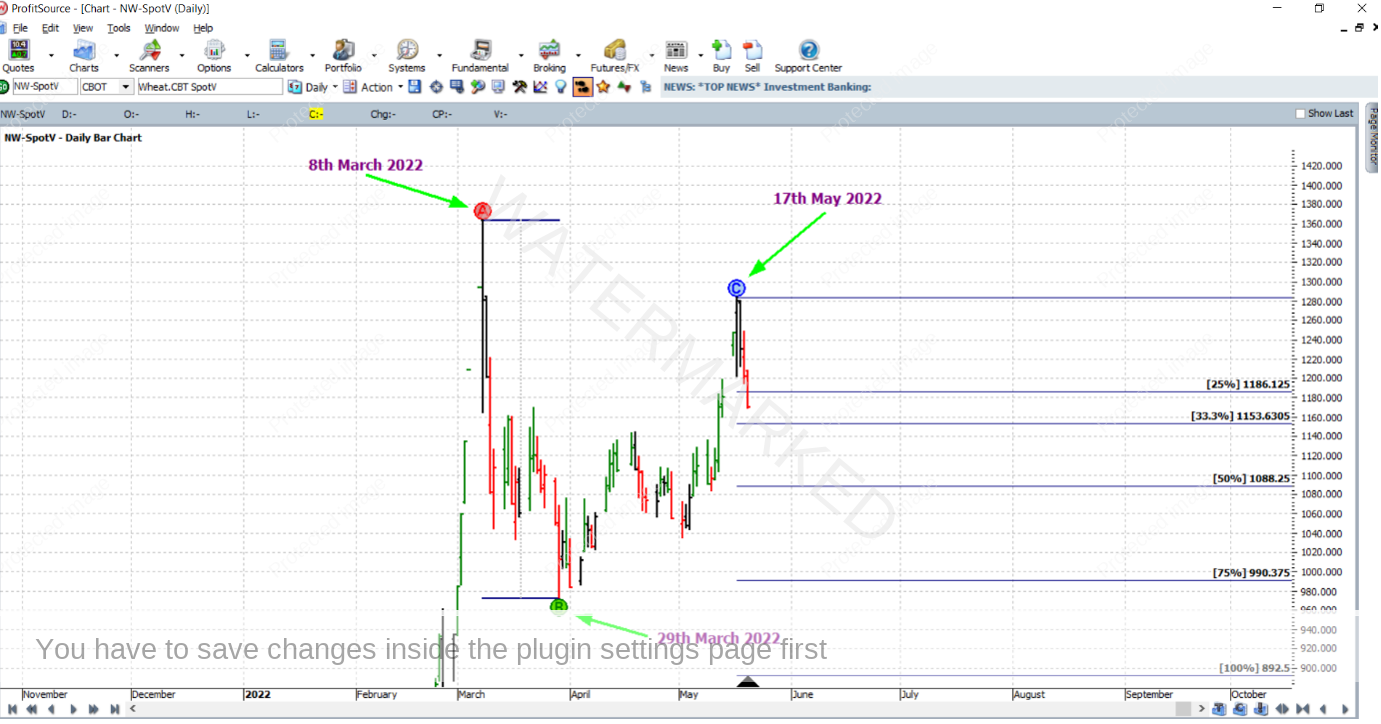
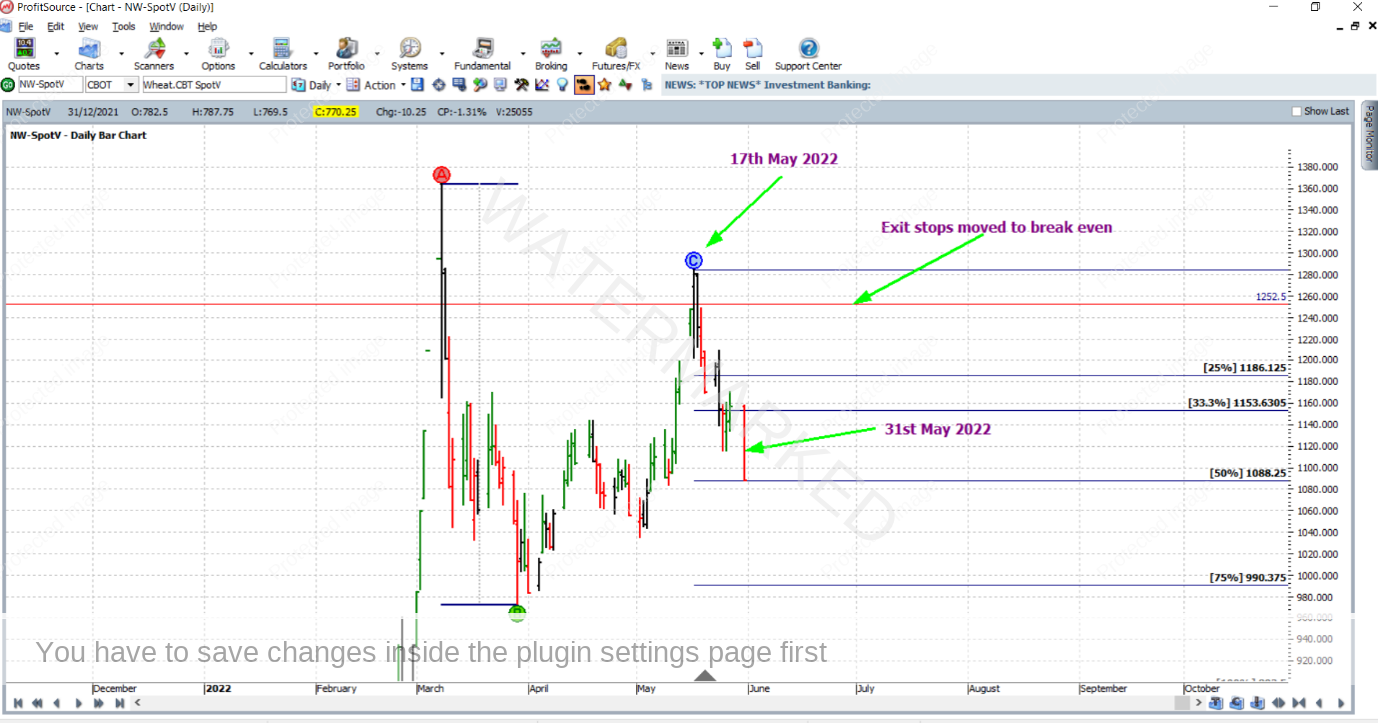
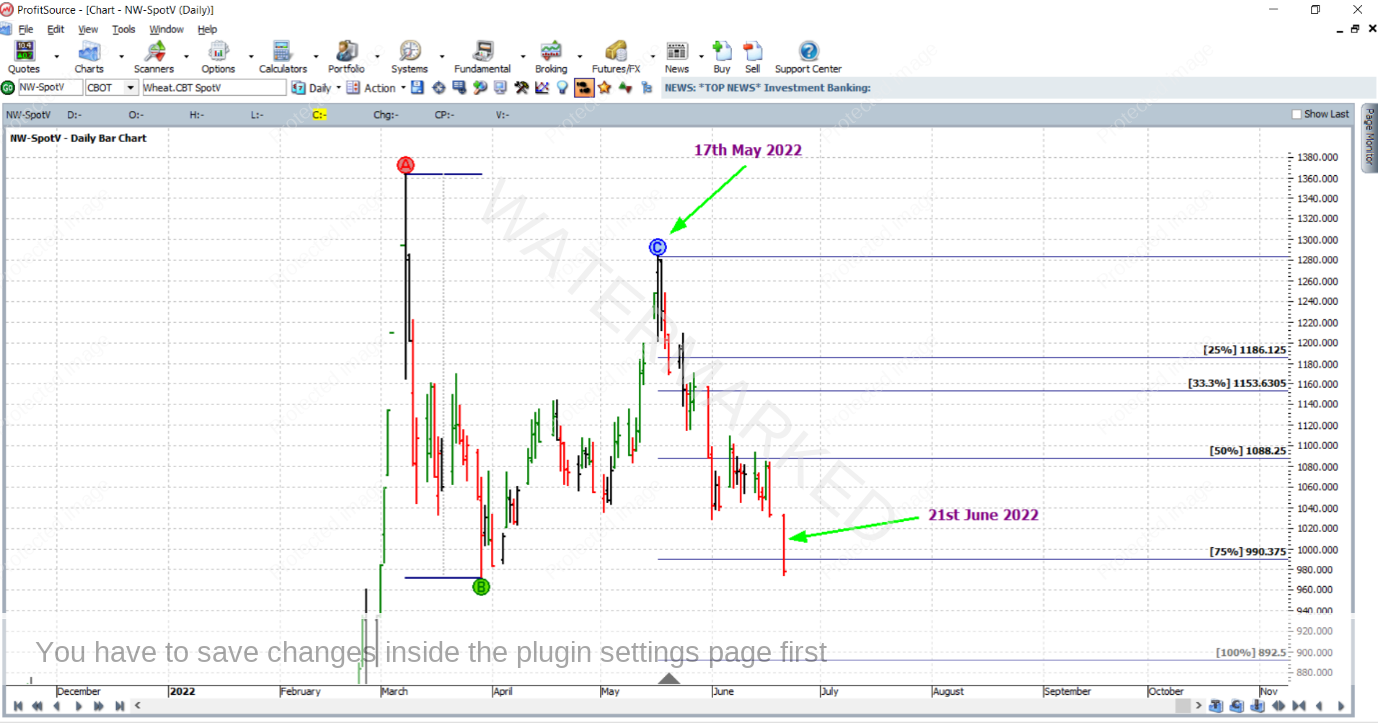
The reference range chosen for the trade was the steep run down from the 8 March 2022 high (1363.50) to the 29 March 2022 low (972.00), with stops to be managed “Stock Style” as though in a large ABC trade. See the chart below.
On 31 May 2022, the market reached the 50% milestone and stops were moved to break even.
On 21 June 2022, profit was taken at the 75% milestone – 990.50 cents (rounded up to the nearest point, point size being 0.25 cents).
Now for a break down of the rewards for studying and analysing this market and taking this trade.
In terms of the Reward to Risk Ratio:
Initial Risk: 1263.75 – 1252.50 = 11.25 = 45 points (point size is 0.25)
Reward: 1252.50 – 990.50 = 262 = 1048 points
Reward to Risk Ratio: 1048/45 = approximately 23 to 1
If you go to the CME Group website and look up the contract specifications for wheat futures, each point of price movement changes the value of one contract by $12.50USD. Therefore in absolute USD terms the risk and reward for each contract of the trade is determined as:
Risk = $12.50 x 45 = $562.50
Reward = $12.50 x 1048 = $13,100
In AUD terms at the time of taking profit that reward was approximately $18,850.
Risking 2.5% of the account size for this trade, the resulting percentage change to the account size after taking profits would be:
23 x 2.5% = 57.5%
There was also some time analysis in favour of the trade, but that discussion is beyond the scope of this article, and something that students of the Ultimate Gann Course might like to investigate.
Work Hard, work smart.
Andrew Baraniak
