The Banking Sector
Back to the banks this month and a review of the double bottom trade that one of them offered during the bull market that has unfolded in the banking sector over the last few years. Before reading on however for some background information you can refer to our February 2026 monthly general newsletter article.
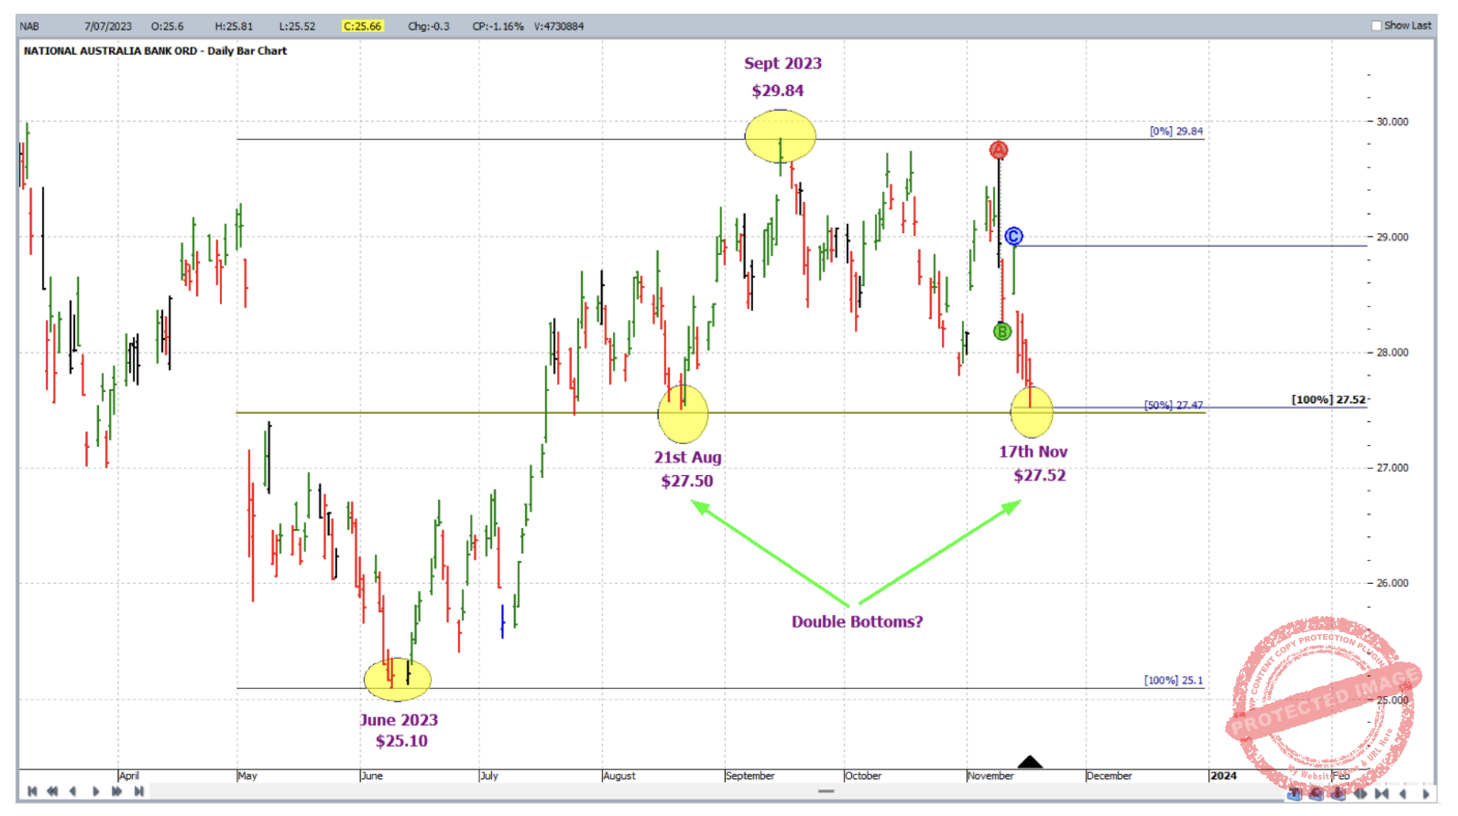
The stock this time is National Australia Bank (NAB:ASX) and as at 17 November 2023 the market had lowed at $27.52; by this point there were three reasons to anticipate a reversal back to the upside:
- A potential double bottom set up in conjunction with the August low – which was at $27.50
- 50% retracement on the Ranges Resistance Card from the June 2023 low to the September 2023 high.
- 100% repeating range with the application of the ABC Pressure Points tool.
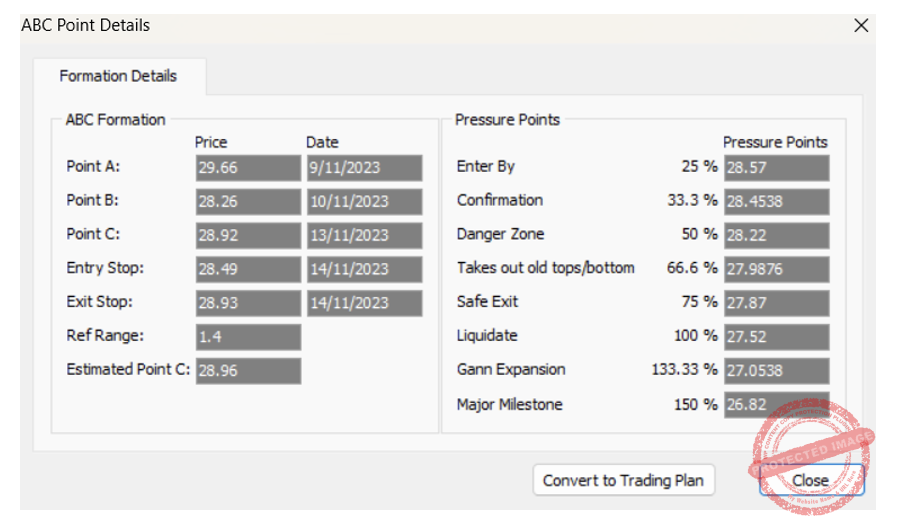
This information is illustrated in the ProfitSource chart below, followed by the details window for the ABC application.
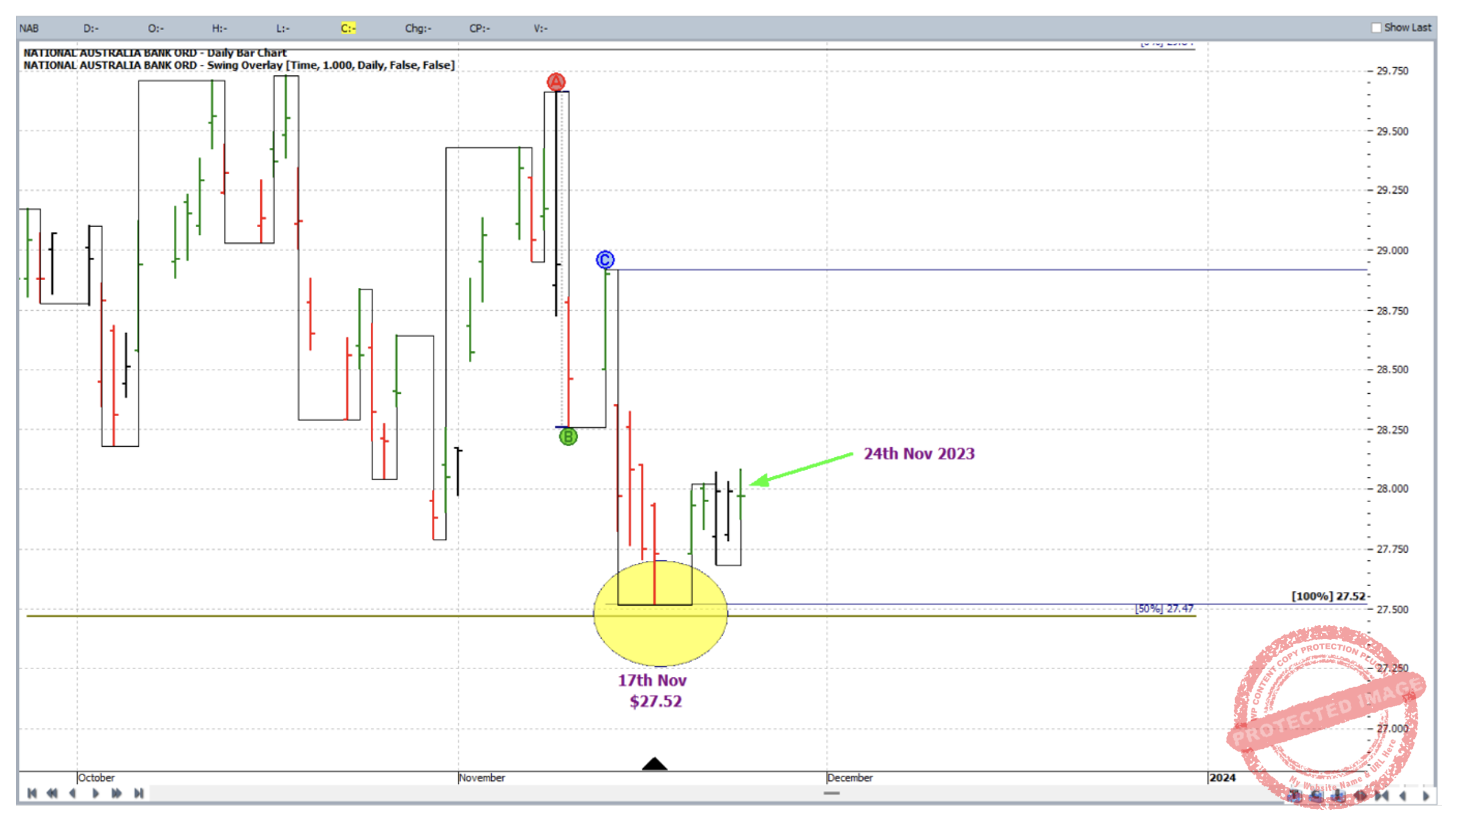
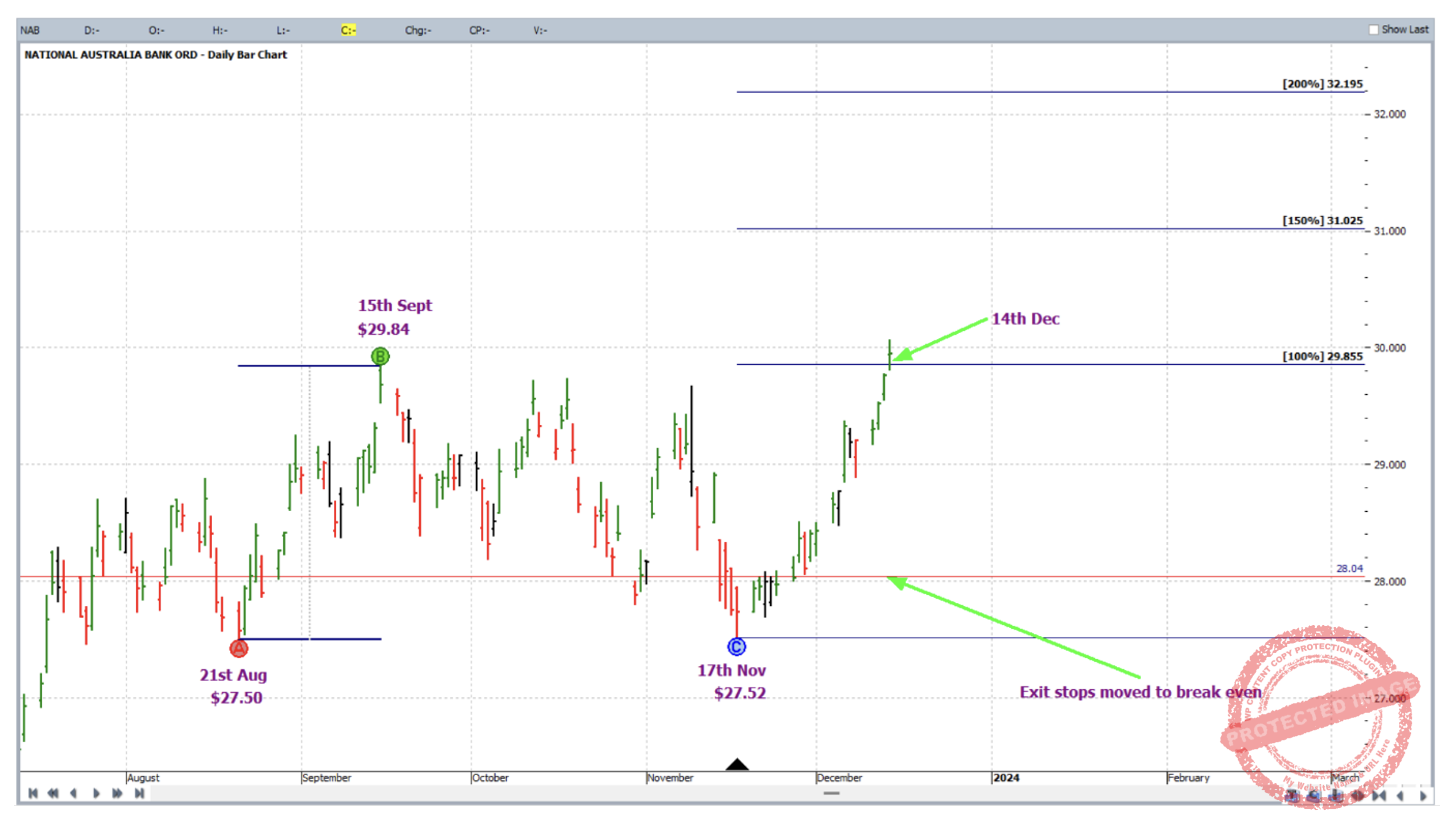
With enough reasons to trade, a week later with the up day of 24 November 2023 the confirmed higher daily swing bottom had you long NAB at $28.04 with initial exit stop loss at $27.67; this is shown below with the aid of the daily swing chart overlay.
As for trade management 200% of the double bottoms was our profit target. For moving stops while in the trade (given that this was a relatively small picture double bottom formation) this was only done when the market reached the half way point of its expected run (100%) and the three-quarter mark of its expected run (150%). Moving stops at every 25% milestone with a smaller picture double bottom trade could easily have us too close to market action during the run, stopping us out prematurely!

On 14 December 2023 the market reached the 100% milestone and exit stops were moved to break even.
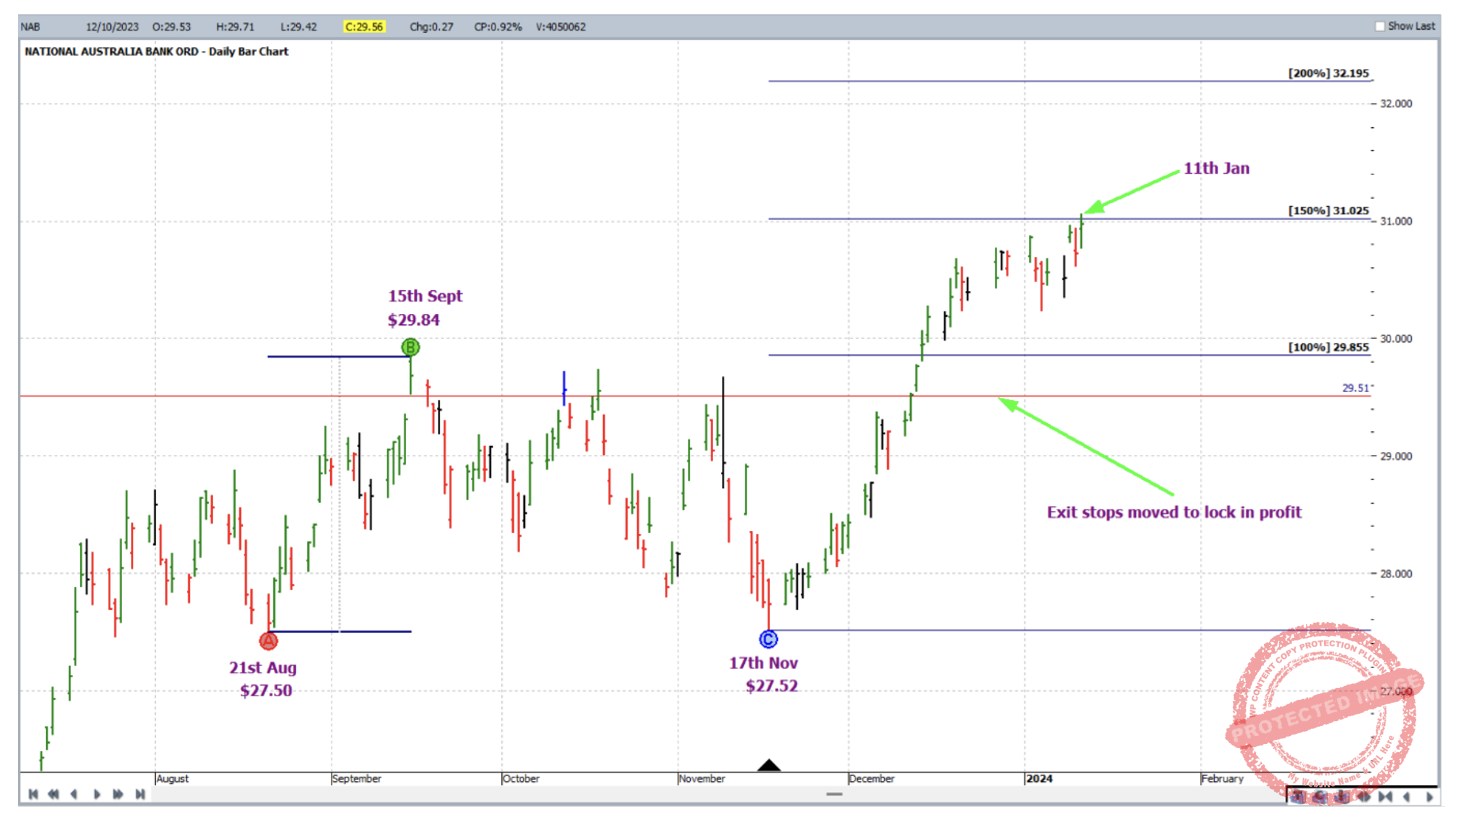
On 11 January 2024 the 150% milestone was reached and exit stops were raised to one third of the average weekly range (approximately 34 cents based on the last 60 weekly bars) below the 100% milestone to lock in profit.
And on 30 January 2024 the market gapped on open just above the 100% milestone and the trade closed at $32.23.
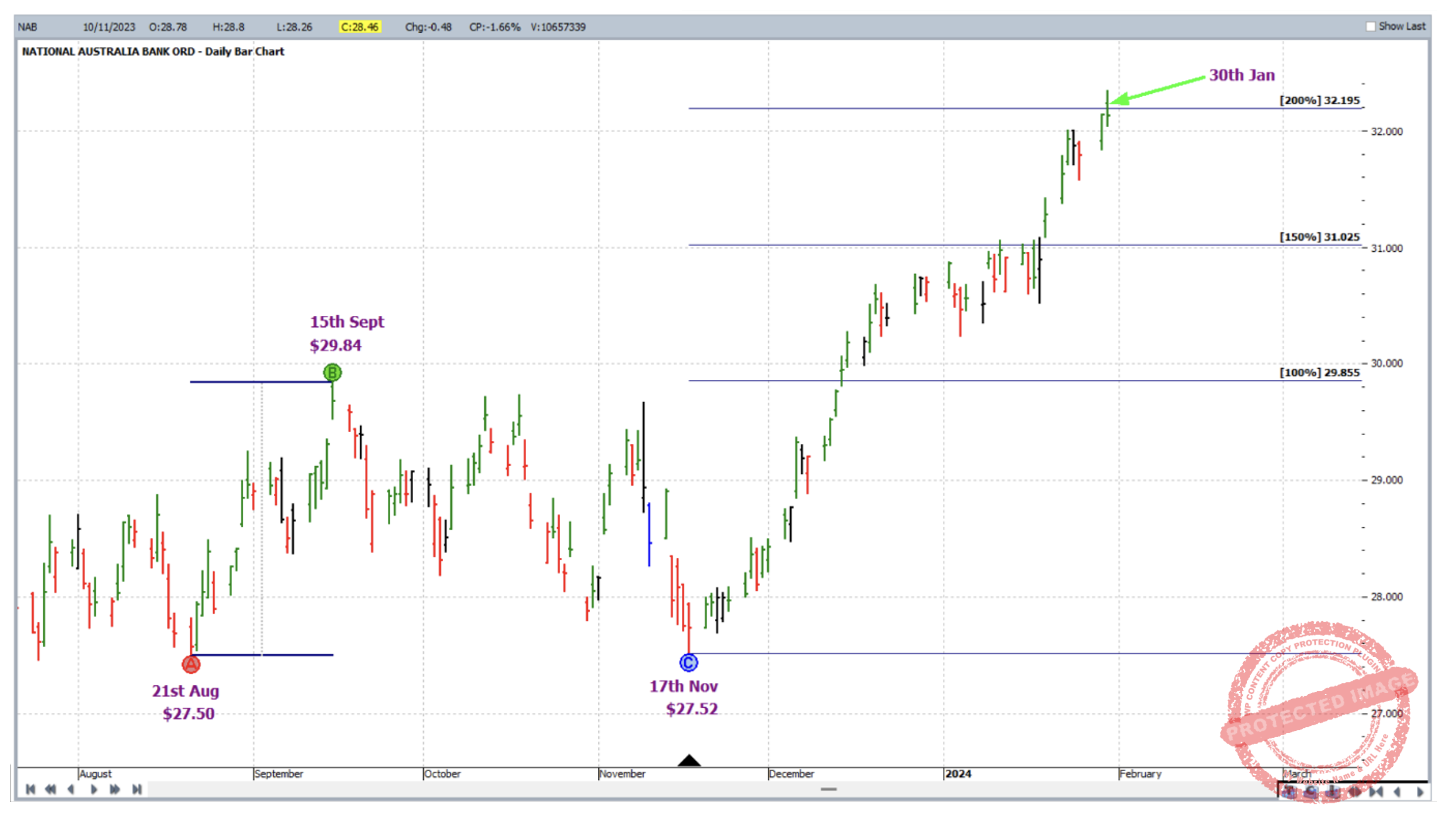
For a breakdown of the rewards, first of all in terms of the reward to risk ratio:
Initial Risk: 28.04 – 27.67 = $0.37 = 37 points (point size is 0.01)
Reward: 32.23 – 28.04 = 4.19 = 419 points
Reward to Risk Ratio = 419/37 = approximately 11 to 1
If 5% of the account size was risked at entry the percentage gain in account size would be as follows:
11 x 5% = 55%
If 5% of a $10,000 account was risked, i.e. $500, the reward would be:
11 x $500 = $5,500
With a consistent and persistent price forecasting routine, one can become independent with discovering and trading setups like this in real time as they unfold.
Work hard, work smart.
Andrew Baraniak