The Big Banks
Opportunities Ahead!
In the Australian economy we find ourselves hinged to large banks and large mining companies. We don’t tend to branch out much further when it comes to global leaders by market size. It’s apparent to all as we tackle 2023 that we are in a new part of the cycle. The economic cycles produce times when certain industries and business types can prevail due to tailwinds. Equally, with the headwinds of inflation and interest rate rises the banks will retreat to fatter margins to keep their books healthy as the average loan sizes will have to diminish as borrowing capacity reduces.
So it’s with interest I take a look at our largest bank and sometime largest stock based on market cap, Commonwealth Bank (CBA.ASX). In February we saw a record announcement with increased earnings per share which would typically signal positive signs for a stock price, however this news was received poorly by the market and a 6% slide in the share price followed. Does this go to show how fickle markets are, or are they just pricing in the prospects with those headwinds starting to pick up?
If you were long into those earnings announcements and then saw the market gap down with a leveraged position, it can be a bitter pill to swallow. I know, I have swallowed a few in my time. The news and market sentiment can cause markets to move, but the technical signs have been suggesting that the upside momentum in CBA has been running out of puff.
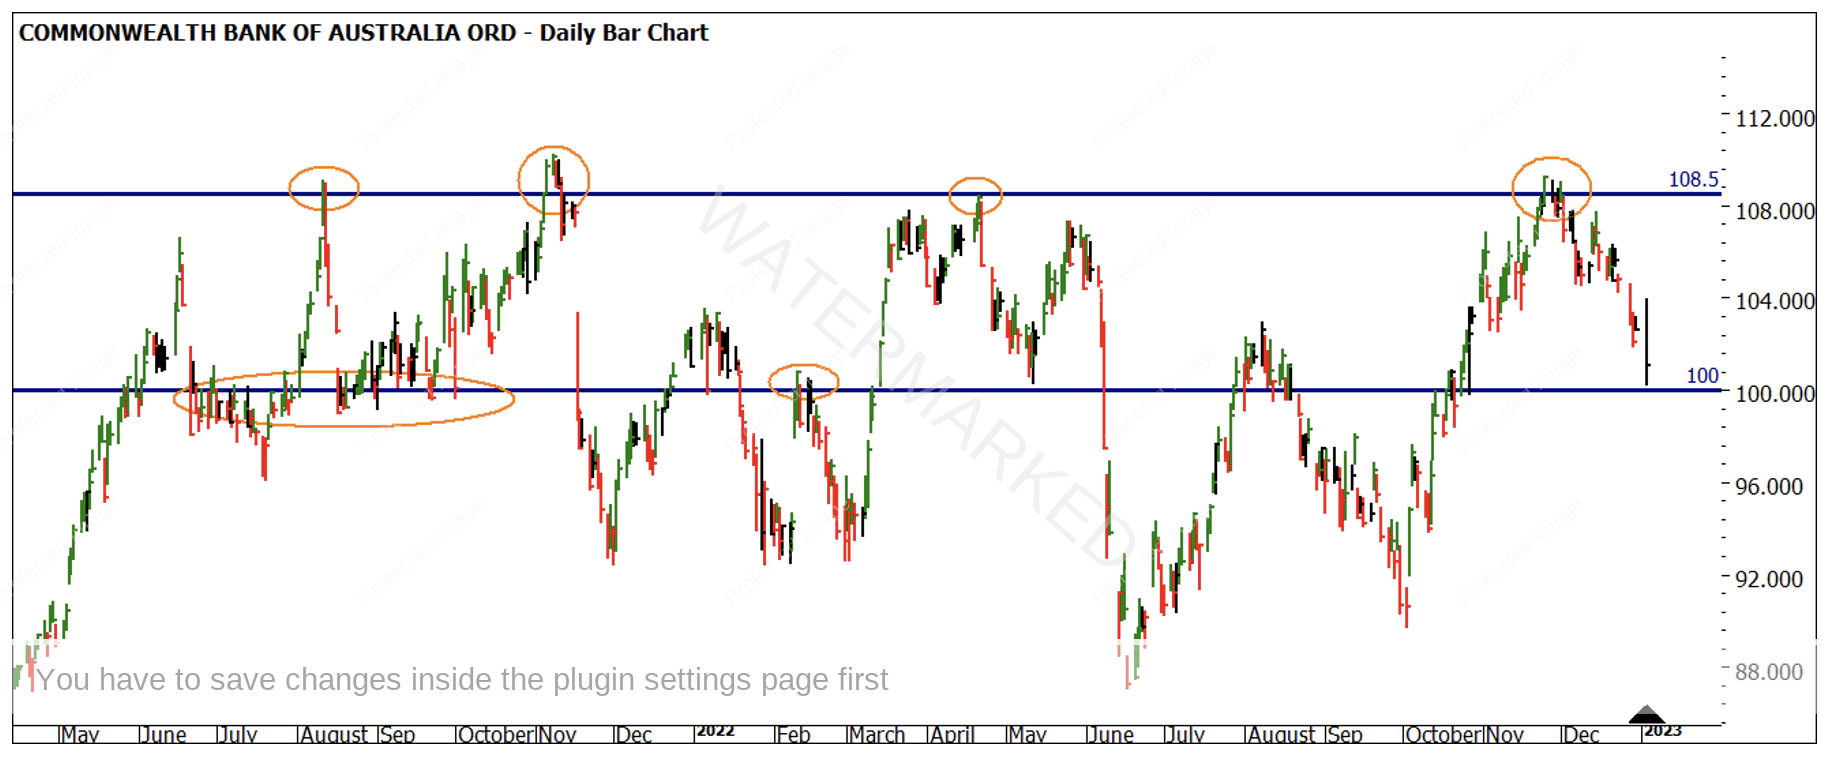
Chart 1 shows the last 18 months of price data on CBA, with the lower line tracking the psychological $100 mark and the top side a line of best fit around the 2021/2022 tops. The price action declined into early January 2023.
Chart 1 – Daily Bar Chart CBA
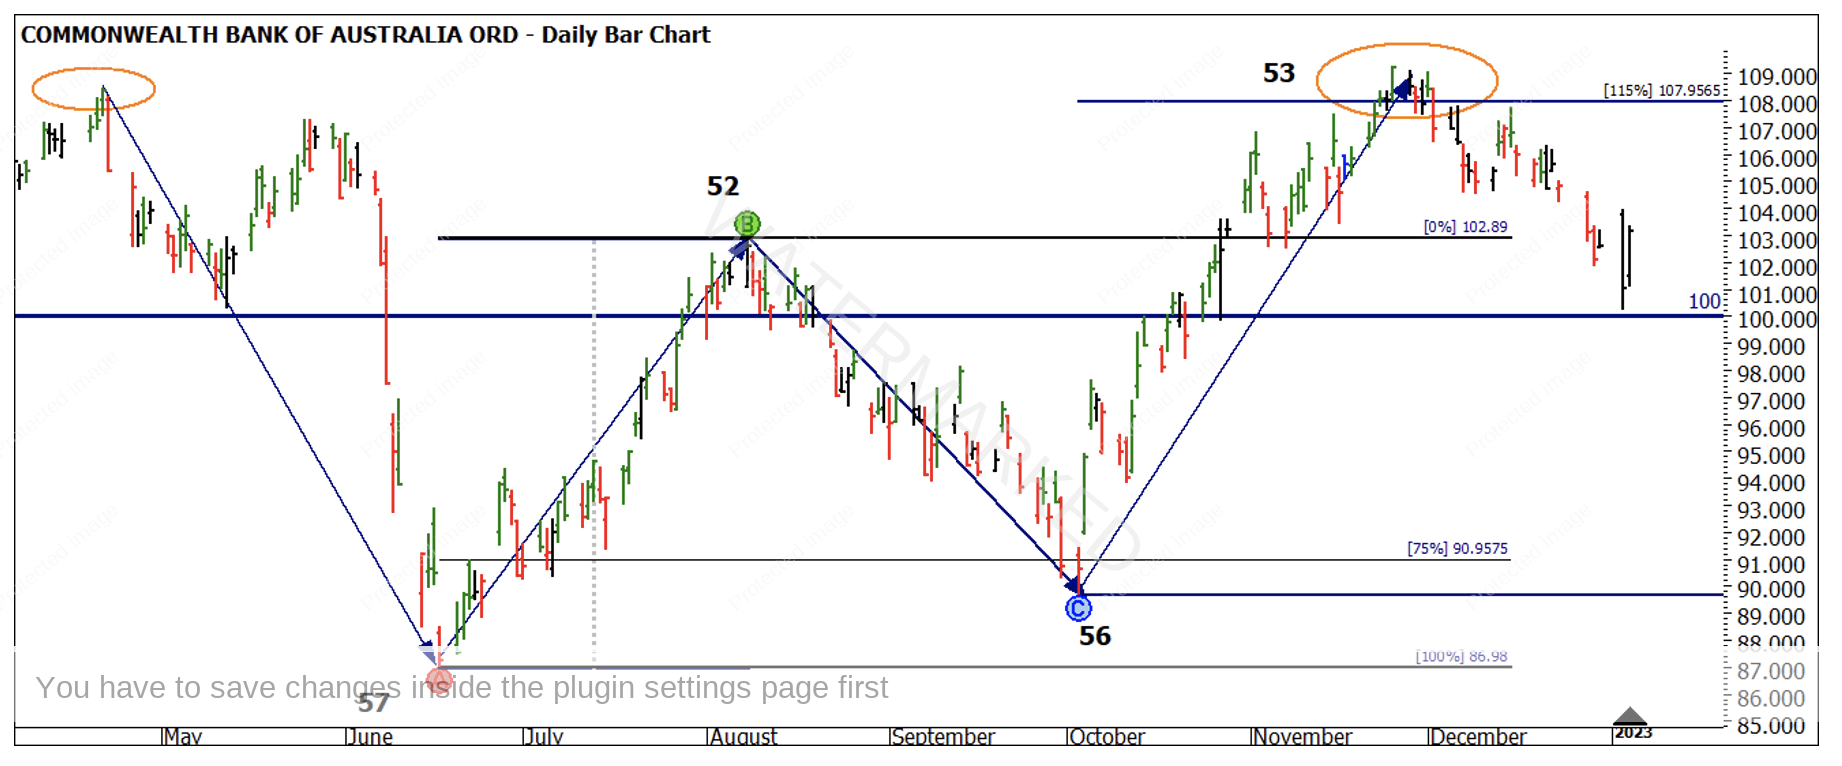
Chart 2 details the ranges moving from May 2022 to the end of 2022. We can see that the ranges are not what I would describe as a classic pattern of extension and contraction to support the trend. The retracement into October was past 75% and then the run up to November ran to 115%. This to me confirms volatility and direction is becoming harder to track with price alone. The interesting point noted is the move in days, with all of the ranges moving in a close time frame.
Chart 2 – Daily Bar Chart CBA
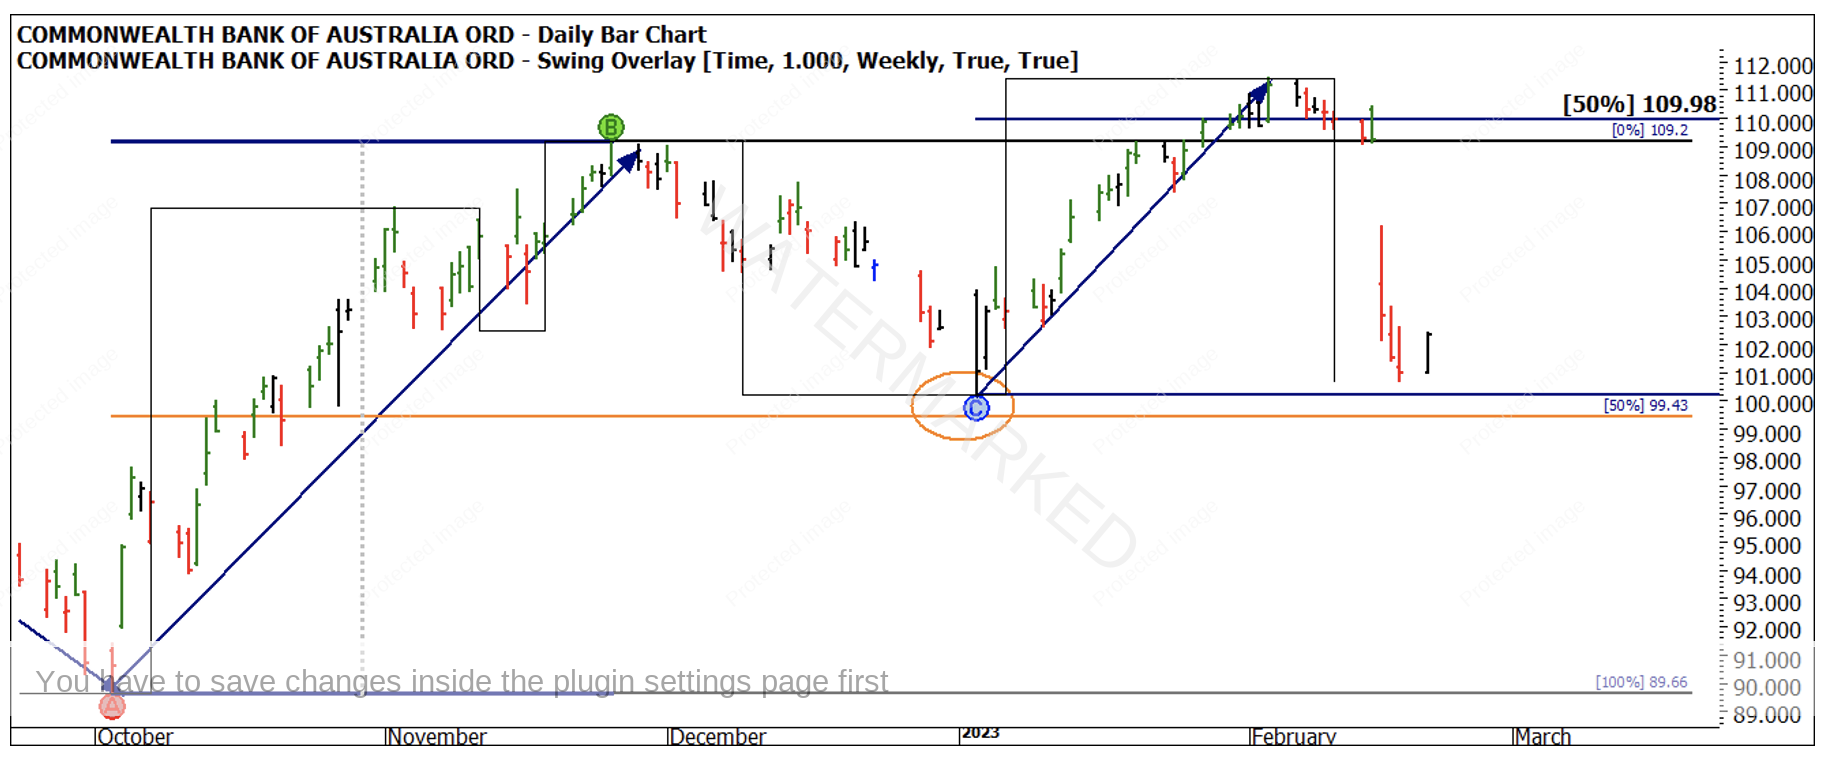
Chart 3 now brings us to the current day. The run into the February high got to 50% and stalled. Given the pullback into Point C was less than 50%, one might imagine the market had every chance to break through the $109.98 mark, however it ran out of steam. The trend was uncertain leading into the earnings announcement so basic rules would have kept us out of the long side.
The day before the drop in price the daily chart was shaping up for a lower swing top on the daily chart.
Chart 3 – Daily Bar Chart CBA
Your challenge here would be to also test and examine what other Price Forecasting tools from the Number One Trading Plan can assist in this area of price. The other broader market technique of Sections of the Market can also help us form a view. Gann spoke about markets failing at the 3rd section, and there is no better place for a section to fail than an important 50% milestone.
The key now will be to see how far the price action falls and if the January 2023 low $100.21 becomes support or resistance?
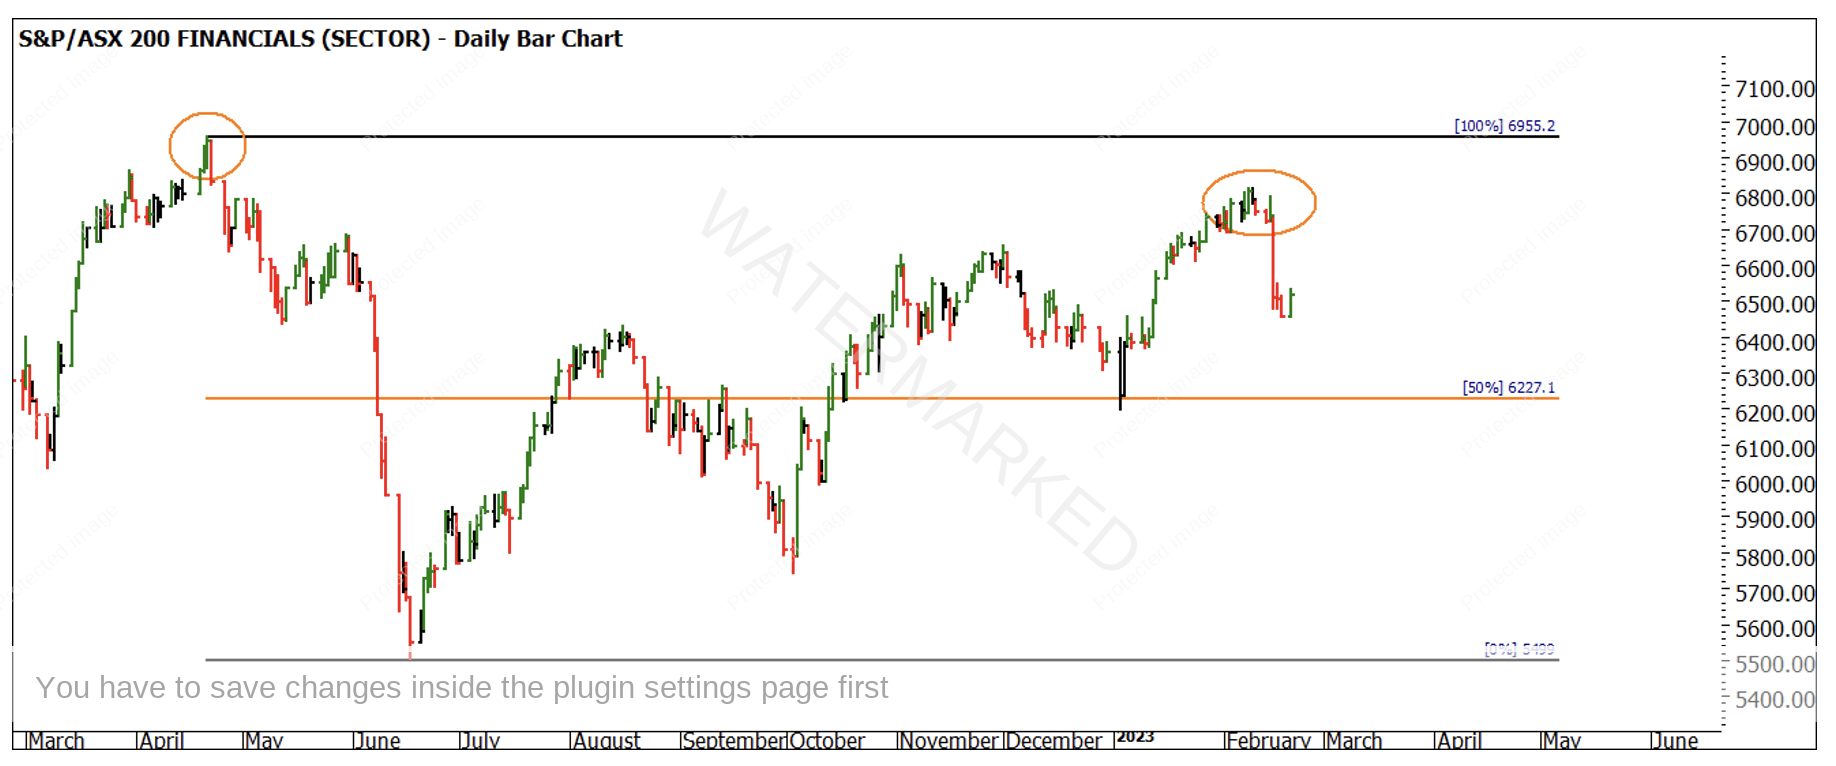
The financials sector on the whole is positioned with a similar shape to CBA but never reached its high of April 2022.
Chart 4 – Daily Bar Chart CBA
The challenge now is to compare the position and pattern of the big 4 banks and look for any similarities or divergence between them as a group and the index. 2023 is likely to be a trader’s year with good ranges to participate in, they could be shorter and sharper so being ahead of the game and prepared for signals to be triggered will be key.
A split screen approach in ProfitSource maybe a good place to start.
Good Trading
Aaron Lynch


