The Deep Rabbit Hole
As a Safety in the Market student, some of the more interesting studies or what is commonly referred to as the ‘deep rabbit hole’ with the Gann Methodology is numerology or the study of coincidental number patterns. The terminology ‘rabbit hole’ is spending a lot of time studying and researching to explore the underlying message. Gann spent a lifetime studying numbers and their patterns, whether that be coincidental or the common natural laws of the universe, we are here today still discovering these exact laws.
In the Stock Market Course, Gann often made reference to numerology. In particular references about The Human Body stating;
“There are seven openings in the head –two eyes, two ears and two nostrils, equally divided, three on each side. From this we get our Law of Three and know the reason why the change comes after two and in the third period. The seventh opening in the head is the mouth and everything goes down…”
He continues by stating that:
“Study the different divisions of your limbs… You have 5 fingers on each hand. They are above the waistline or solar plexus and represent the 10-year cycle or the two 5-year cycles, which are 1/4 and 1/2 of the 20-year cycles. You have 10 toes but note that there are 5 on one side and 5 on the other. This indicates that one 10-year cycle… Study all of these Master charts, apply them to Space, Time and you will find the cause of tops and bottoms and will know how to determine Resistance Levels…
Go back over any of the old charts you have and study the places where they have had the greatest resistance. Note the price, then determine the time by weeks, months or days, and you will be able to learn how to understand future movements…”
W.D Gann, The Stock Market Course, January 1931
Depending on where you are on your trading journey, it might seem like a lot to comprehend. Gann’s statements represent his methodology, and while very fascinating can lead you down the ‘rabbit hole’ and provide you with plenty of unpractical discoveries. However, these discoveries can pay off, by studying the high and low prices of your chosen market and making divisions of these prices as per Chapter 9 of the Number One Trading Plan and by “knowing your market like a cow knows its calf”.
As Gann traders, we naturally fall down this rabbit hole, as it is fascinating to understand these discoveries, especially for the human species about how the world works. It is important to focus on turning the ‘rabbit hole’ discoveries into tradable resources.
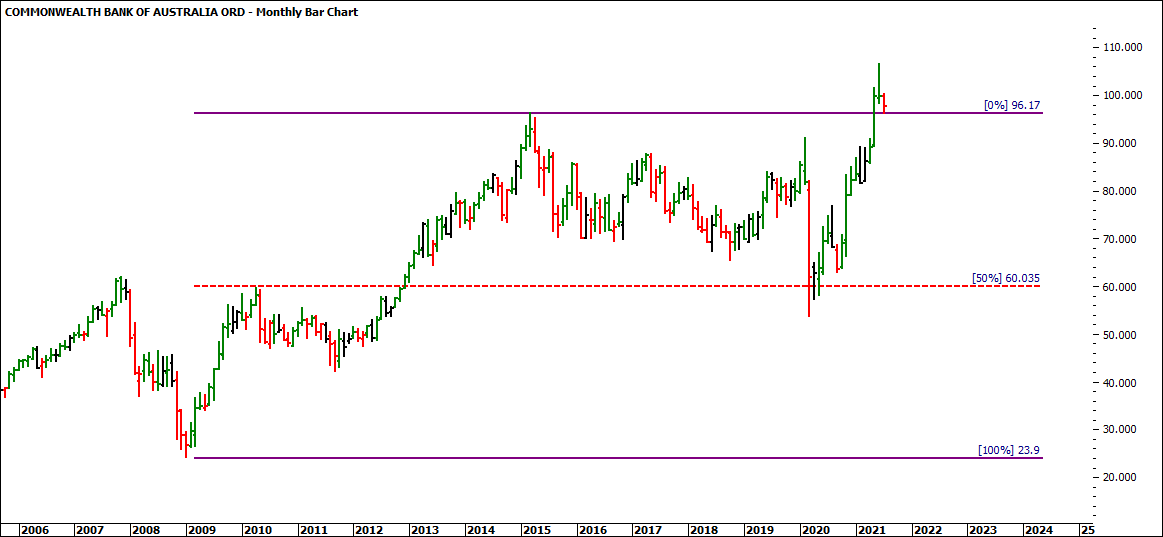
If we turn our attention to Commonwealth Bank of Australia (ProfitSource Code CBA) you can see that two points in time, being the low in 2009 at $23.09 and the high made in 2015 at $96.17 gives us a range of $72.26.
Watching the ¼ and ½ levels of this range, 50% comes in at $60.03, which was close to the old tops in 2007 and 2011.
The market found support on this 50% level close to 10 years after the low was made. Does this seem like a coincidence?
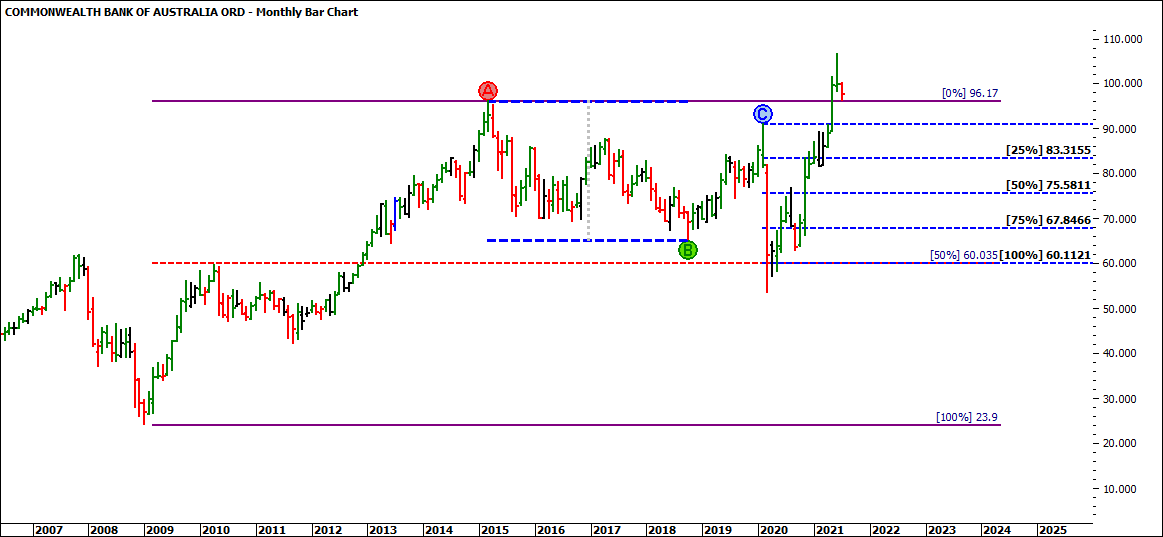
Let’s take a deep look at the importance of the 50% level at $60. While it is also a psychological level, projecting the ABC milestone tool from the 2015 high to the 2018 low, this gives a range of $30.93. And projecting this from the COVID high at $91.06 we come in at $60.11 as a 100% milestone.
Without going too deep down the rabbit hole, remember that Gann said,
“The seventh opening in the head is the mouth and everything goes down…”
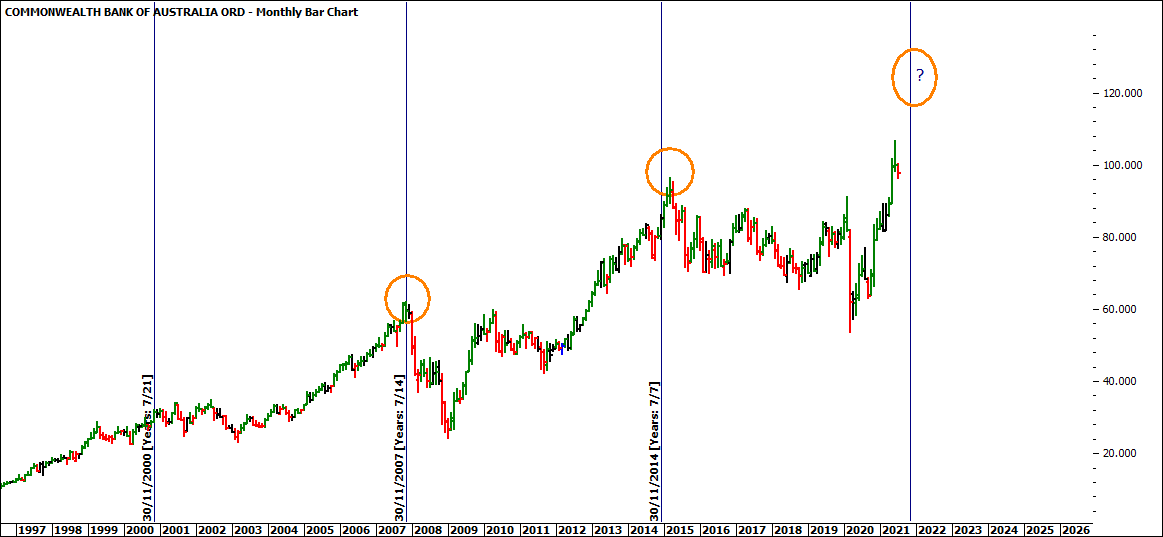
Well, CBA made a major high in November 2007, followed by 7.25 years later making a major high in March 2015, and projecting that 7 years forward we are looking for a top in November 2021. Isn’t the year 21 divisible by 7 as well?
While all this is speculation, it is worth watching Commonwealth Bank unfold.
It’s Your Perception
Robert Steer


