The Franc
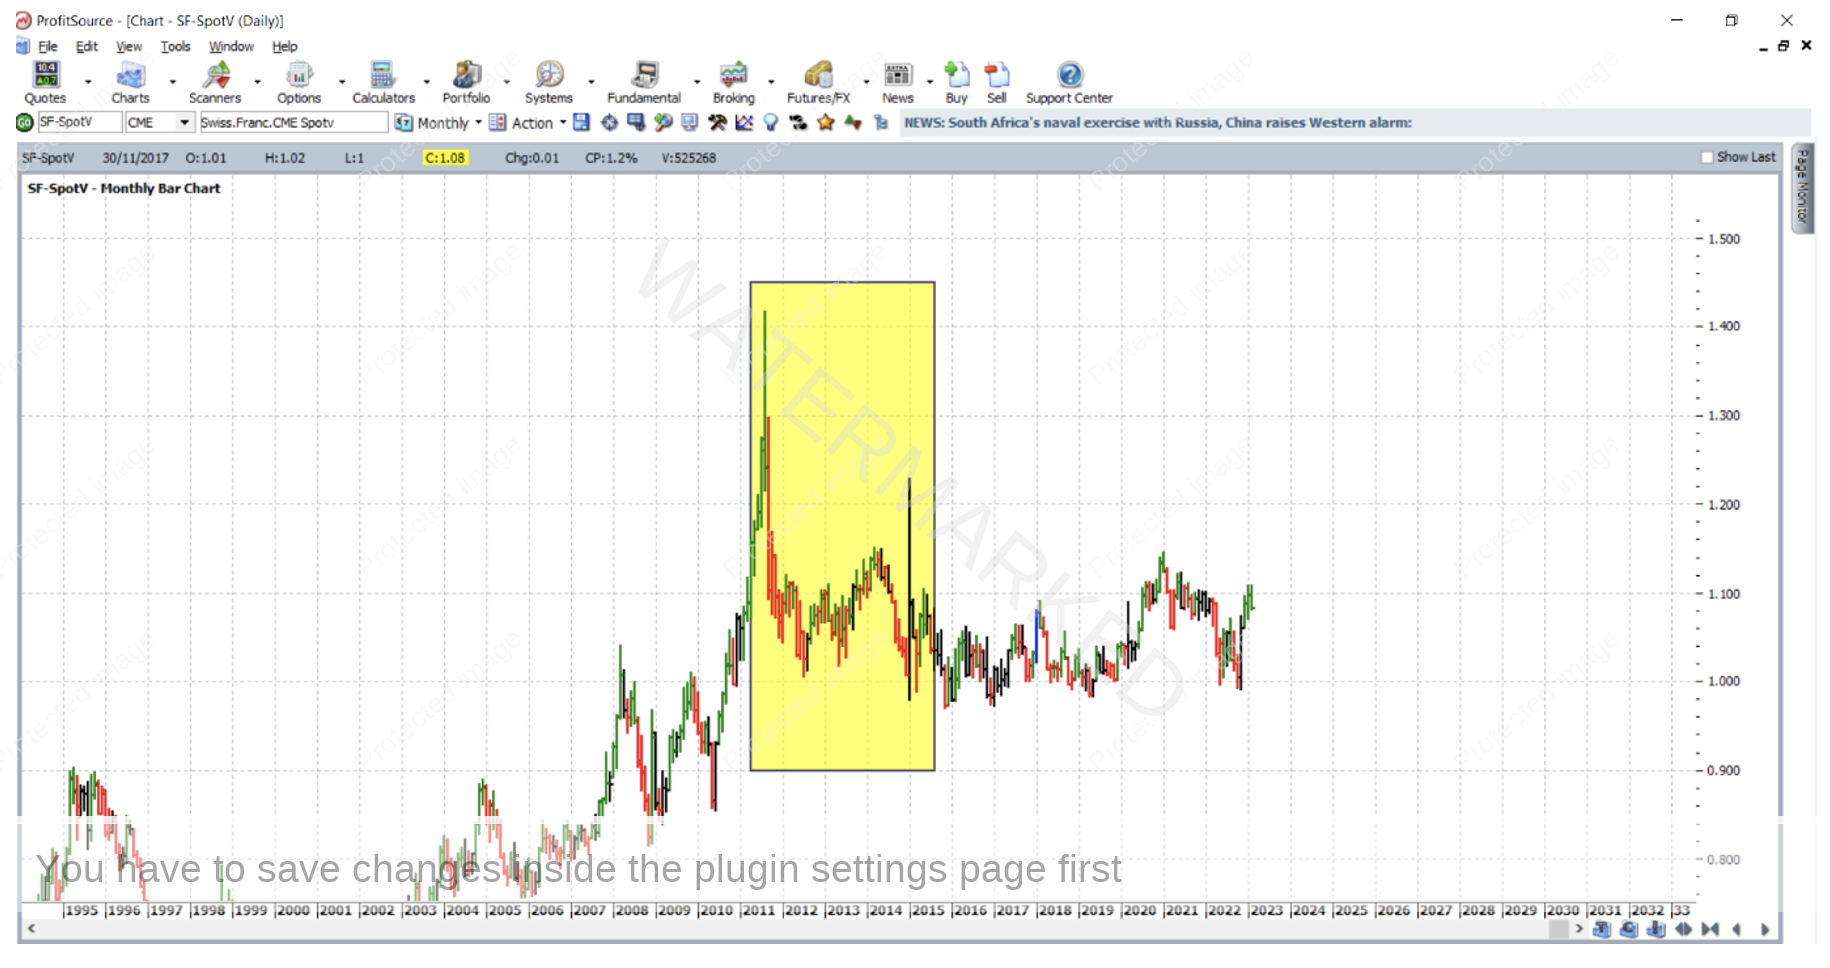
The Swiss Franc versus the US Dollar currency pair was one of David Bowden’s old favourites to trade. In fact, he said that if he could only trade one market, that would be it. This is because the major currency markets are usually always trending. But in recent times it hasn’t been so simple for the Franc. Many of you might be aware that for the better part of 2011 to 2015, the Swiss Franc was pegged to the Euro. As you can see in the chart below (symbol SF-SpotV in ProfitSource), during this period it had some extreme but brief bursts of volatility, followed by a lot of sideways market action.
Even after the peg was removed in 2015, a few years of sideways market action still followed. Not the usual sort of consistently trending currency pair you would expect.
But have things now finally begun to change? This market has been back under the influence of natural market forces for a while now, has it finally come back to life? The goal of this article is to encourage you to find out!
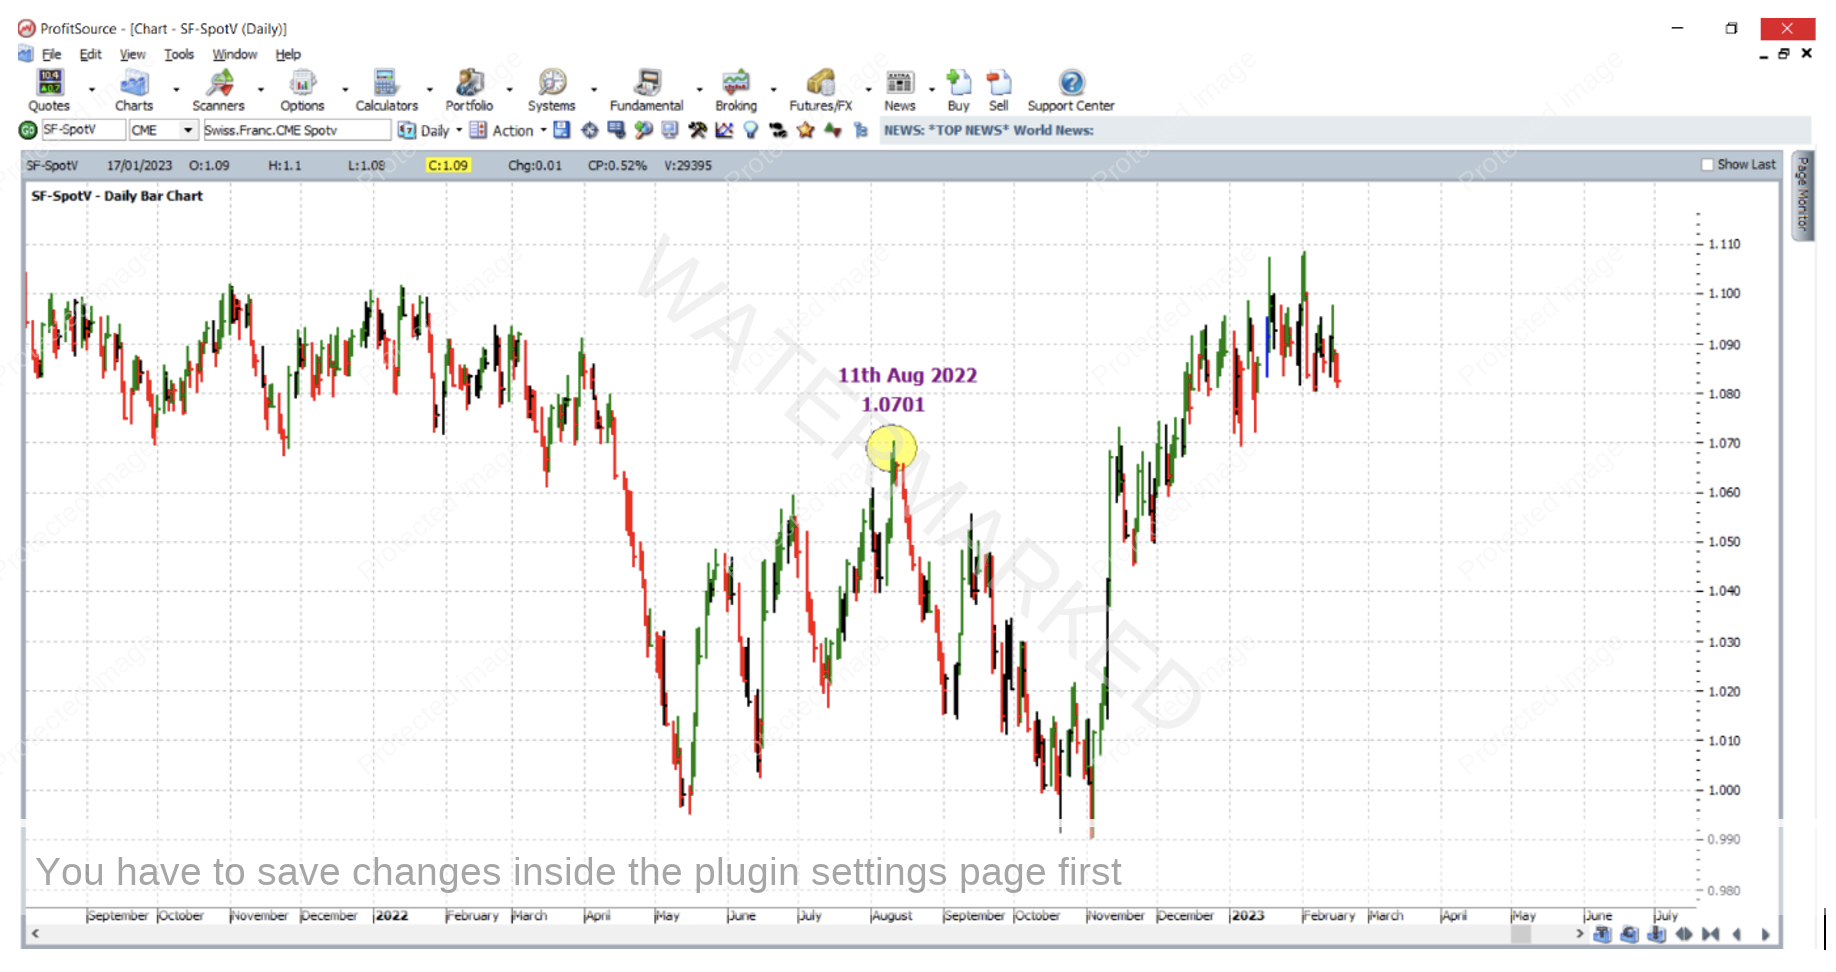
Let’s focus on a top that recently occurred in this market. The ProfitSource chart below shows that there was a sharp reversal on 11 August 2022 at a price of USD$1.0701 for each CHF.
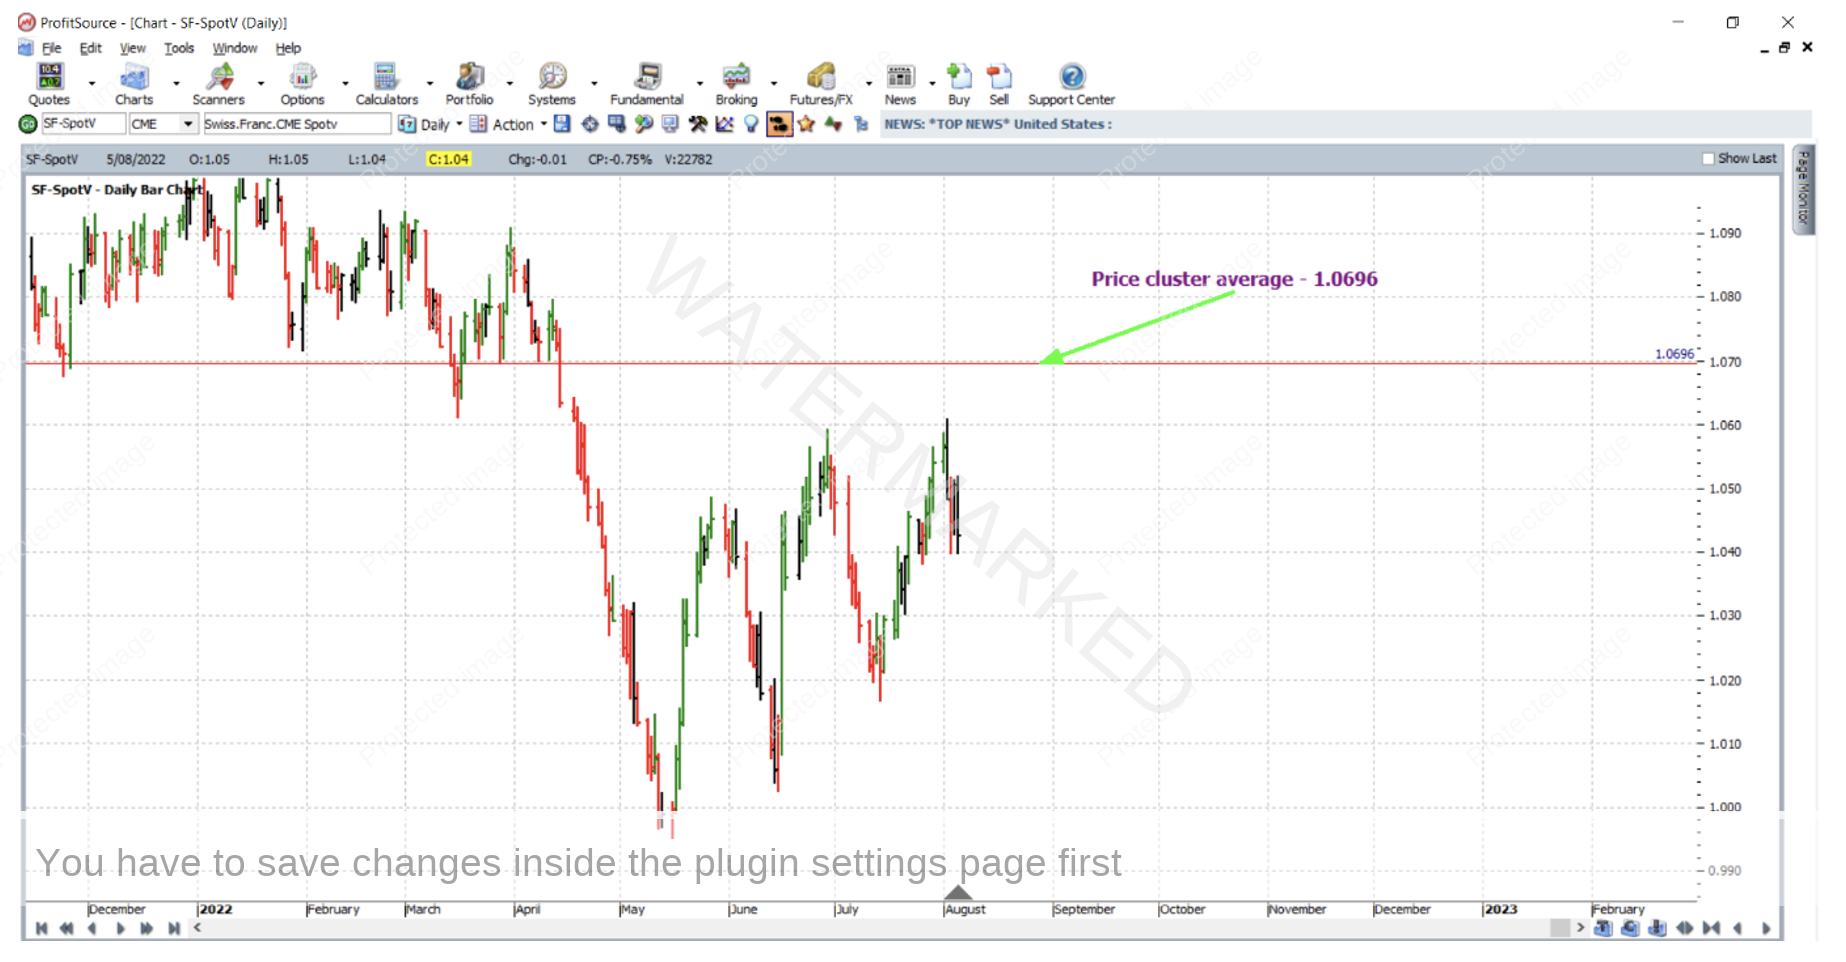
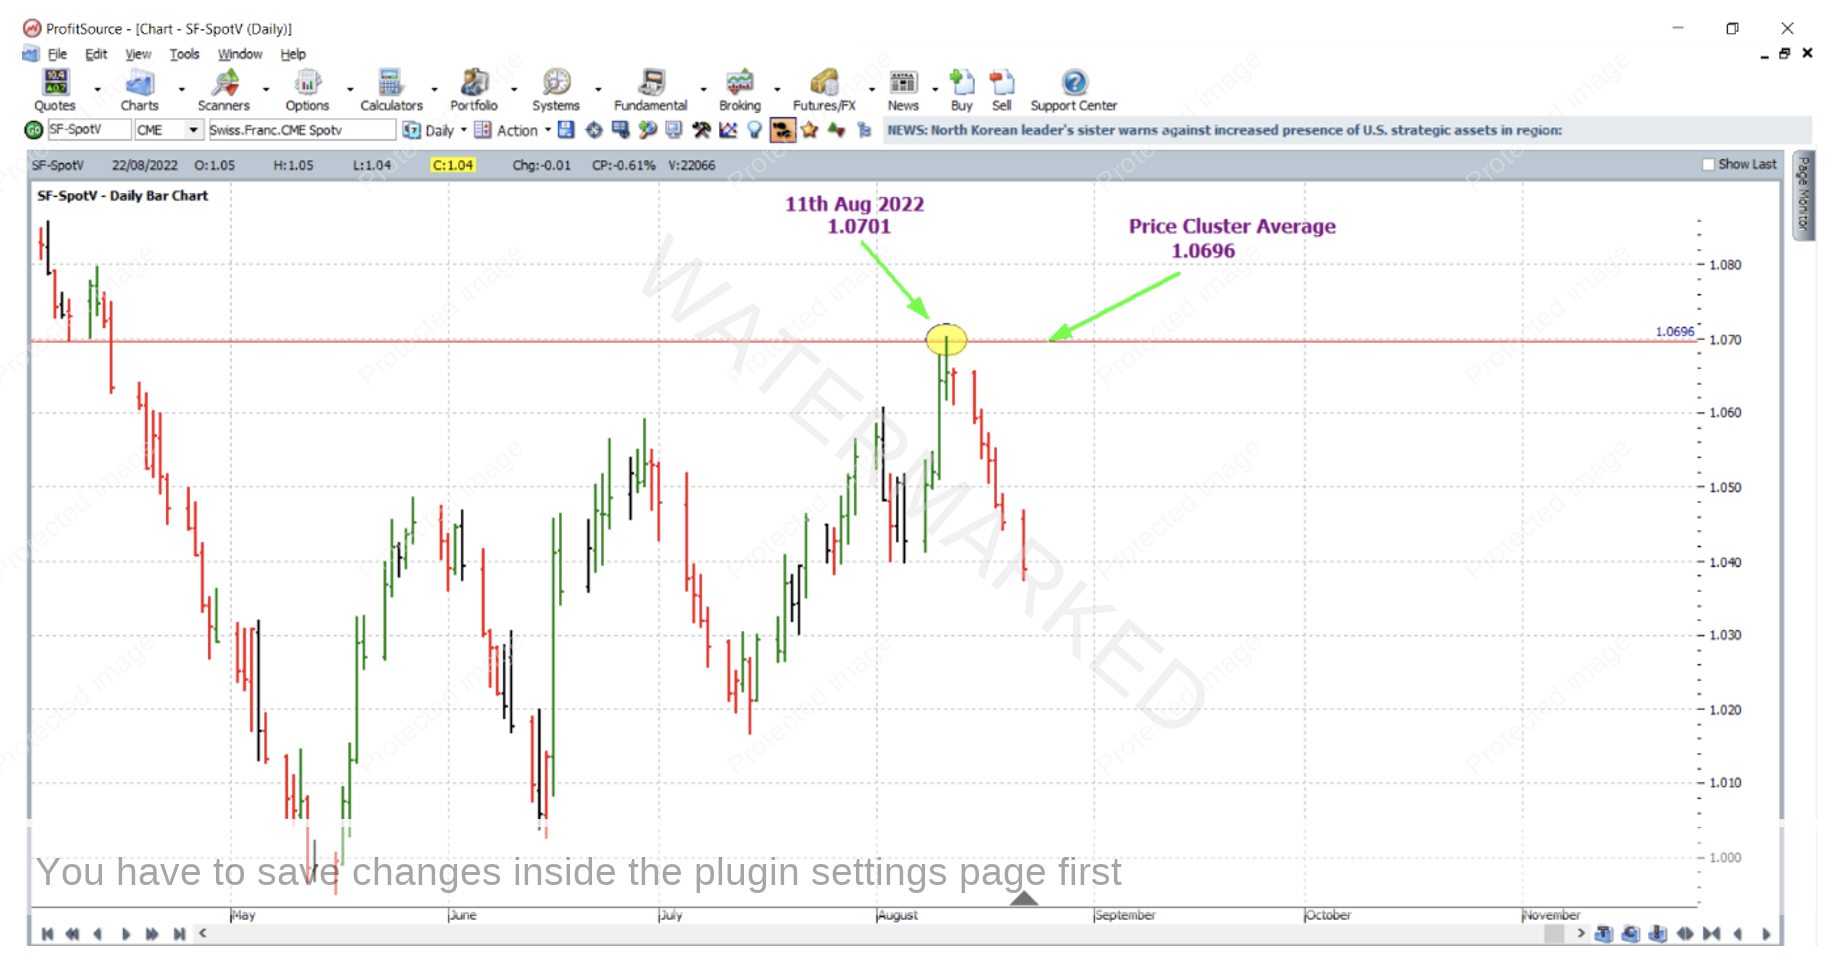
The question now asked by the technical trader, is of course, were there good enough reasons for this turn to be anticipated in advance? And if you apply your price forecasting skills, there were! As 11 August 2022 approached, three solid price analysis reasons had clustered together at an average of 1.0696. This is shown in the chart below in Walk Thru mode.
But it’s not a dead giveaway – see if you can determine how the cluster average was calculated yourself. Hint: One of the reasons was a strong application of the Ranges Resistance Card (Gann Retracement tool). Another was Repeating Ranges using the First Range Out (the ABC Pressure Points tool). Another (third) reason was a bit more subtle, and not as obvious or as strong as the first two.
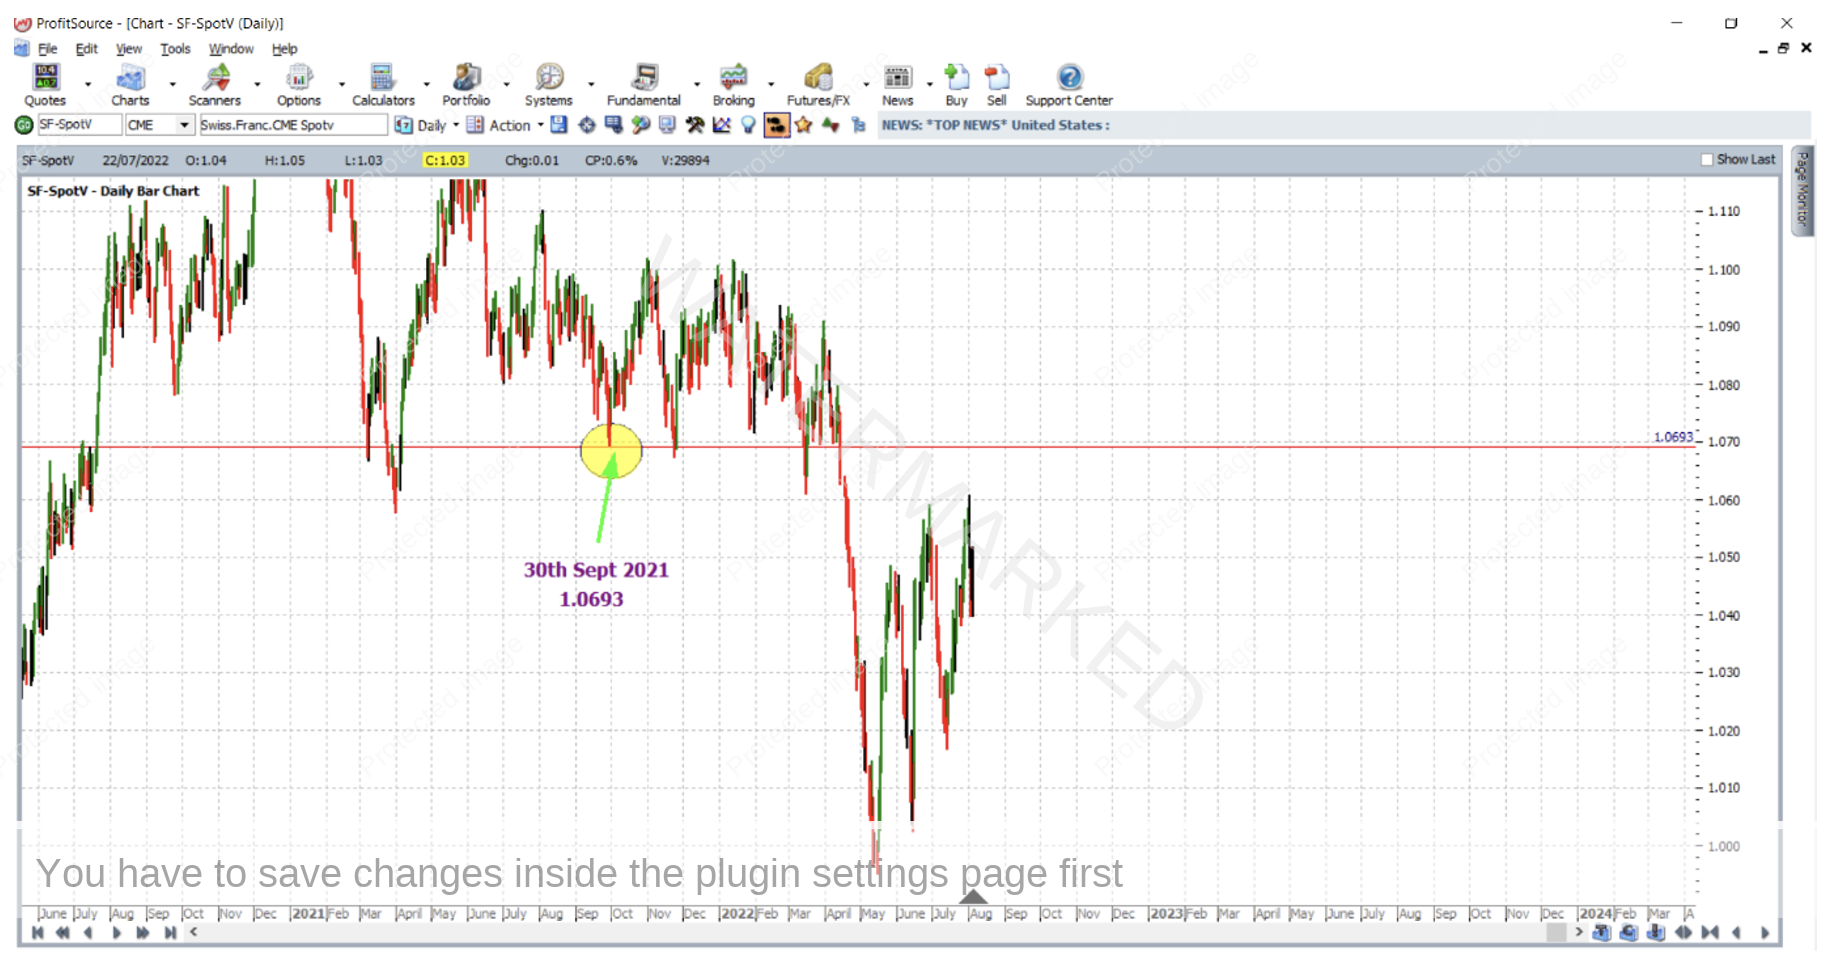
So here it is: Remember that old highs and lows in a market can offer support or resistance to future highs or lows. Ceilings become floors or floors become ceiling as they say. This piece of analysis is given in the chart below. The 30 September 2021 low of 1.0693 acted as potential overhead resistance in this way. This was one of the three figures that gave the cluster average of 1.0696.
Then on 11 August 2022 with the market topping at 1.0701, the cluster was false broken by a tolerable amount. 5 points as far as ProfitSource is concerned with each point still recognised as 0.0001; or 10 points as far as the CME Group exchange specs are concerned these days – with a point size of 0.00005). The strong reversal began to unfold.
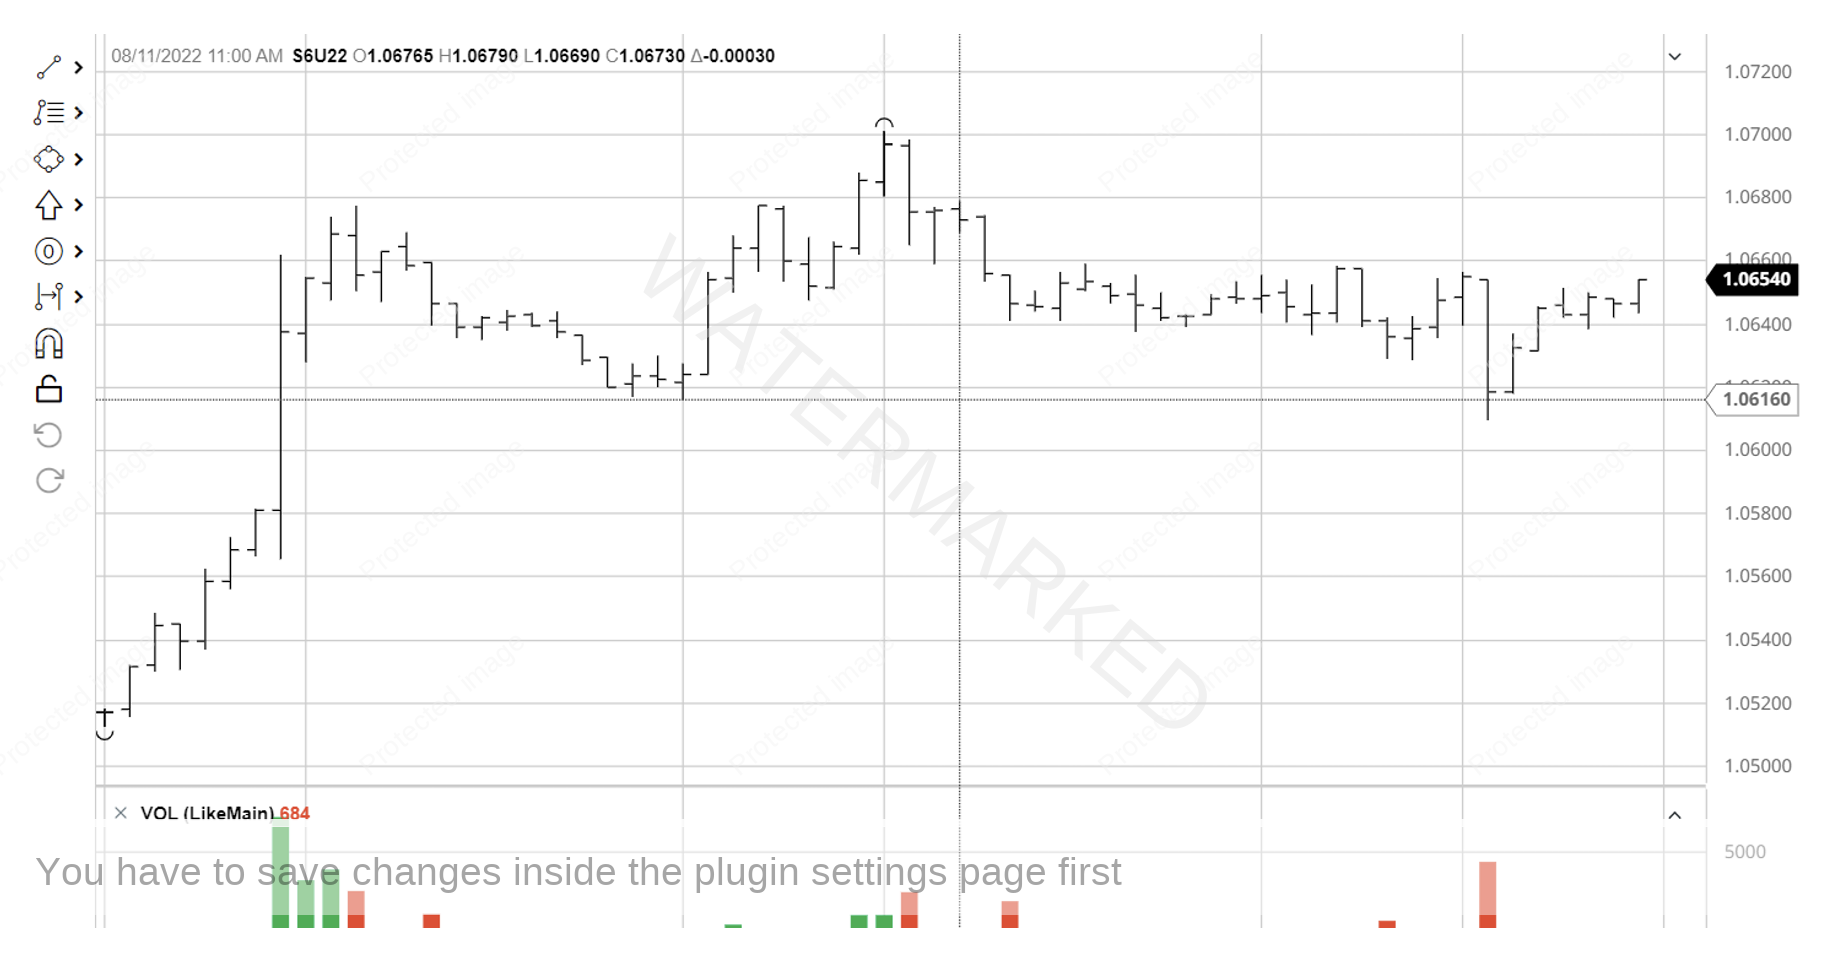
With strong enough reasons to get into the market we can look for an entry on the intraday chart. Soon after the top itself, a first lower swing top entry signal presented itself on the hourly bar chart with the 11am bar (Chicago time) being an up bar. This is shown below in the screenshot from barchart.com; the entry would have had you short Swiss Francs at 1.06685 with an initial stop loss at 1.06795.
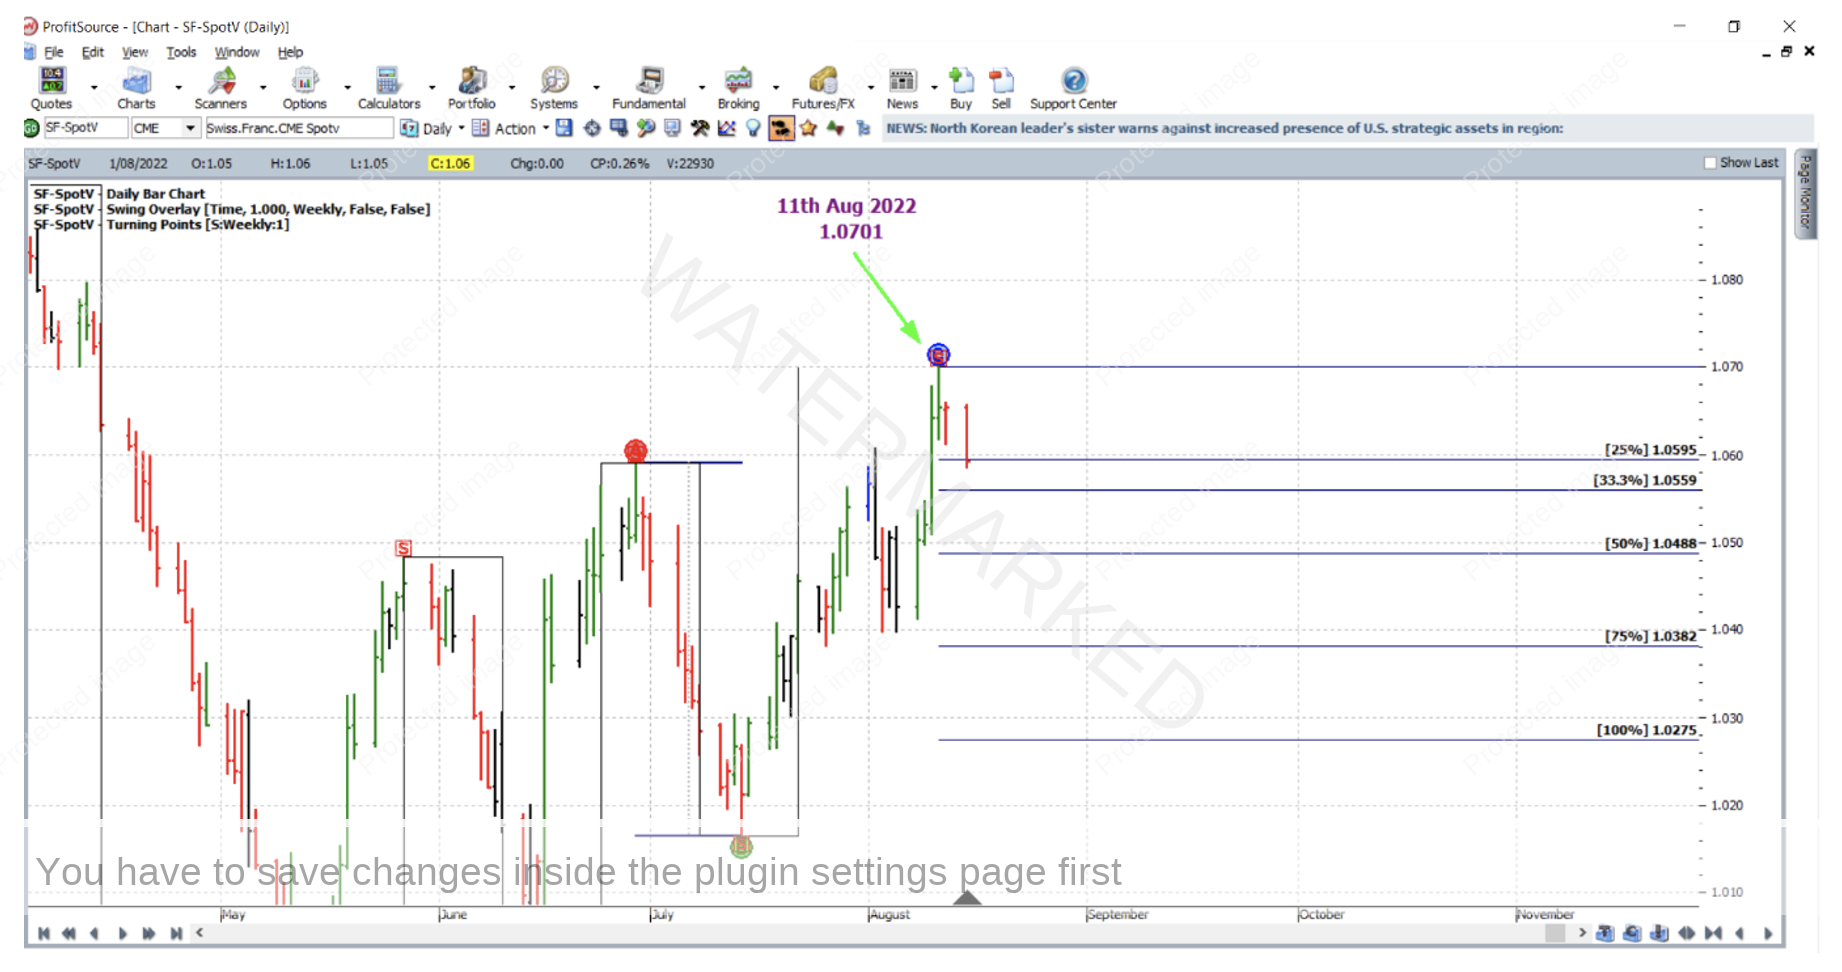
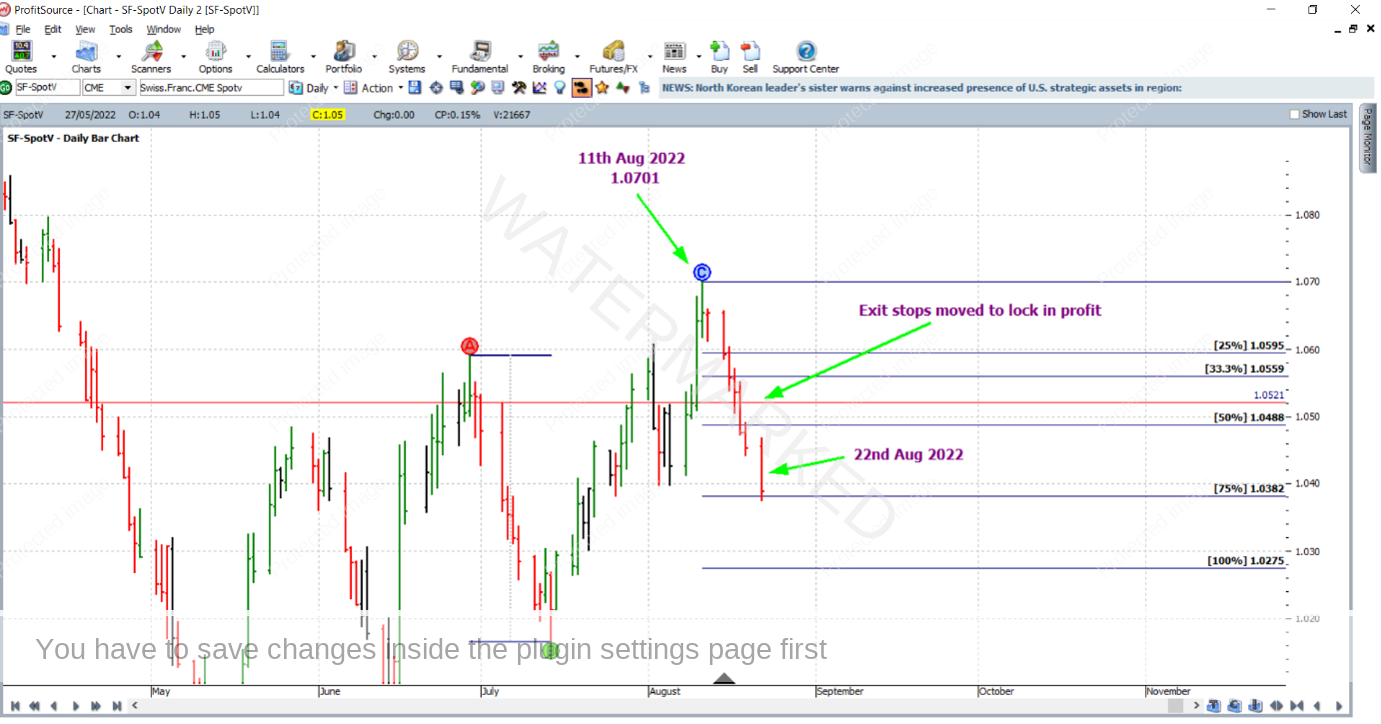
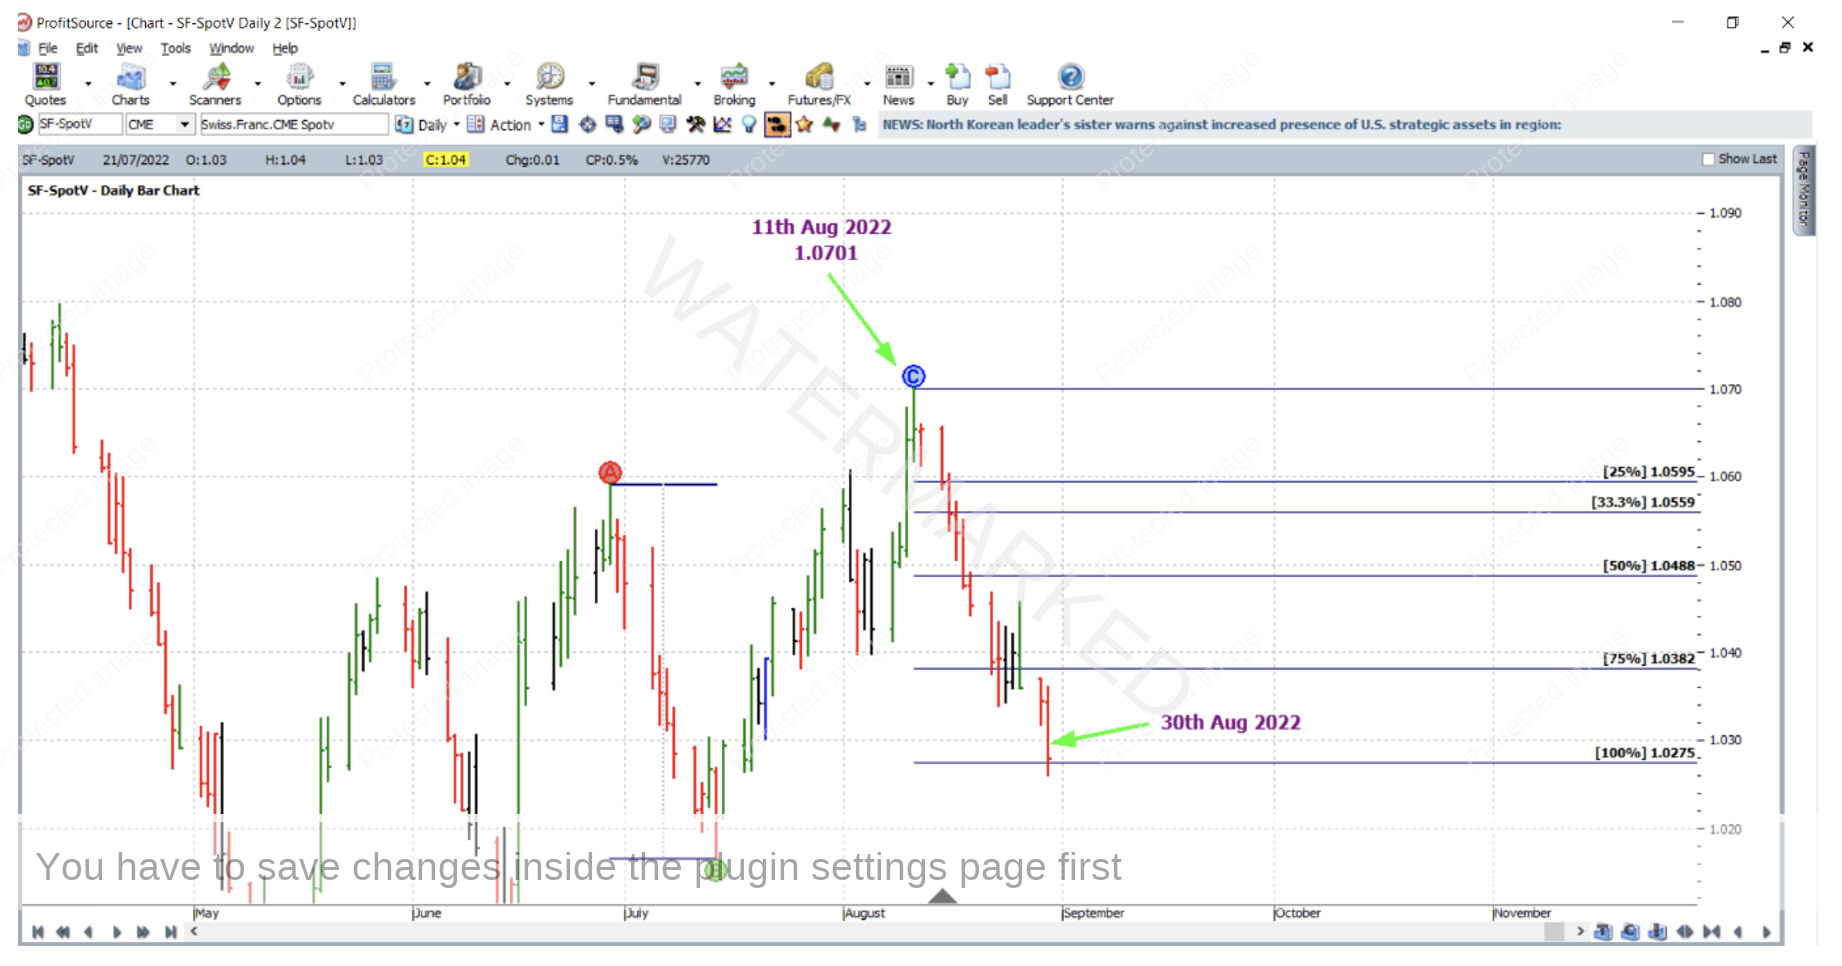
With entry being triggered, what about a reference range and a trading plan? For this the last weekly swing in the same direction was used, with stops managed Currency Style as though the trade was a bigger picture ABC. This is shown in the chart below with the aid of a few ProfitSource tools – the ABC Pressure Points tool, the Weekly Swing Overlay and the Weekly Turning Points Hi-lites.
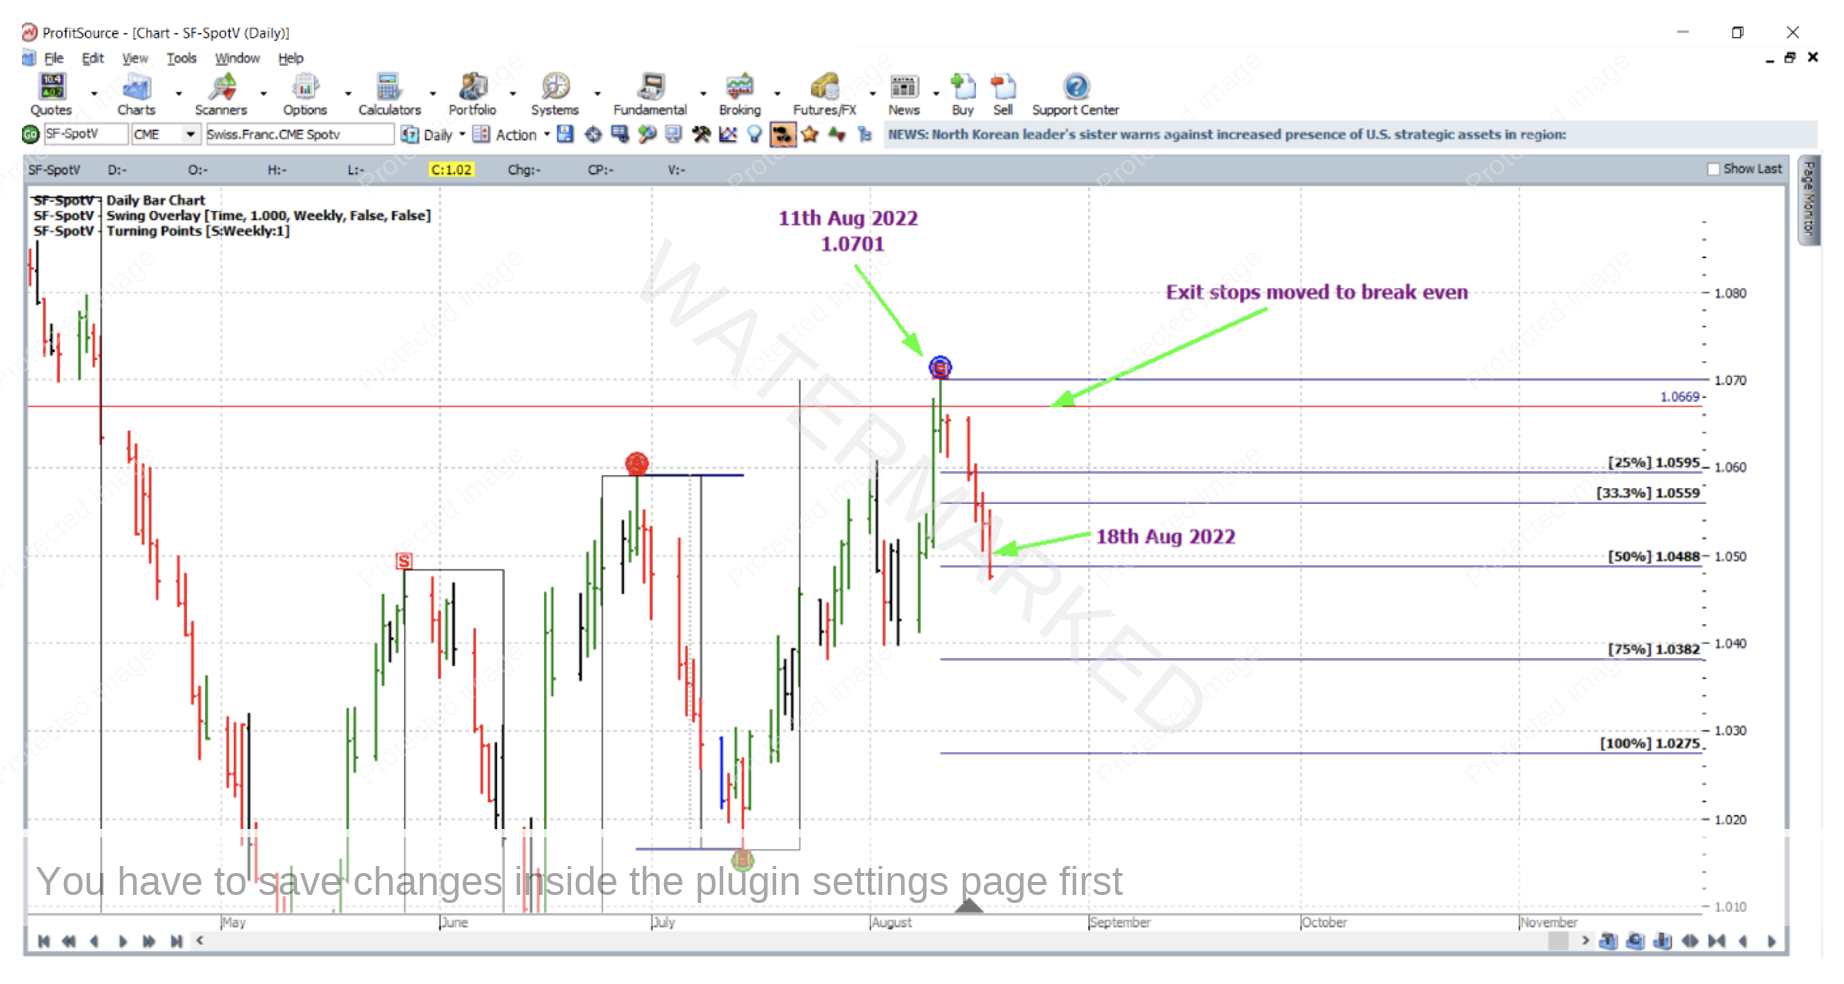
On 18 August 2022, the 50% milestone was reached and stops were moved to break even.
On 22 August 2022, the 75% milestone was reached and exit stops were moved to lock in some profit at one third of the average daily range (0.0330 based on the last 60 daily trading bars) above the 50% milestone, at 1.05210.
Then the 100% milestone was reached on 30 August 2022, with the trade closed at a price of 1.02750.
Now for a breakdown of the rewards. In terms of the Reward to Risk Ratio:
Initial Risk: 1.06795 – 1.06685 = 0.00110 = 22 points (point size is 0.005)
Reward: 1.06685 – 1.02750 = 0.03935 = 787 points
Reward to Risk Ratio = 787/22 = approximately 36 to 1
Because of the very small range of the hourly bar that was used to trigger entry, let’s assume that only 1% of the account size was risked at trade entry. In this case the gain in account size would be as follows:
36 x 1% = 36%
According to the specifications on the CME Group website, each point of price movement changes the value of one Swiss Franc futures contract by USD$6.25. So in absolute USD terms the risk and reward for each trade of the contract is determined as:
Risk = $6.25 x 22 = $137.50
Reward = $6.25 x 787 = $4,918.75
At the time of taking profit, in AUD terms this reward was approximately $7,140.
There are much cheaper ways to trade this market these days thanks to FX CFDs where the equivalent chart (symbol FXSFUS in ProfitSource) tracks its futures market sibling almost always within a point or two, making analysis and trade execution figures almost identical, only allowing one to trade with a much smaller position size.
If you would like to learn more about trading currencies, check out our free FX Trading Course on the Safety in the Market YouTube channel.
Work Hard, work smart.
Andrew Baraniak
