A Great Bull Market?
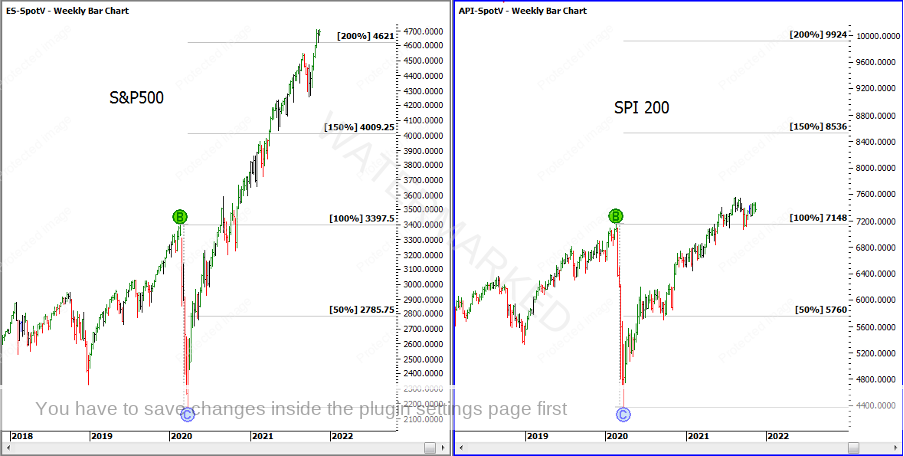
Welcome to the November edition of the Platinum newsletter. A quick recap of the SPI and again the weekly ranges on this market are really underperforming compared to some overseas markets like the S&P500. While the SPI is finding higher bottoms above the 20 February COVID high of 7148, the S&P500 clearly pushed through their COVID tops about a year ago. See Chart 1.
Chart 1 – S&P500 and SPI Comparison
While the SPI is underperforming against some markets, I still can’t help but ask, are we and other countries like the US, witnessing one of the greatest bull markets we’ve seen? Are we going to look back in a few more years and marvel at how far the market has run?
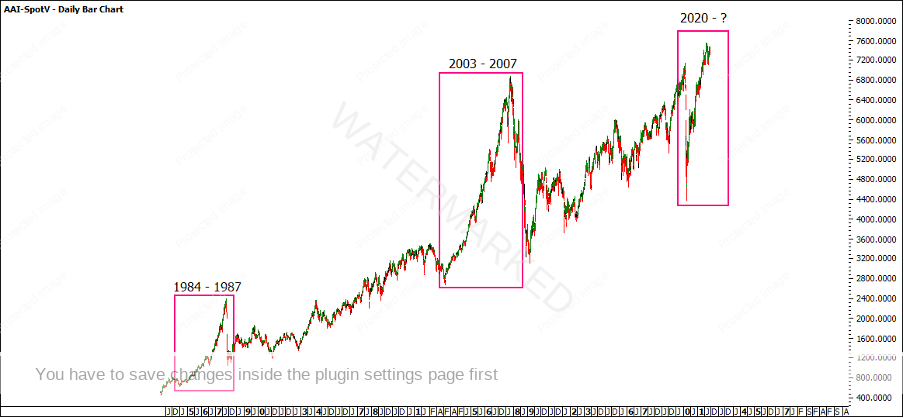
Looking over the history of the SPI there seems to have been two substantial bull markets that look similar to the current one in terms of small retracements and lack of clearly defined Sections of the Market. The first being from 1984-1987 and then again in 2003-2007. Of course, there have been other bull markets, but these share a similar resemblance in shape. See Chart 2.
Chart 2 – SPI Bull Markets
Today as I write this on 18 November, it’s 605 days since the 23 March 2020 COVID low. When I started comparing each of these bull markets I was looking at where 605 days sits in comparison. On 18 November the current close price on the SPI is 7367 points and therefore 1.6850 multiples of the 4372 COVID low (7367/4372).
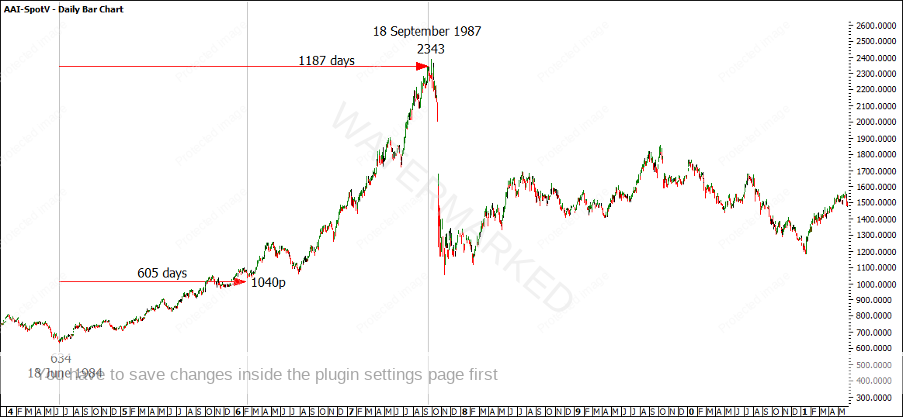
Perhaps just a coincidence but in 1986 at 605 days on 13 February, the SPI closed the session at 1040 points which was 1.64038 multiples of the 634 point low (1040/634). Therefore after 605 days, the SPI is currently sitting at near the exact same price position where the market was in 1986. Although I must note that in 1986 the market started to speed up whereas the current market looks to be slowing down rather than gaining momentum. The run from 18 June 1984 to 18 September 1987 finished at 1187 days and 3.6955 multiples of the 634 point low.
Chart 3 – SPI 1984-1987 Bull Market
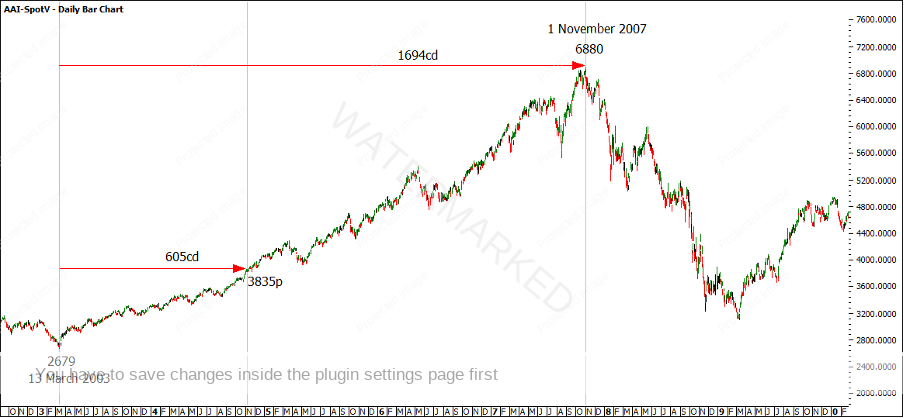
The 2003 to 2007 bull market lasted 1694 days and was 2.5681 multiples of the 2679 low it started from. At 605 days, the market closed at 3835 points which is 1.4315 multiples of the low. This bull market ran a lot longer in terms of time compared with 1984-1987. See Chart 4.
Chart 4 – SPI 2003-2007 Bull Market
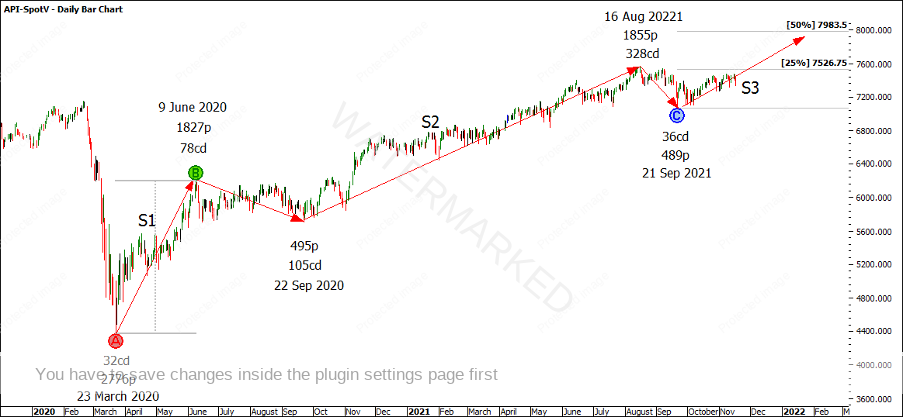
Bringing it back to the current market and Position of the Market, Section 2 is expanding in time and price and the pull back is contracting in time and price. I feel that unless the 21 September low is broken, we could be in Section 3 to the upside. If that is the case, then we know it’s possible to see 3-4 sections. See Chart 5.
Chart 5 – SPI Sections of the Market
Due to all the above, my bias is still bullish and as we are fast approaching Christmas and 2022, I’m thinking about the potential for a Christmas Rally.
As a friend put it, the SPI has a tendency to put you to sleep before taking off again and putting in a good run. Stay focused!
Happy trading.
Gus Hingeley
