The Indices
Welcome to the December Platinum newsletter. To all the Safety in the Market readers around the globe have a very merry Christmas and a happy new year.
Recently I’ve been looking at all the major Indices and how they fared over the course of 2021. For a comparison, most made a low around the December seasonal date in 2020. Taking that price to the current price at the time of writing, we’ve seen the S&P500 and the Nasdaq gain about 30% in value. The Nifty 50 has gained about 34% and has been a great looking market. But not all indices have performed so well. As we know, the SPI has underperformed the US and is only up about 15% from last year’s December lows and the FTSE is about the same. Also, some of the Asian markets haven’t performed as well, the Chinese stock index is up about 13%, the Nikkei225 is up about 6% and the Hang Seng is actually down about 7%!
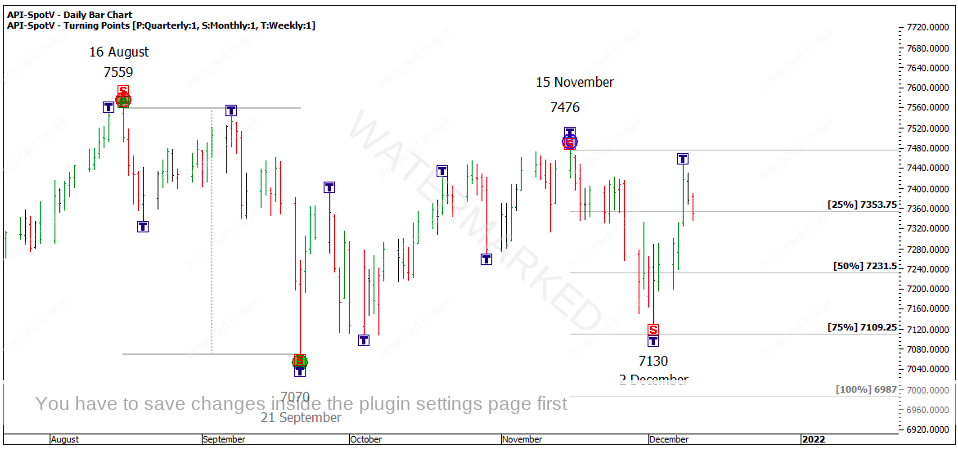
Looking at the SPI over the past month, we have seen a strong run down into the 2 December low, followed by a strong 6 days up. The 2 December low is now close to being a confirmed monthly higher bottom. If this happens, we are looking at a contracting monthly swing down that is sitting on the COVID tops of 7148.
Chart 1 – SPI Monthly
There was a fantastic cluster down around 7130-7160 that anyone with the Number One Trading Plan could have picked in advance. Multiples of the First Range Out on at least two different time frames was a key to being on top of this price cluster and well worth investigating.
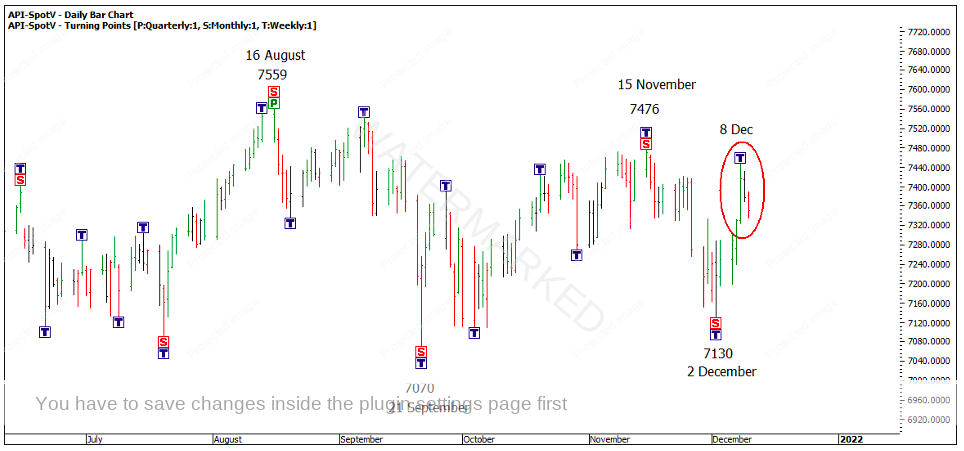
I felt that we might have been looking for a lower weekly top and another weekly leg down and as such, last Wednesday’s (8th December) strong up bar took me a bit by surprise! That one bar quickly changed my thoughts for the short-term direction of the market. The SPI now shows a daily swing up that has well and truly overbalanced and a weekly swing up which is currently about 150% of the previous swing up.
Chart 2 – 8 December
In the last article, I mentioned the Christmas rally. If you look over the SPI history, there is a very good chance that you’ll get a rally of some description, so perhaps the 2 December low is the start of it? Still, you don’t get paid for forecasting but you do get rewarded for good trading and being on top of your numbers.
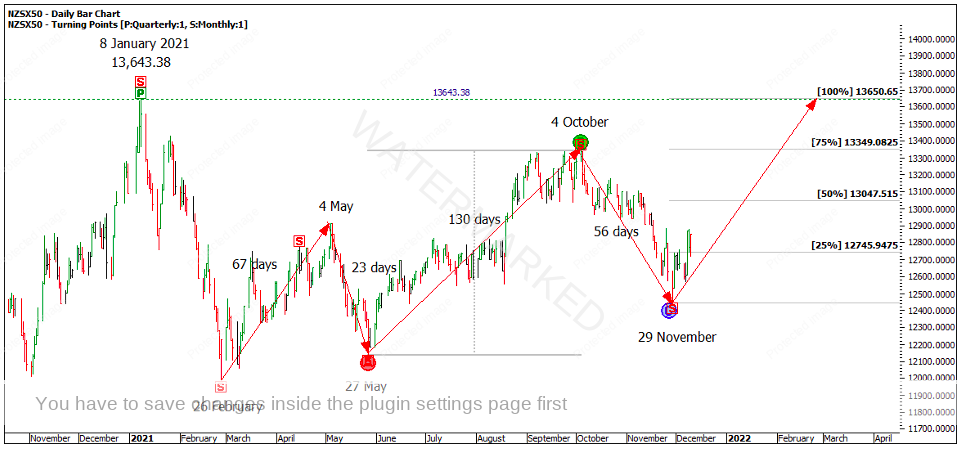
However this month I do want to move away from the SPI to finish off the year by taking a look at the rarely spoken about NZ50 index. As the name suggests, it’s the New Zealand’s stock index and its ‘Position of the Market’ is worth further investigation. If the 29 November low holds, this market would be into a 3rd monthly section up with a repeating monthly swing range clustering into a large double top with the 8 January 2021 high.
Chart 3 – NZ50
In Chart 3 above, you can see the 100% milestone just pips the 8 January top by about 7 points. You could also apply David’s First Range Out rule to add to the cluster that would be within less than half of one percent tolerance.
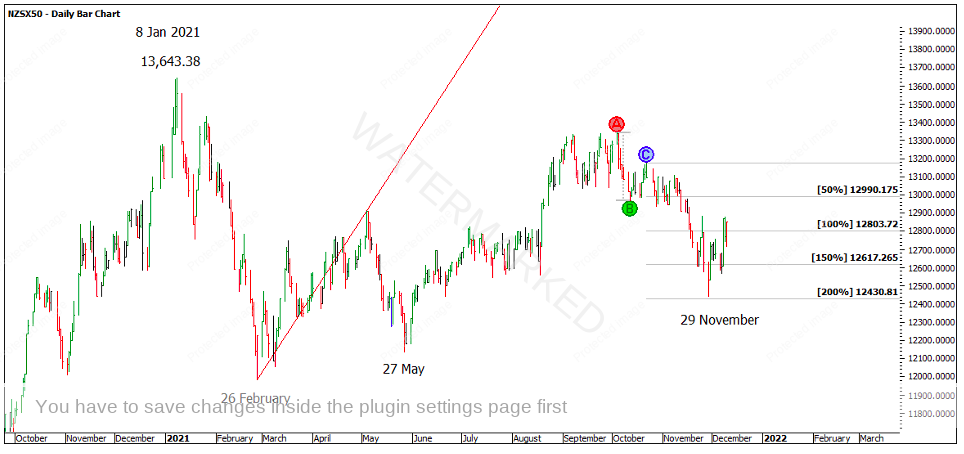
Still, we should take a step back and examine the 29 November low to check its validity as a Classic Gann Setup. I did this in hindsight, and in Chart 4 I’ve started things off for anyone that would like to continue. For a few clues, milestones, speed angles, Time by Degrees and day counts are all things that have worked well on this market.
Chart 4 – Classic Gann Setup
The nice thing about this setup is we are still within the ‘Summer’ of the trade and if looking to get long out of a cluster, there is still potential for a large Risk to Reward Ratio left if you want to trade into the potential double top.
I look forward to continuing the discussion on the NZ50 next year to see how it plays out. Until then I hope everyone has a very safe and happy Christmas and New Year period. I’ll be helping Mat out with our research project in the 2022 Master Forecasting Course Coaching so I look forward to working with many of you in 2022!
Happy trading,
Gus Hingeley


