The Individual Contract
This month’s article encourages the commodities trader to consider more than just the SpotV chart when doing analysis and looking for price clusters to trade. In particular we take a look at a price cluster that came about last year during early October. It is from the bar chart of the Cotton market’s July 2025 contract, symbol CT-2025.N in ProfitSource.
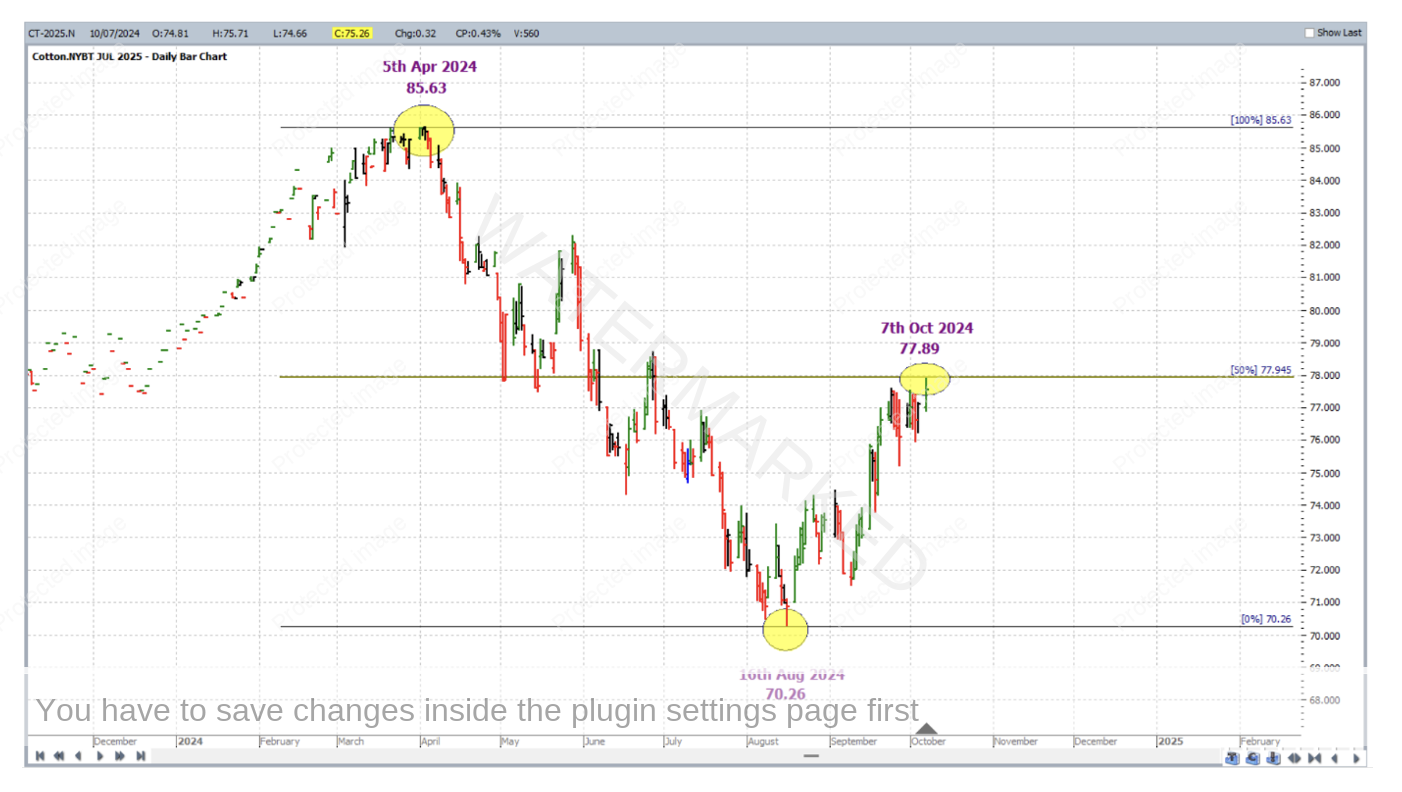
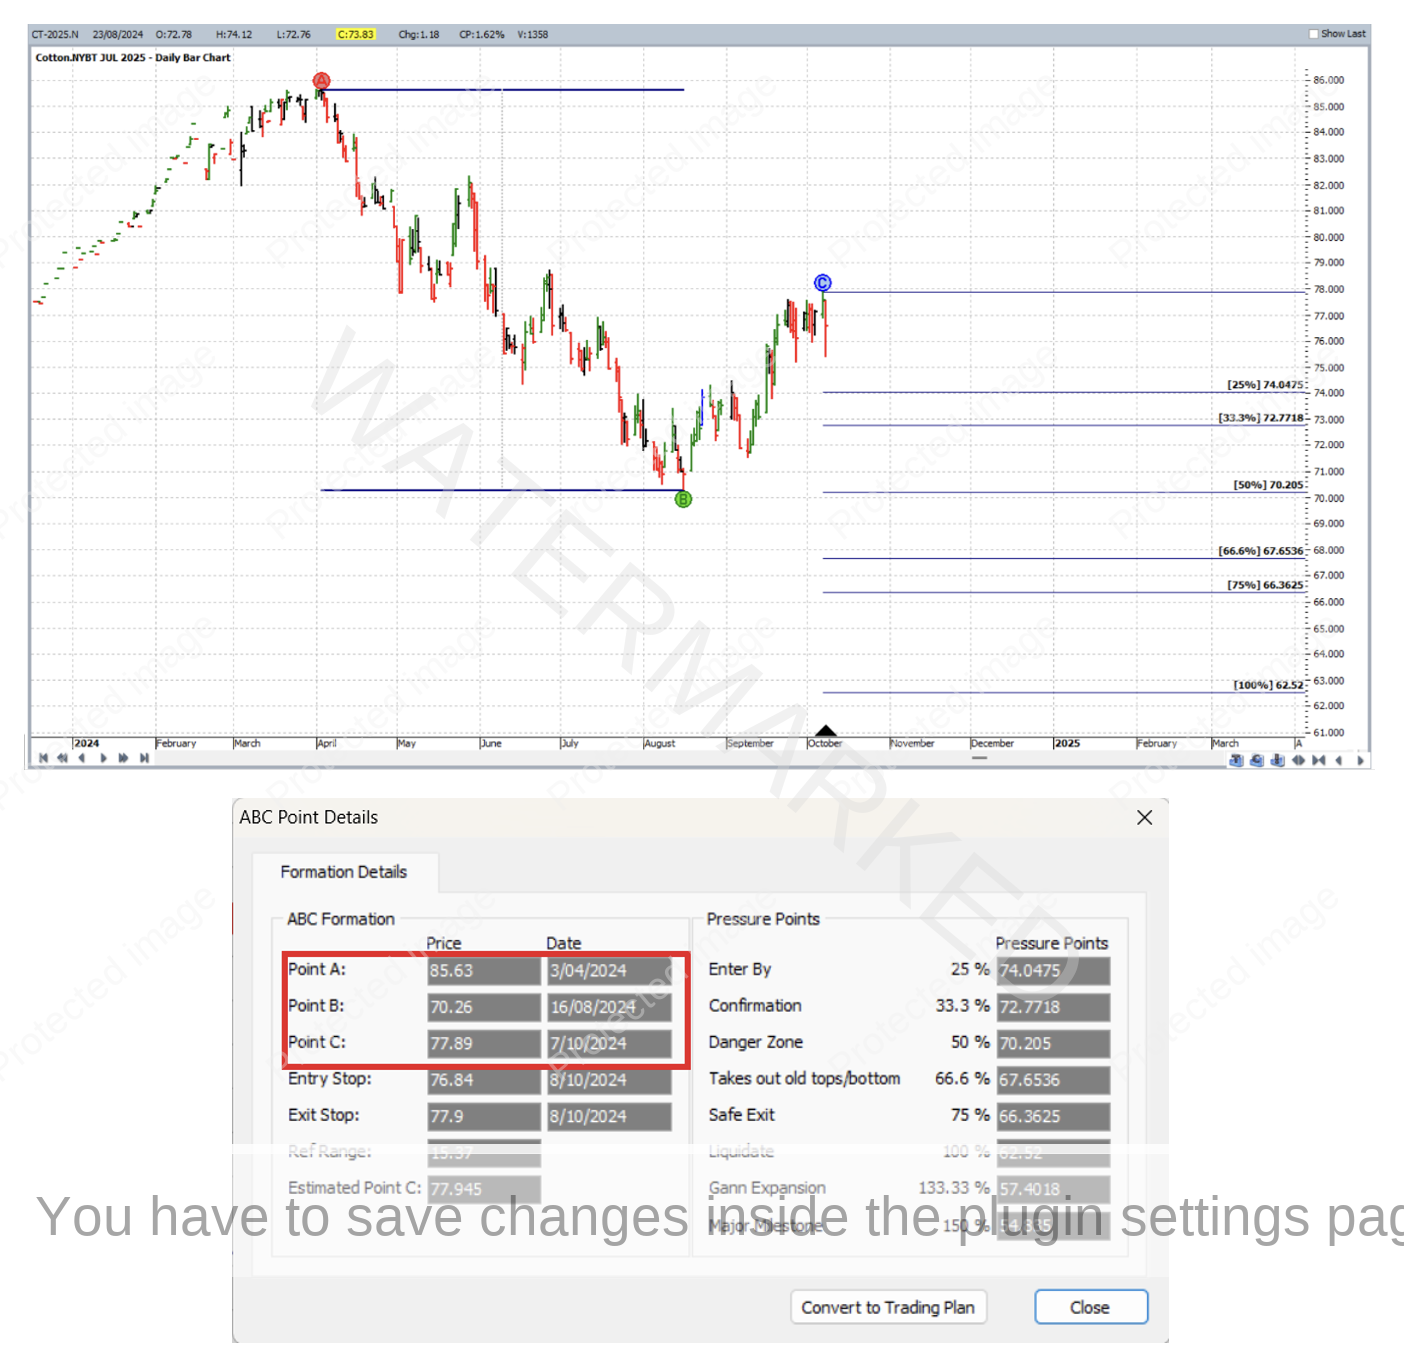
There were three inputs to the price cluster and these are outlined as follows. First of all, with a Ranges Resistance Card applied from the 5 April 2024 high (85.63) to the 16 August 2024 low (70.26), the 50% resistance level was 77.94 and as at 7 October 2024 the market was 5 points shy of that resistance level. This is shown in the chart below in Walk Thru mode.
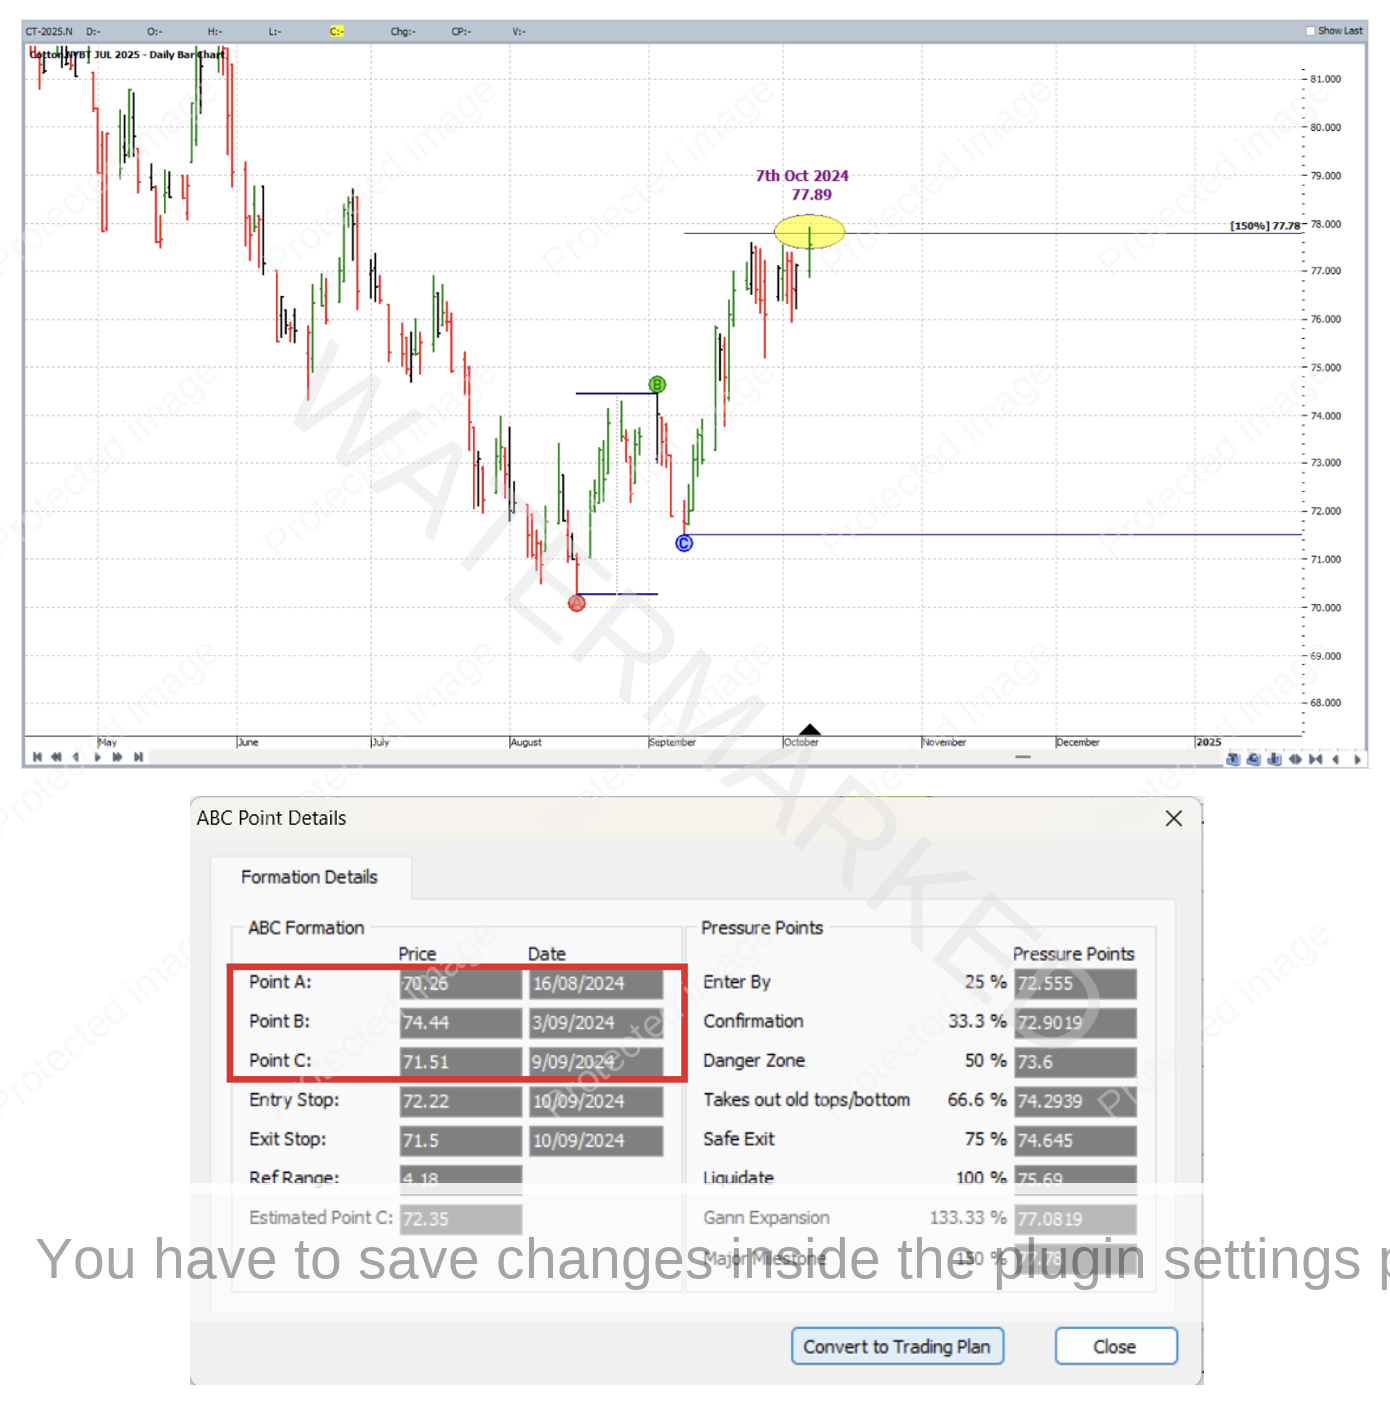
Next, we also note that as at 7 October 2024, the market had only given a small false break of the 150% milestone of the ABC Pressure Points application as shown below. Immediately below the chart itself is the “Details for this (ABC) Formation” pop up window (accessible by right clicking on any one of the lines of the ABC formation).
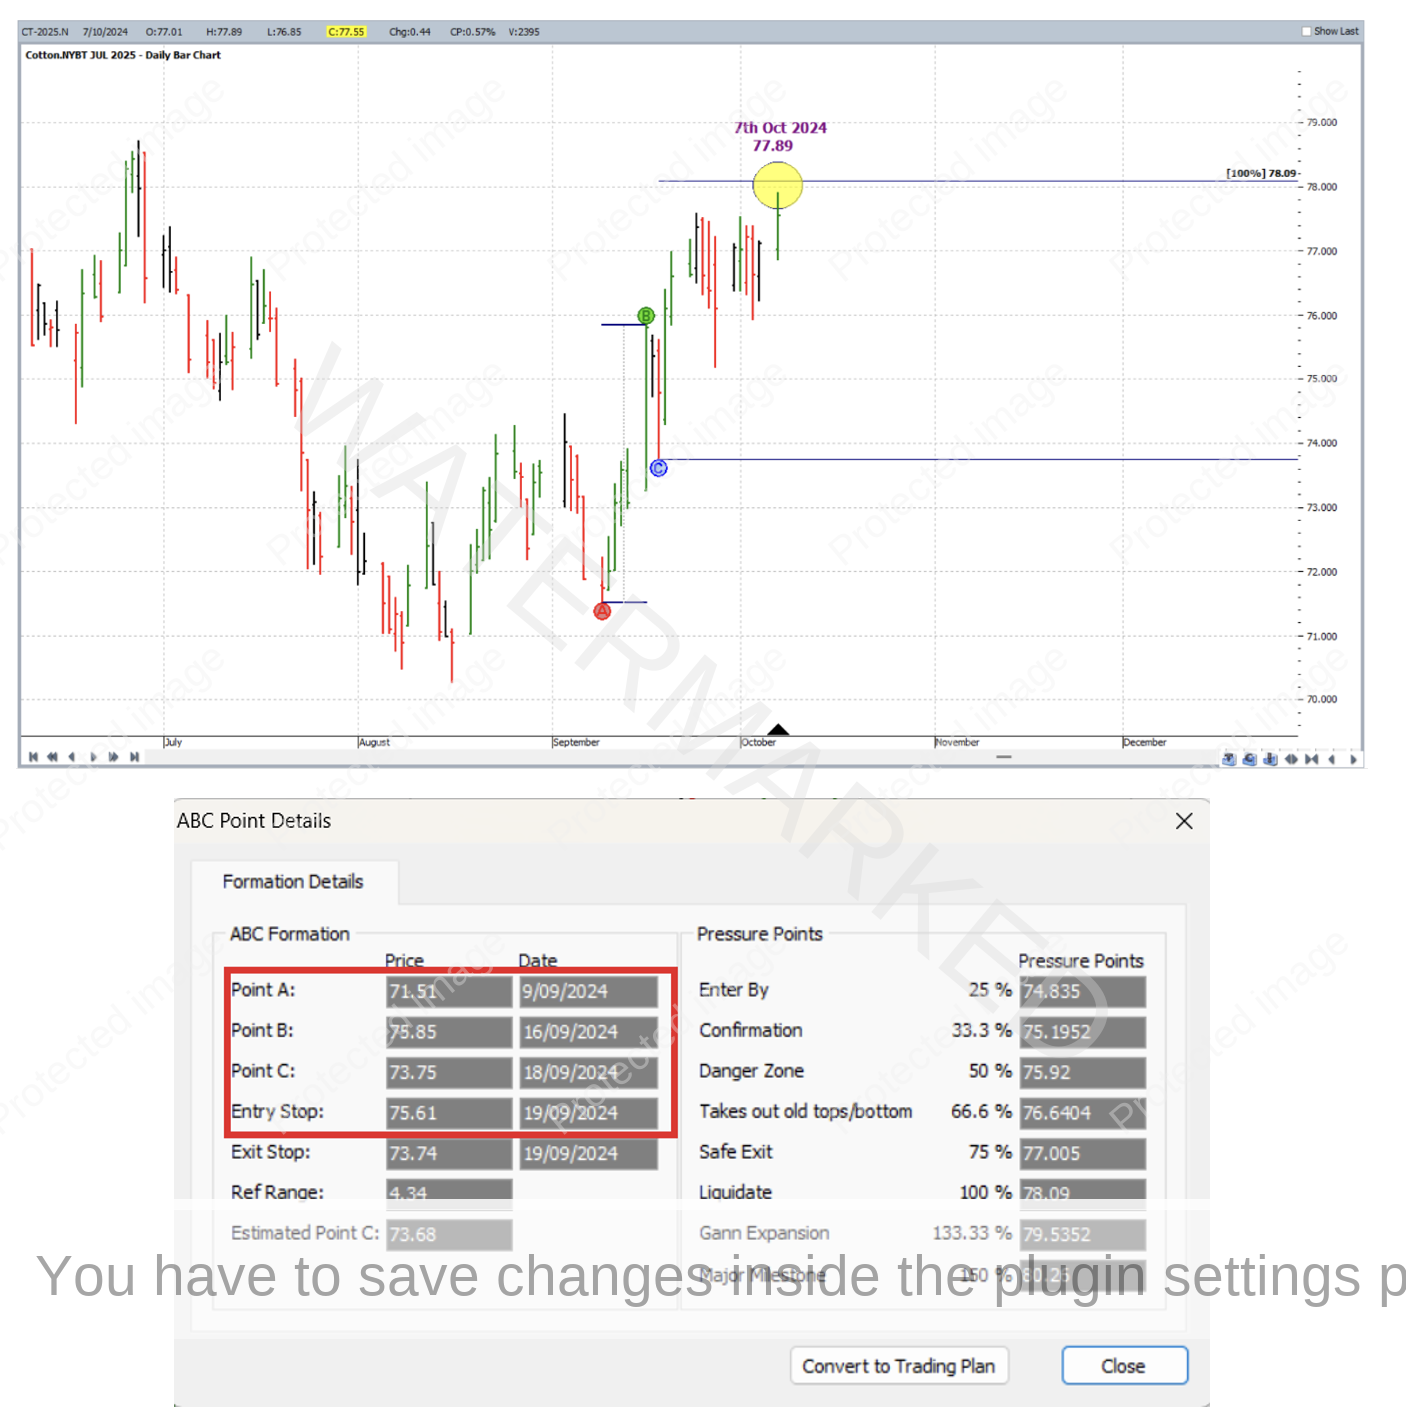
And the third input to the price cluster was another ABC Pressure Points tool application – this time our potential top falling a little shy of the 100% milestone.
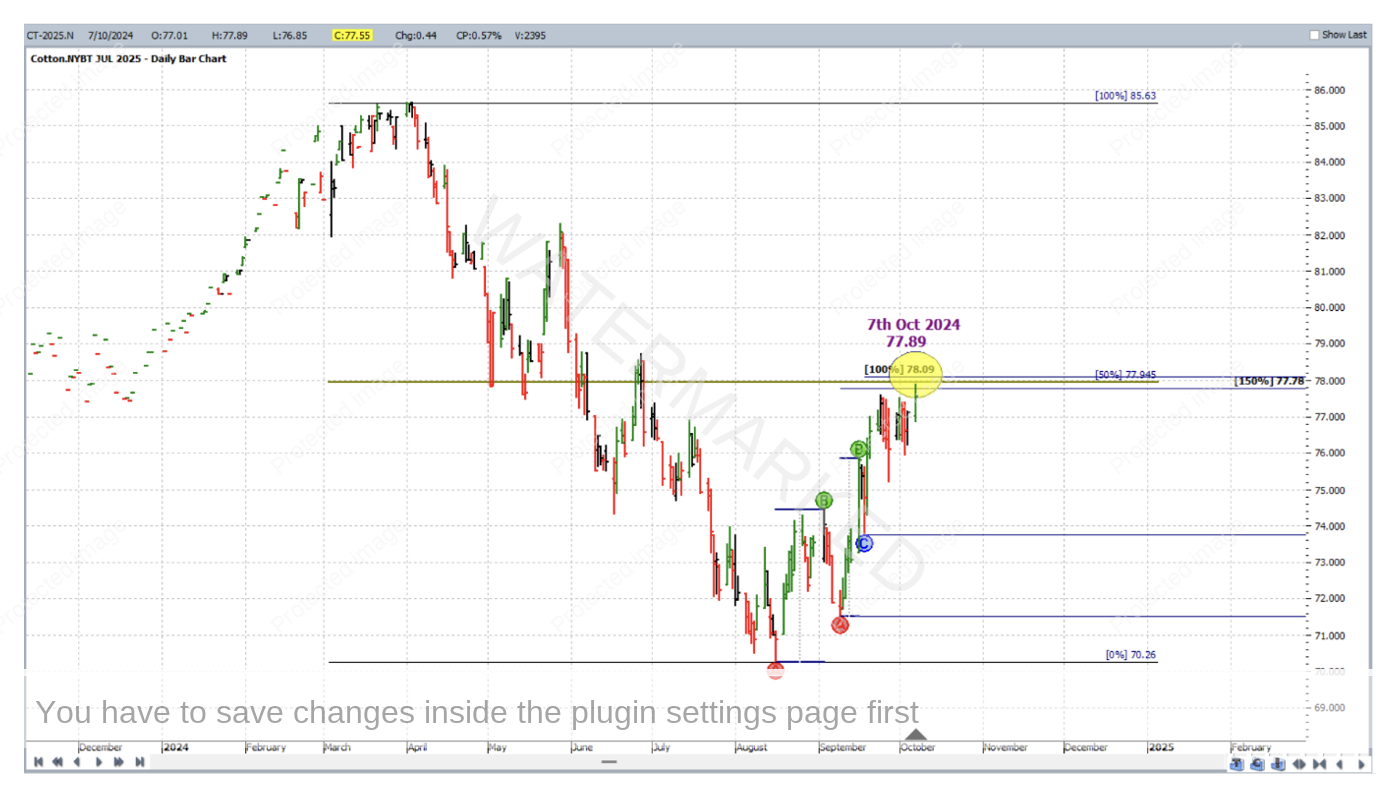
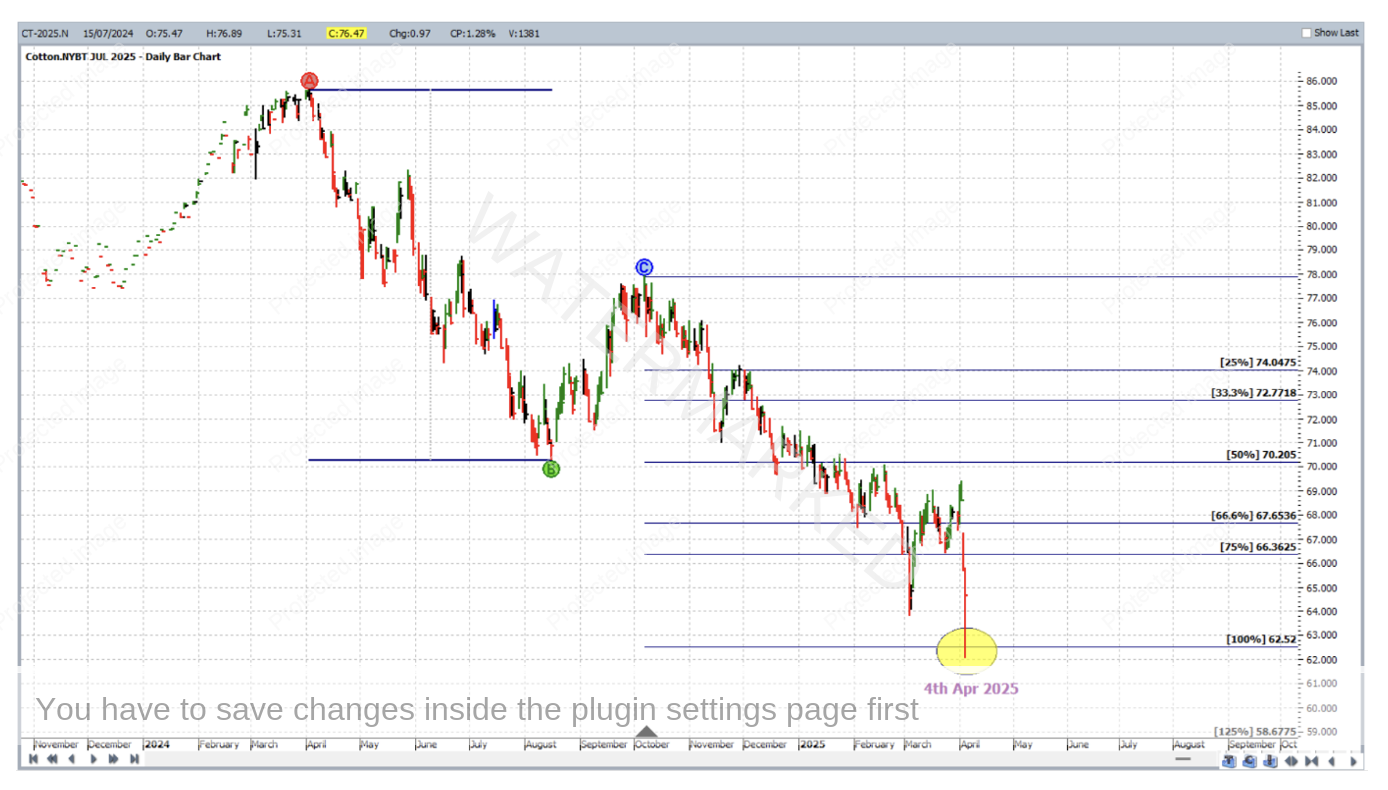
Shown below is how all three cluster inputs appeared on the one chart. The cluster itself averaged out at 77.93 which was only four points above the (potential at this stage) 7 October 2024 top, a small error in relation to the average size of a daily bar in this chart.
Now with enough reasons to trade, the turning down of the daily swing chart on 8 October 2024 had you short July 2025 Cotton at 76.84 with an initial exit stop at 77.90; As for trade execution, the AB reference range used was the same as that which had the Ranges Resistance Card from above applied to it.
Managing stops Currency style as though in a large ABC trade, profit was eventually taken on 4 April 2025 as the 100% milestone of 62.52 was reached.
To break down the rewards, firstly in terms of Reward to Risk Ratio:
Initial Risk: 77.90 – 76.84 = 1.06 = 106 points
Reward: 76.84 – 62.52 = 14.32 = 1,432 points
Reward to Risk Ratio = 1432/106 = approximately 13.5 to 1
According to the ICE website each point of price movement changes the value of one Cotton futures contract by $5 USD, so in absolute USD terms the risk and reward were:
Risk = $5 x 106 = $530
Reward = $5 x 1432 = $7,160
At the time of taking profits, the reward in Australian Dollars was approximately equal to $11,600.
If 5% of the account size was risked across the range of the 7 October 2024 bar at trade entry the percentage change to the account would be as follows:
13.5 x 5% = 68% (approximately).
A slow trade, but worth the wait for a decent gain to the account?
Work hard, work smart.
Andrew Baraniak