The Inflation Issue
Economics is a funny game when compared to other endeavours of life like say medicine, law, or just about any other occupation. When looking down the road towards future challenges we can often identify that issues will occur but timing them is the greatest of challenges. When you are unwell you are or you’re not, in law its legal or it’s not. When guiding economies in what is now an interlinked global pattern, things like inflation should have been a problem many years ago but it has taken COVID to stir the inflation genie and now the guess is, will it be a problem or not?
The extent that the money supply has grown since the GFC suggests that inflationary pressures should have long ago been felt in the everyday economy. The interesting fact is it hasn’t, and in places like Australia wages growth has also been very static which leads us to the now. You may ask why this is important to us as traders? If you trade commodities, then inflation can drive trends in commodities like we see in greed fuelled stock market runs. The price moves higher because people see the prices move higher. Commodities, in most cases, provide a function in the real economy so when people perceive a shortage or a glut then prices are impacted.
Globally we are seeing the effects of COVID lockdowns impacting the shipping space with the cost to move containers around the globe nearly tripling. There is also a shortage of containers in different countries to move goods in. Added to this now the rebound in demand as countries like Australia attempt to reopen, this leads to the issues we are seeing now where the prices of goods and in some cases labour increase, often rapidly.
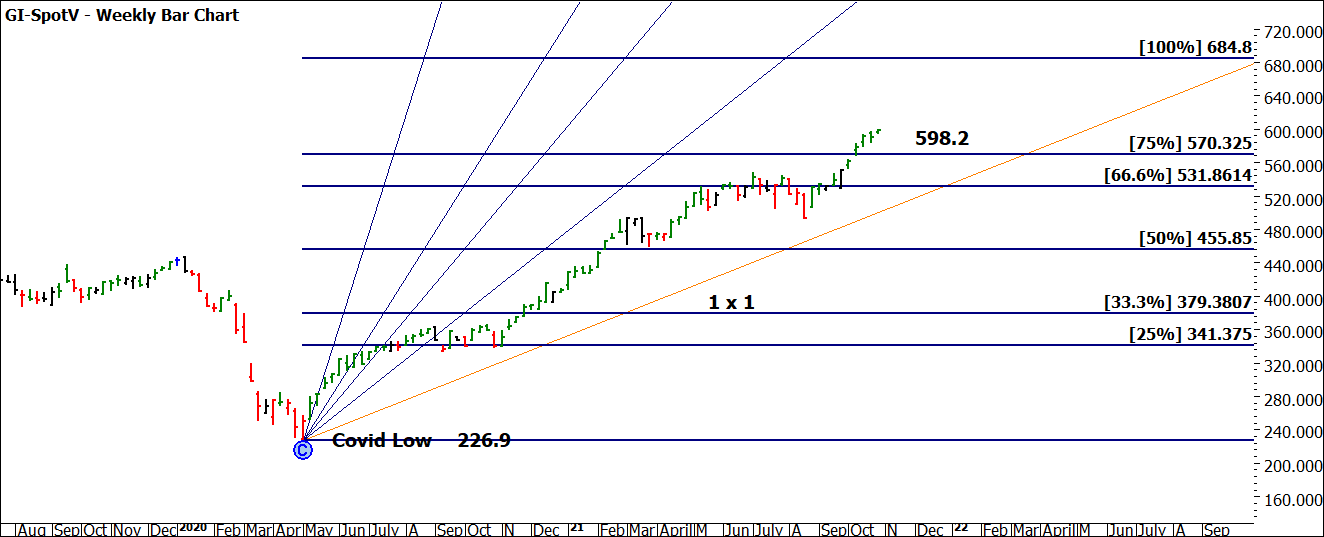
The best way to show the overall impact of commodities prices rising is the Goldman Sachs Commodities Index. Since the 2020 COVID low the market has nearly tripled in value, tracking well above the 1 x 1 angle. I have also included the range of the 2008 bull market and we can see we are approximately 75% of that range. That move ran for approximately 30 months, so the speed of this move is considerably quicker.
Chart 1 – Weekly Bar Chart Goldman Sachs Commodities Index
We have buffers in the economy to dampen the effect of these inflationary moves, the free-floating currencies the world uses are designed to mute some of these pressures, as long as your currency appreciates in relation to the currency that commodities are primarily priced in which is US Dollars.
We have seen a stronger US Dollar against the Euro, Yen, and others, and the good news is the Aussie dollar has crept higher but not yet significantly against the US Dollar. You should create a quote list of the major currency pairs against the US Dollar to identify the recent moves. It can open more opportunities to examine.
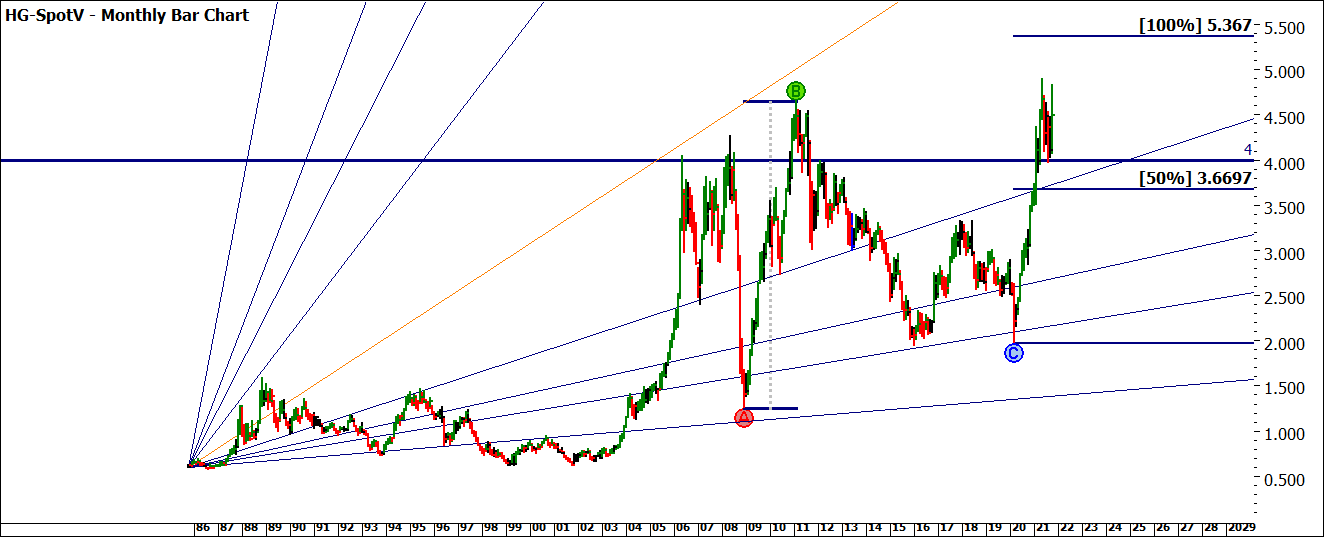
The obvious market we could look at is Crude, it has increased from a negative value in 2020 to $US85 in recent days, the effect at the petrol pump is apparent as I drive around my neighbourhood. The market I want to reflect on today is the Copper market, a very industrial metal that has many practical uses and one we have followed here before. Chart 2 shows the current position of that market.
The level of $4 per pound has historically been a resistance but now we see it acting as a support area. Using the 2008 bull market as a reference range, there may be a little bit more to run out of this trend with the 100% milestone at $5.367.
Chart 2 – Monthly Bar Chart High-Grade Copper
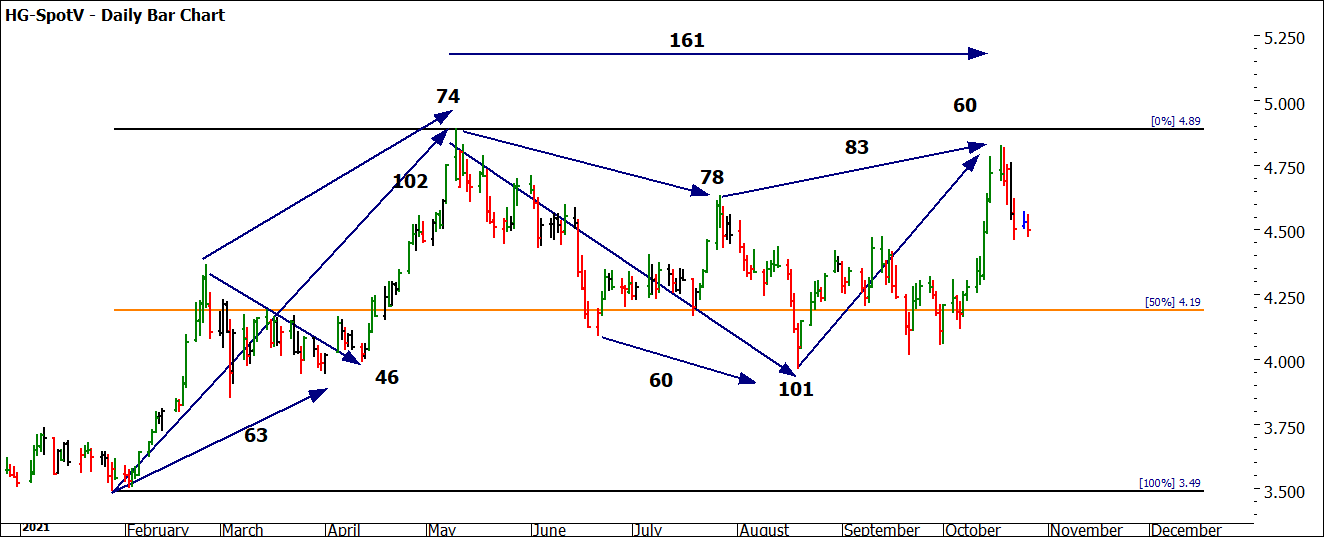
If we zoom in to the smaller picture, we can see a recent setup that allowed us to enter the market long. Before we jump into that setup, Chart 3 identifies a number of calendar day time frames that have been repeating (or very close to it). I have also included the 50% level of the February to May range as a basis for any pullback.
Chart 3 – Daily Bar Chart High-Grade Copper
The best way to tackle your understanding of this chart is to recreate the time counts yourself so you can see the story unfold. When looking for time frames, you need to remember ideally a 100% repeat is ideal but using percentages like 50% is equally valuable.
From a price perspective, the 50% level is always one we can watch for a reaction. In this case, we could also combine the notion of multiple bottoms at the same level and Gann’s fourth attempt concept.
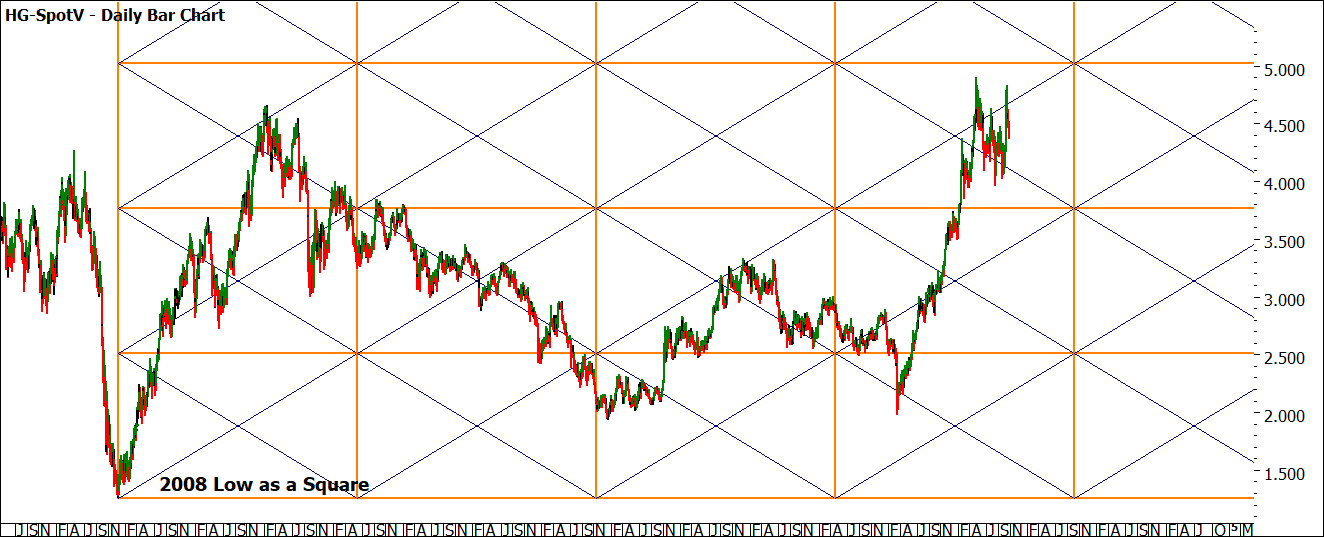
Chart 4 has been very valuable over the years using the 2008 low as a market square (1.255). This chart shows the big picture since 2008 and the general moves the market has made in line with this square.
Chart 4 – Daily Bar Chart High-Grade Copper
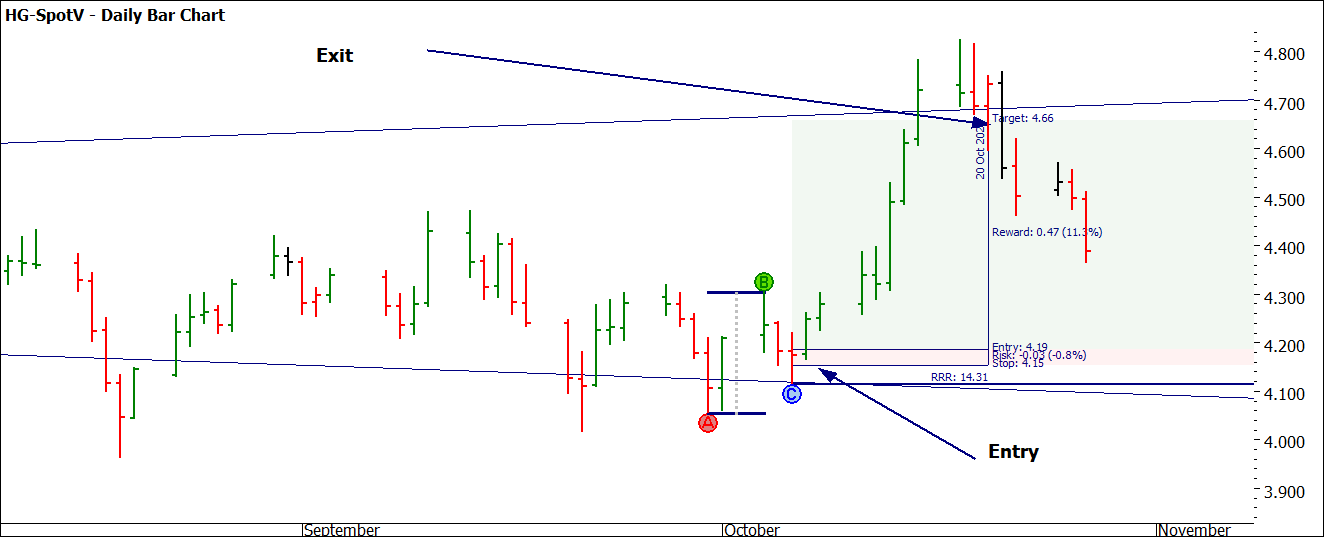
Chart 5 zooms into the small picture and identifies how the main diagonal has worked as a support point. There was the option of multiple entry opportunities prior. I have identified a first higher bottom trade that used the Openers Rule as the signal and stops trailed behind the lows of each session with a price filter.
Chart 5 – Daily Bar Chart High-Grade Copper
This entry as a higher bottom on the swing chart lined up with the bigger picture and small picture. The entry was above the square diagonal and could have been managed multiple ways. There was a concern of the “other” diagonal in the square offering resistance which it has since done so tight stops around this level paid off.
In all a Reward to Risk of approx. 14 to 1 was a good payoff for stalking this setup.
There are so many “commodity” markets that are ripe for review, that combined with the backdrop of inflation, I recommend you to research these markets and look for opportunities in this space as the cycles suggest rich pickings.
Good Trading
Aaron Lynch
