The Last Fifty Percent?
45 Years in Wall Street, Chapter 4, ‘Percentage of High and Low Prices’. Part of this lesson is how to calculate the percentages of high and low prices and how important they are to watch as they act as support and resistance.
“One of the greatest discoveries I ever made was how to figure the percentage of high and low prices on the averages and individual stocks”
P30, 45 Years in Wall Street
An interesting statement after 45 years in the game!
W.D Gann’s instructions are to divide any high or low price by 8 to get the 12.5% resistance levels running up or running down from major tops or bottoms. 50% is the most important resistance point of any high or low. Second of importance is 100% of any high or low. Third of importance is the 25% and 75% levels. Fourth importance is the 12.5%, 37.5%, 62.5%, and 87.5% levels, and the fifth important level is the 6.25%.
This lesson increases in value if you print out a monthly bar chart of the Dow Jones from 1910 to the end of 1949 and label every single price pressure point mentioned. This chapter is only 9 pages but is good bang for your buck!
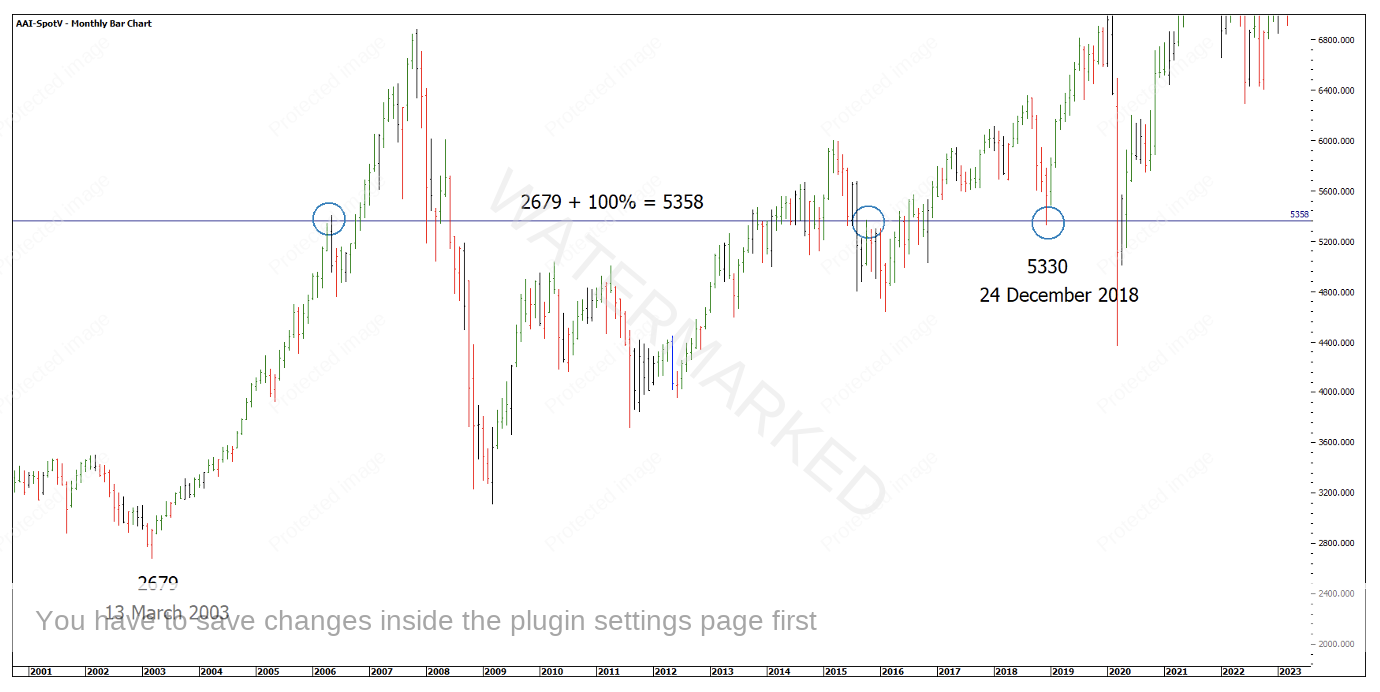
Recent examples on the SPI200 are as follows. By adding 100% on the 13 March 2003 yearly low of 2679 you get a figure of 5358. The SPI200 made two monthly swing highs at this price level before the 24 December 2018 yearly swing low of 5330 found this as support. See Chart 1 below.
Chart 1 – 100% on 2003 Low
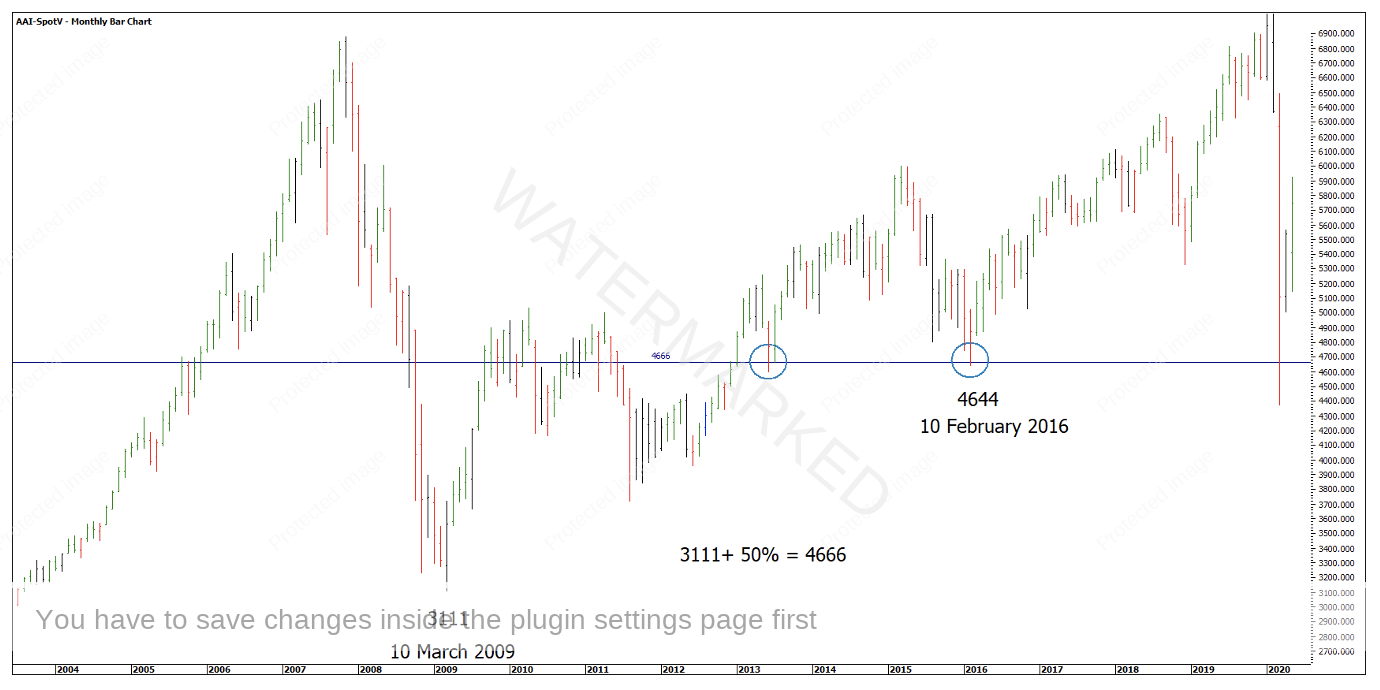
Adding 50% to the GFC low of 3111, you get a figure of 4666. The 2016 yearly low was made on this price level at 4644.
Chart 2 – 50% on 2009 Low
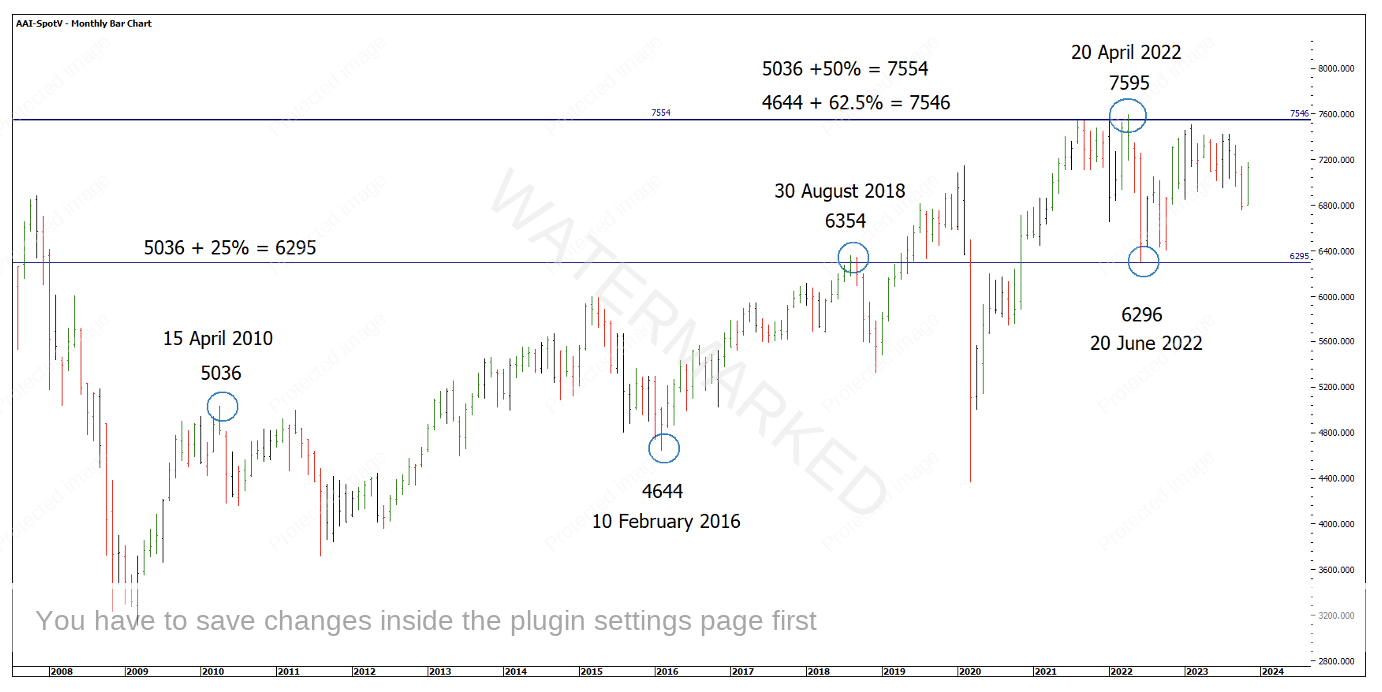
Adding 25% to the 15 April 2010 yearly high of 5036, you get a target of 6295. The 30 August 2018 yearly high at 6354 found this level as resistance. More recently, the 20 June 2022 low of 6296 is within 1 point and found this level as support! See Chart 3 below.
Adding 50% to the 15 April 2010 yearly high of 5036, you get a price of 7554, within 40 points of the current All-Time High made on 20 April 2022. Also, adding 62.5% to the 10 February 2016 yearly low gives 7546.
Chart 3 – 25% and 50% on 15 April 2010 High
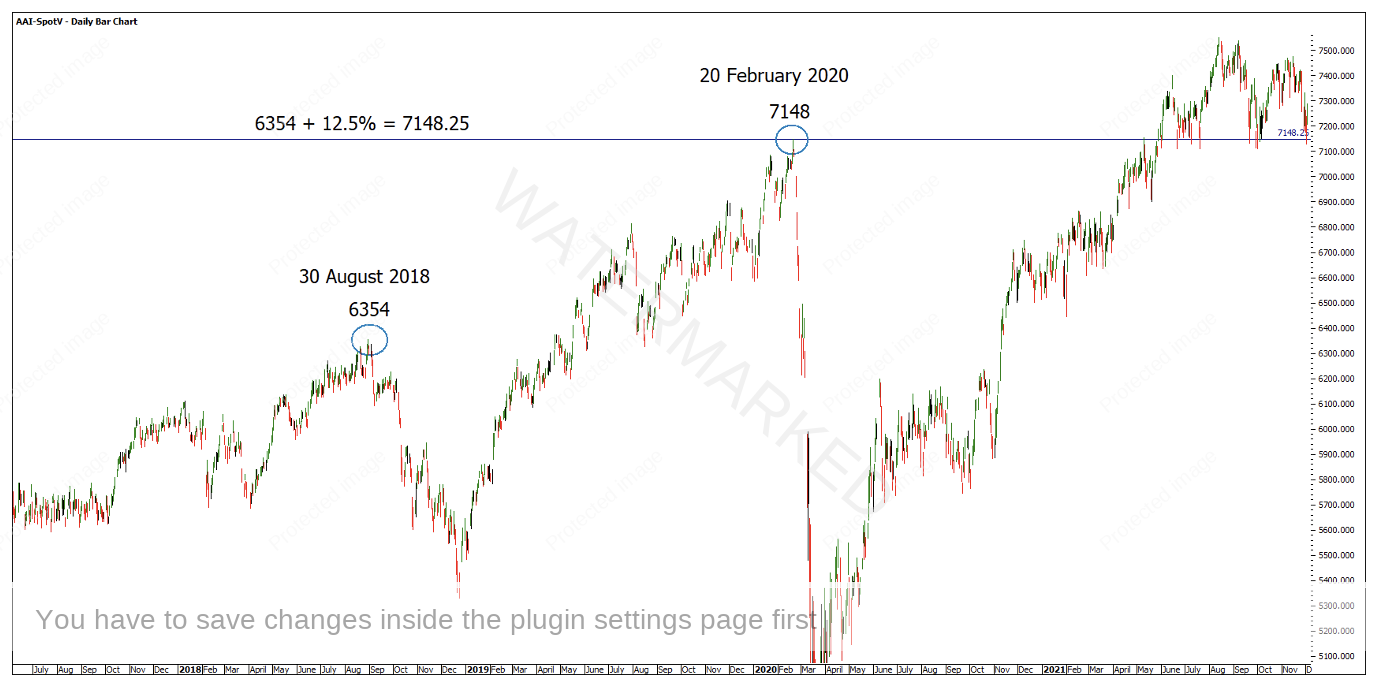
Finally, adding 12.5% to the 30 August 2018 high of 6354 you get 7148.25 and the exact price of the COVID High on 20 February 2020!
Chart 4 – 12.5% on 30 August 2018 High
All these examples are yearly highs and lows calling other yearly highs and lows. Gann’s instructions for being on top of these important support or resistance levels is:
“You should always have percentage tables made up on the Industrial Averages and on the individual stocks you trade in order to know where these important resistance levels are located.”
P30, 45 Years in Wall Street
Having a yearly or quarterly swing chart with the tables made up may prove to be the EASIEST way to know when the important support or resistance levels are approaching.
Another part of this lesson is knowing ALL the 50% levels of major ranges and using these to rate the strength of the market.
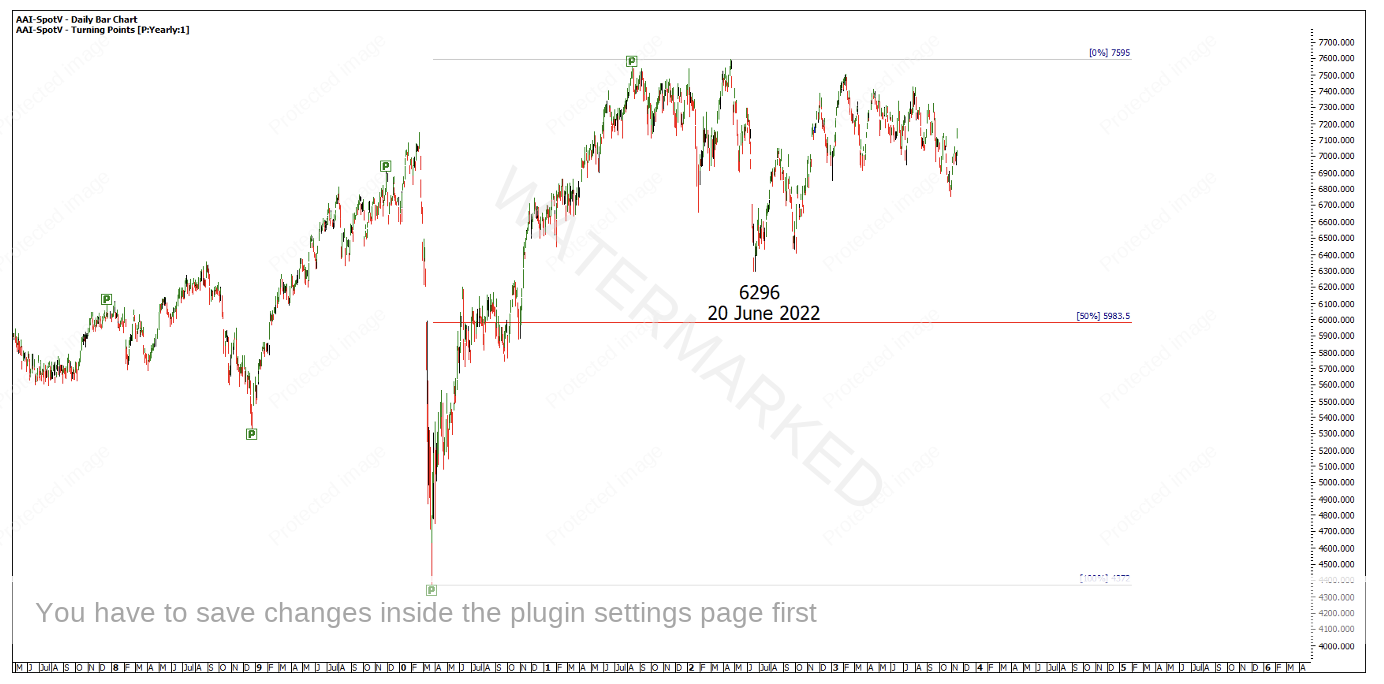
Looking at the current position of the SPI200, the 20 June 2022 low of 6296, is positioned well above 50% of the major range of 5983 and could be considered in a strong position.
Chart 5 – 50% of a Major Range
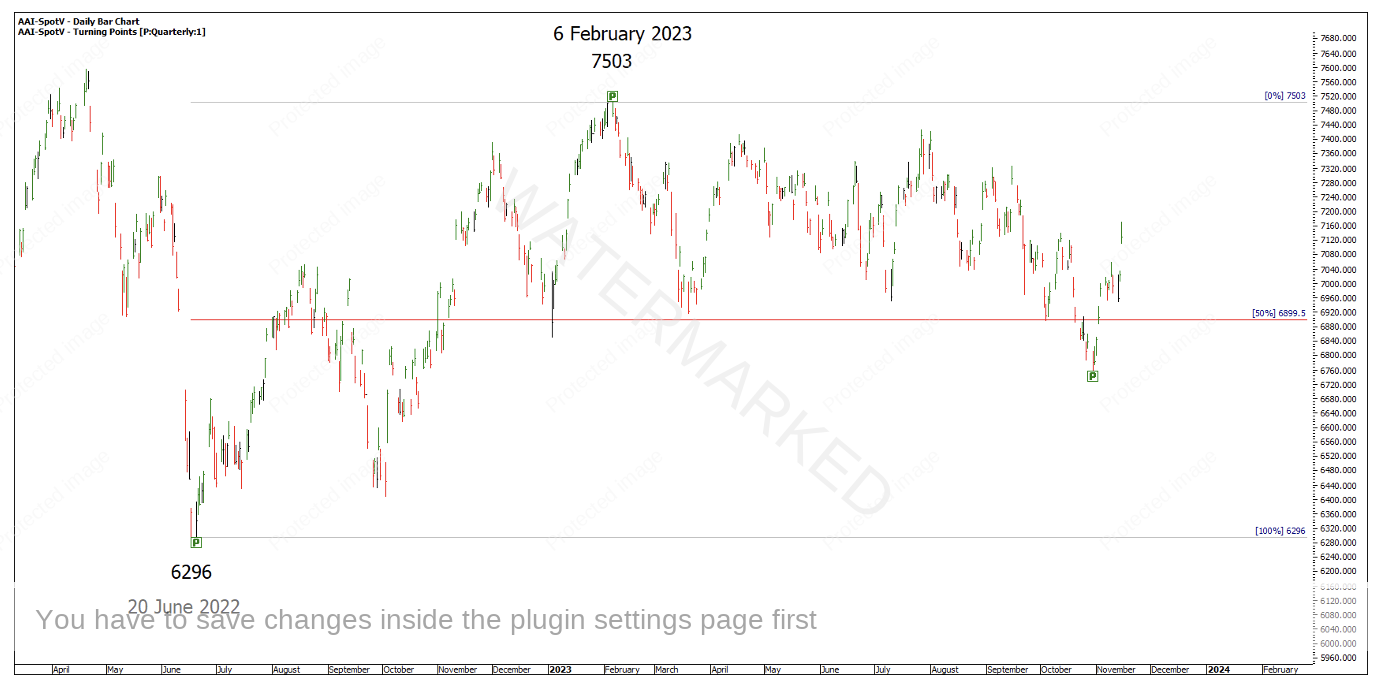
50% of the 20 June 2022 to 6 February 2023 major range is 6899. So far, the SPI has false broken this 50% and is now trading back above it.
Chart 6 – 50% of a Major Range
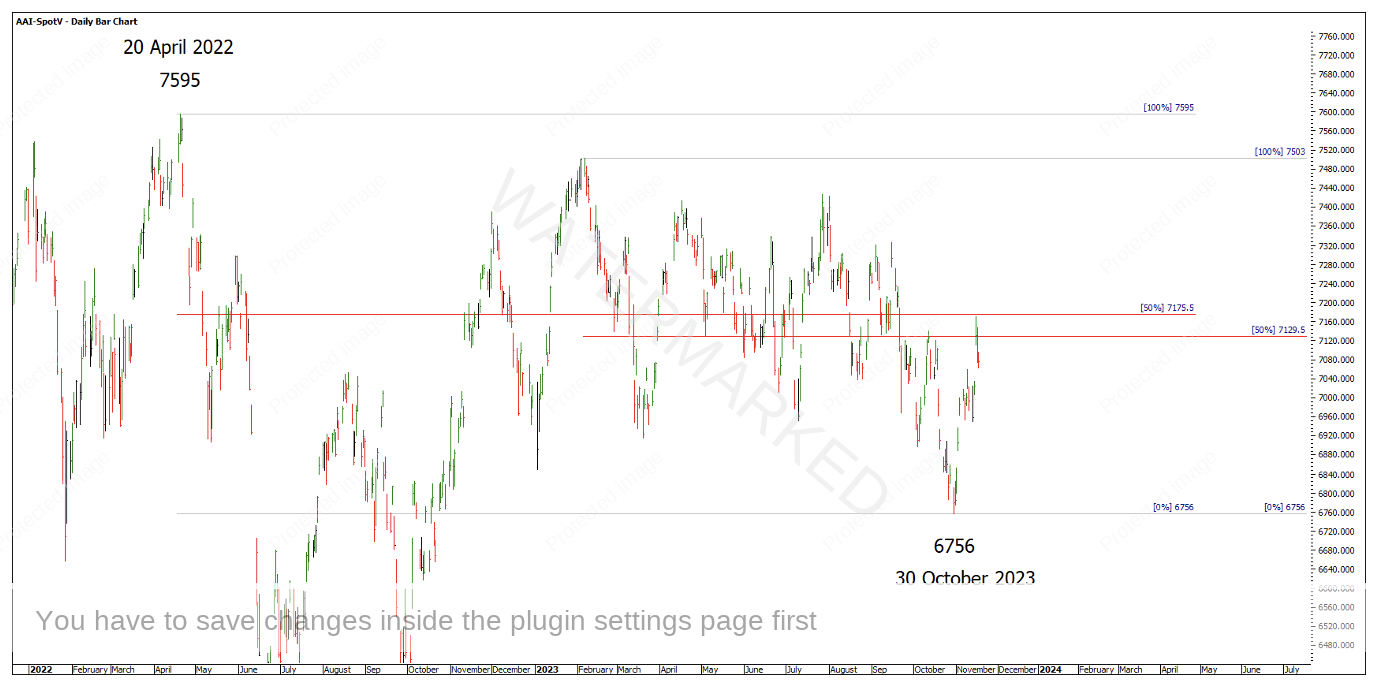
The last two 50% resistance levels of a major range are 7175, (April 2022 to October 2023) and 7129 (50% from 6 February to 30 October 2023).
Chart 7 – The last 50 Percent
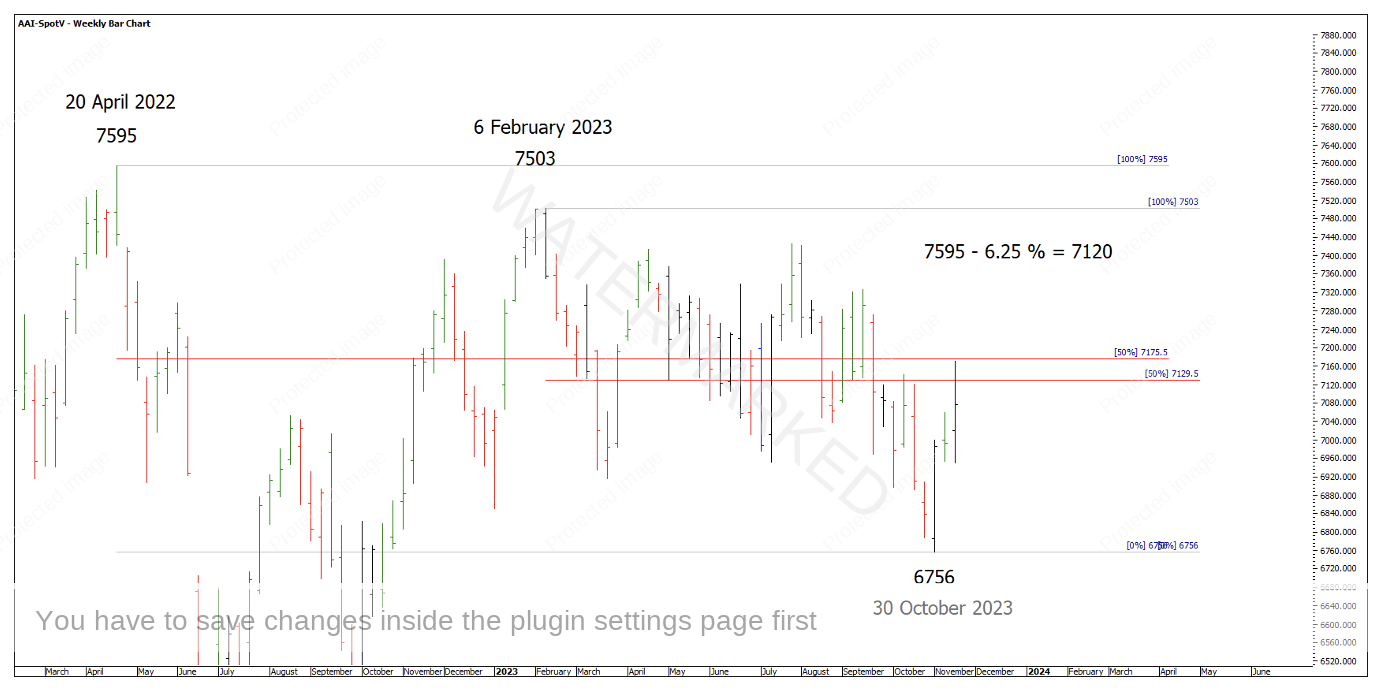
Looking at a weekly swing chart, the SPI200 is showing a contracting weekly swing range up into double tops at two 50% resistance levels. 6.25% % down from the All-Time High gives 7120, also potentially acting as resistance.
Chart 8 – Weekly Bar Chart
This seems like a critical point on this market, as the monthly swing is expanding to the downside in time and price, and at present, a contracting swing up in Time and Price. If this market struggles to go up from here, the SPI could potentially be gearing up for another monthly swing down.
If the SPI pushes higher, then there’s the potential that the last two 50% levels, that once provided resistance, could become an area to watch for support. If the latter occurs, then the SPI could well be looking to test old tops or potentially break into new all-time highs which would turn the yearly swing chart up.
Happy Trading,
Gus Hingeley
If you’d like to recreate Gus’ work on the Dow, we’ve attached an A1 copy of his chart that you can have printed out at Officeworks or your local print shop.
