The Magic of Milestones
I never tire of hearing the success stories of our students. When I heard of a recent trade taken on Gold, my natural reaction was to jump into ProfitSource and take a look to see what kind of setup it might have been.
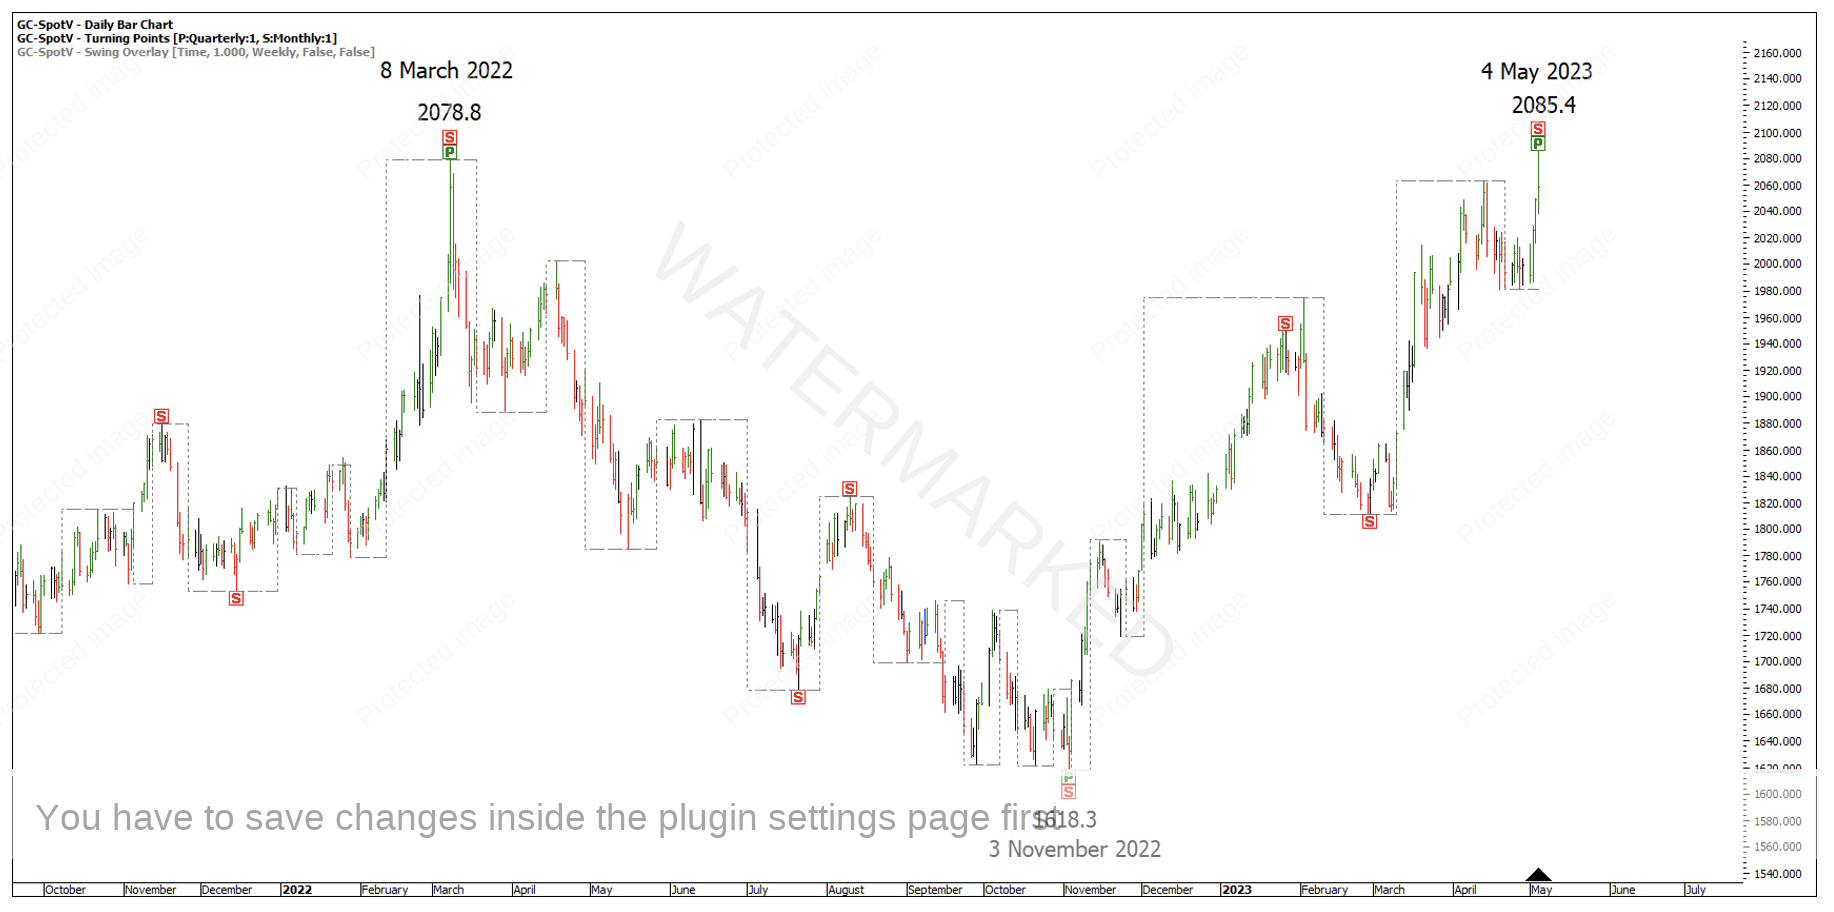
In Chart 1 below, you should quickly be able to identify what kind of setup it was!
Chart 1 – Gold Double Tops
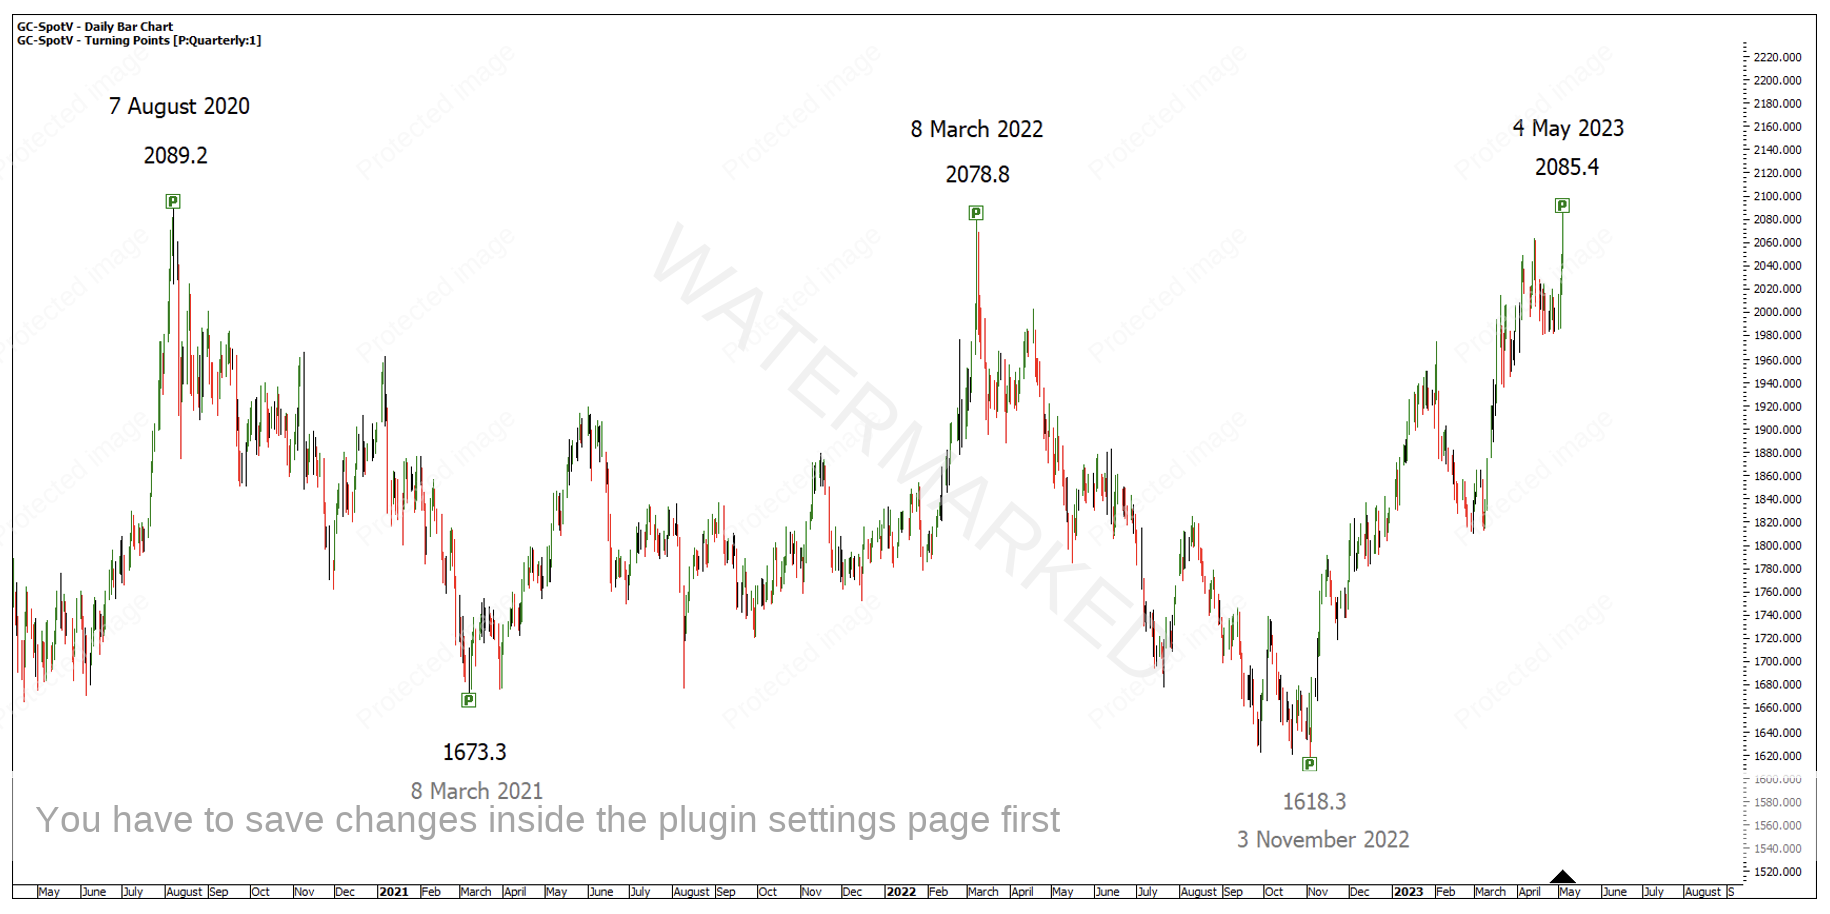
Potentially you would call them triple tops as the first top occurred on 7 August 2020, although this top is yet to be broken. Just to drop a few crumbs for anyone thinking of joining Trading with Time kicking off in July, isn’t it interesting the previous four quarterly turning points have all come in around the same time of the month!?
Chart 2 – Quarterly Turning Points on Gold
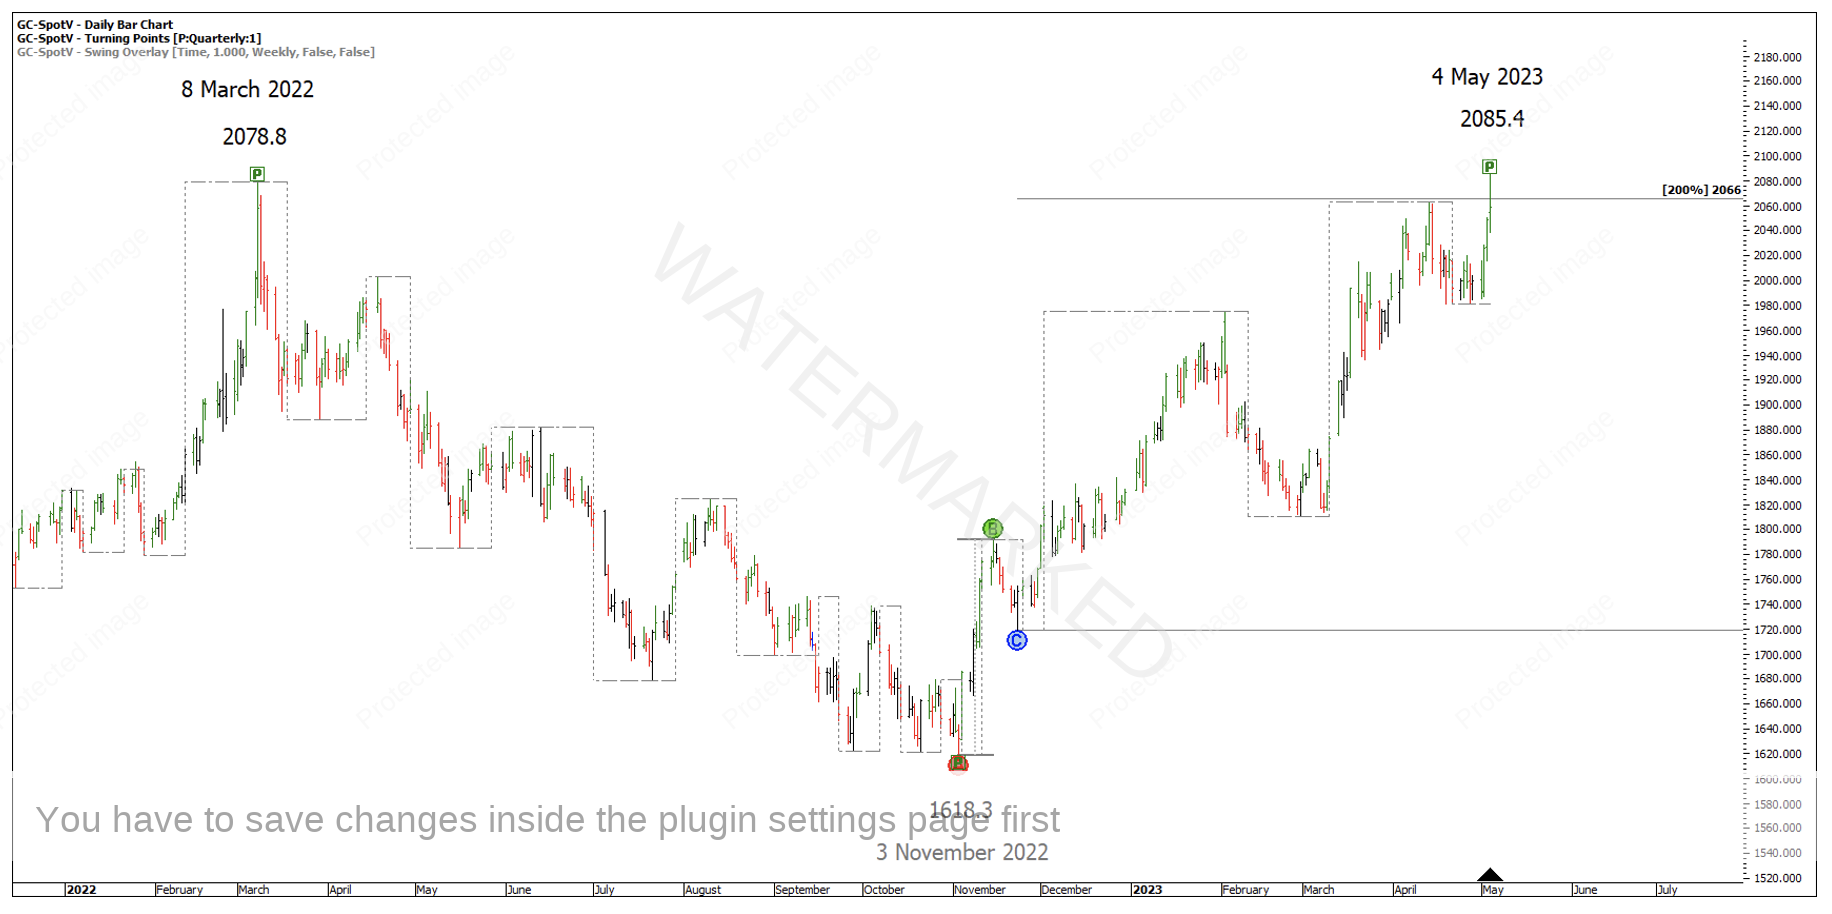
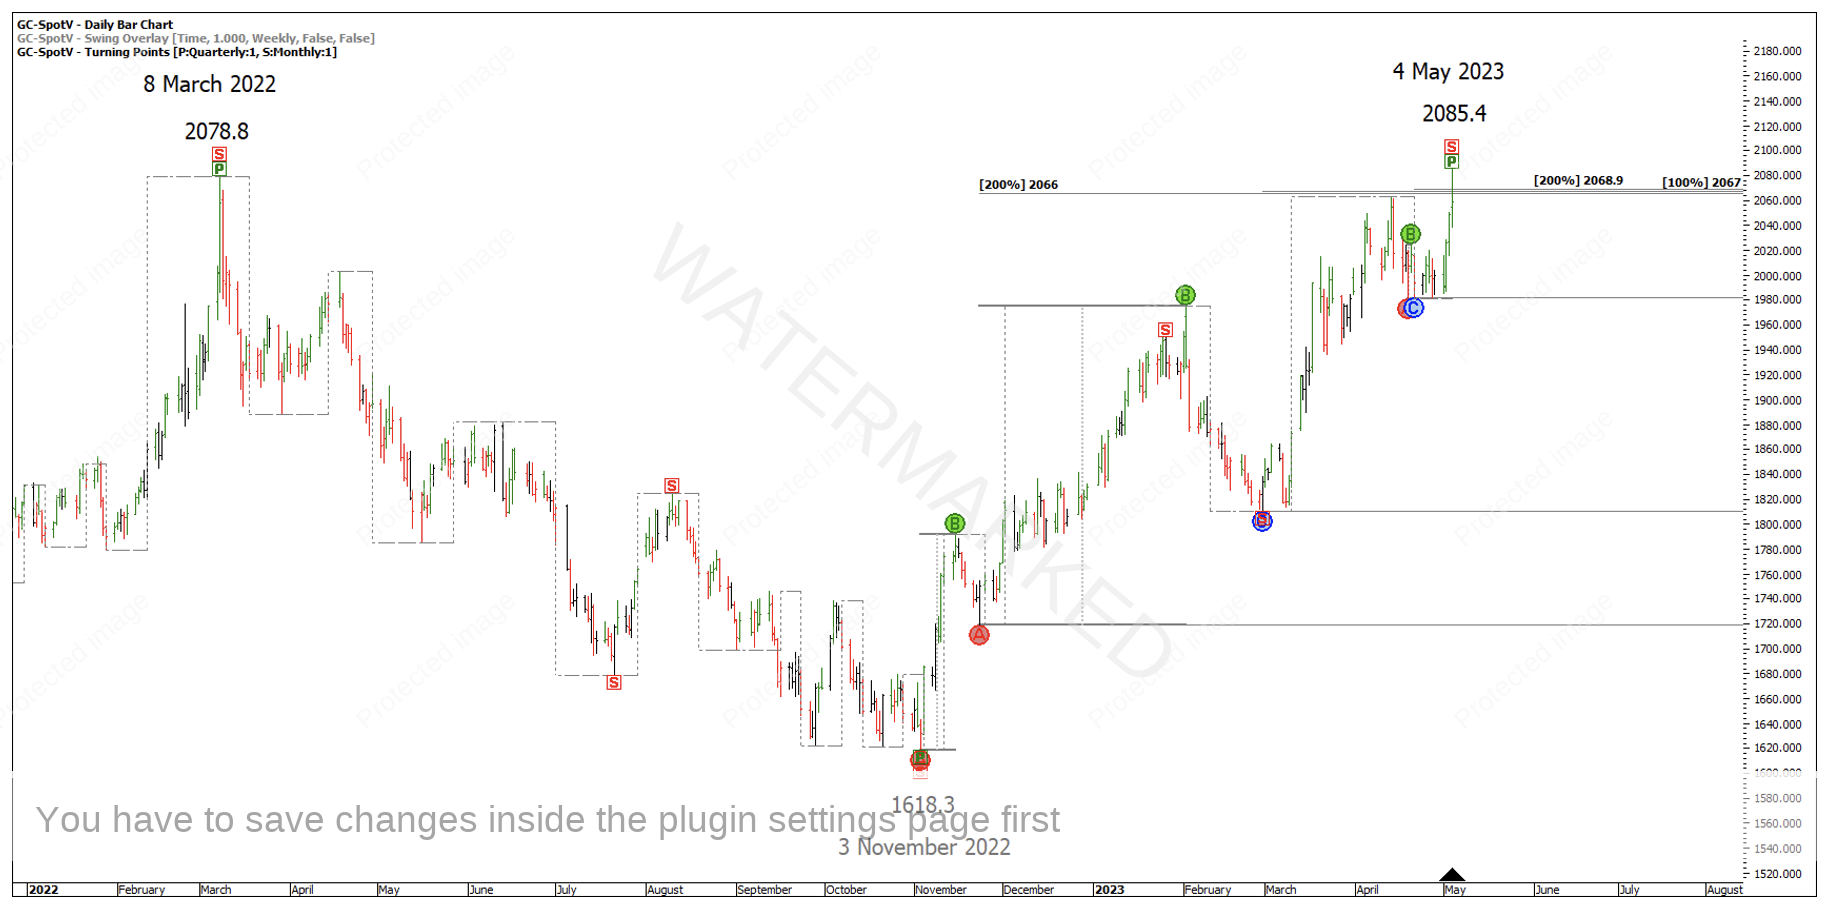
Although, it’s the major milestones which makes this Double Top a great trading opportunity. 200% of the weekly First Range Out from the 8 March 2022 high called the 3 November low to within $3.70, which is about 0.2% of its total value, just to put it into perspective.
Wouldn’t you know it, the magic 200% weekly First Range Out Milestone was also present at the 4 May 2023 top!
Chart 3 – Weekly First Range Out
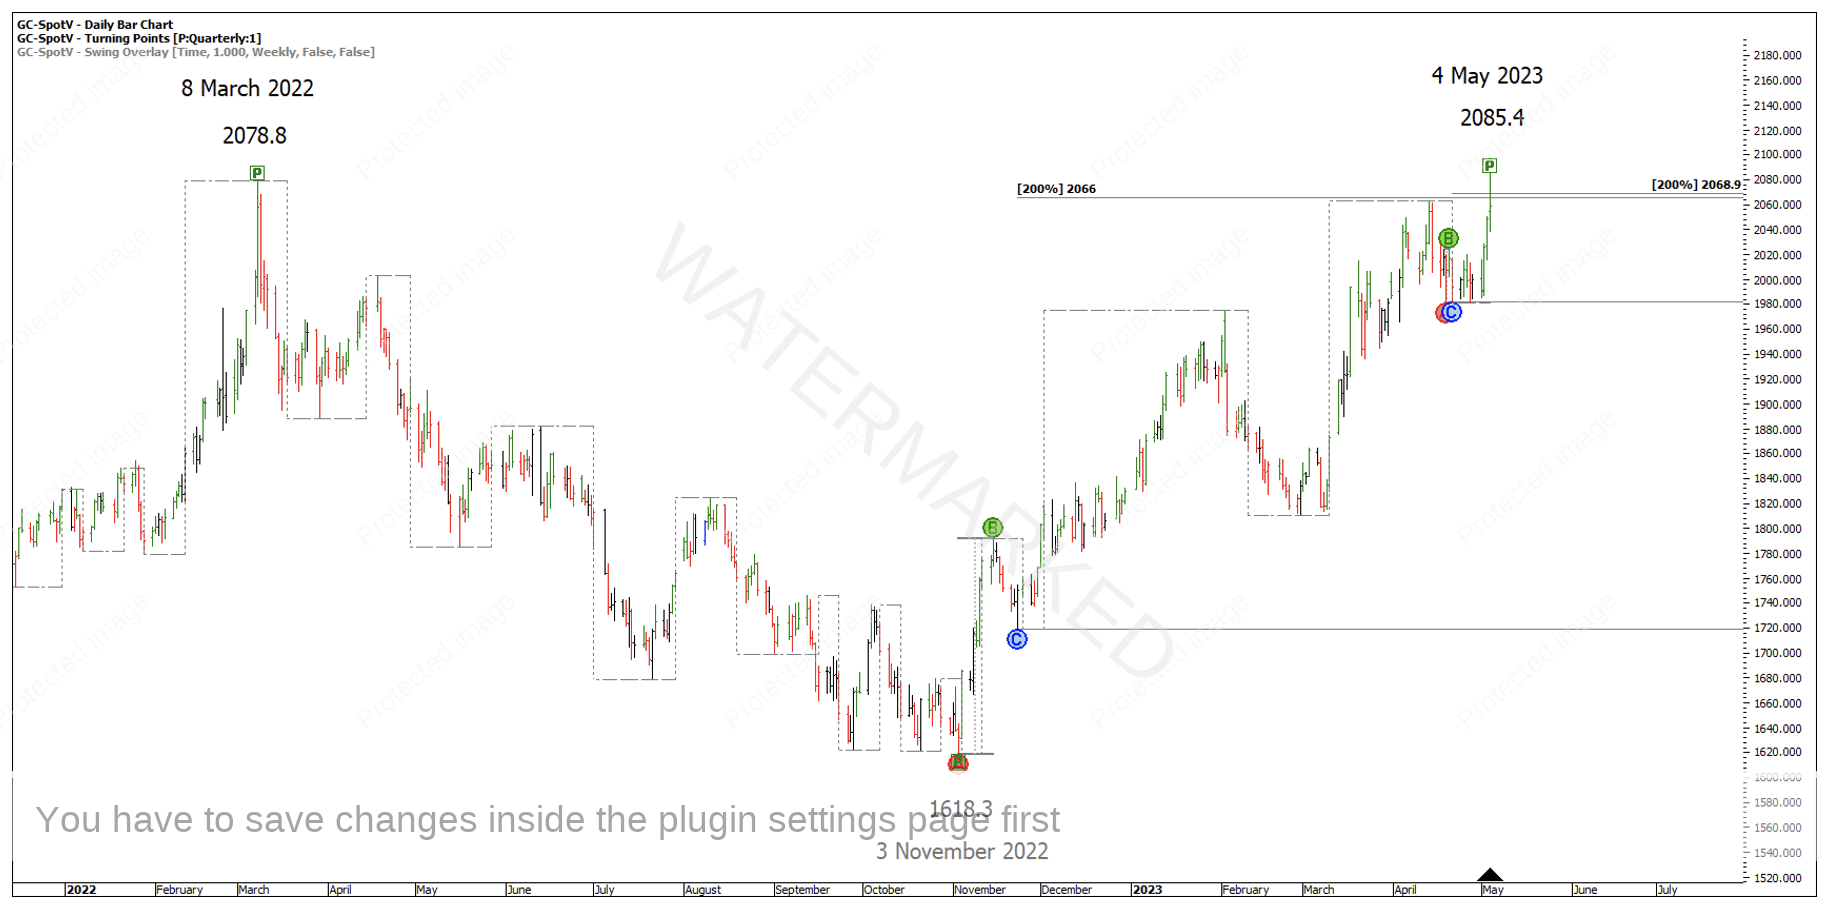
The 200% milestone came in at 2,066, a number to remember for later. Then, 200% of the daily First Range Out from the last weekly swing low gave us 2,068.9.
Chart 4 – Daily First Range Out
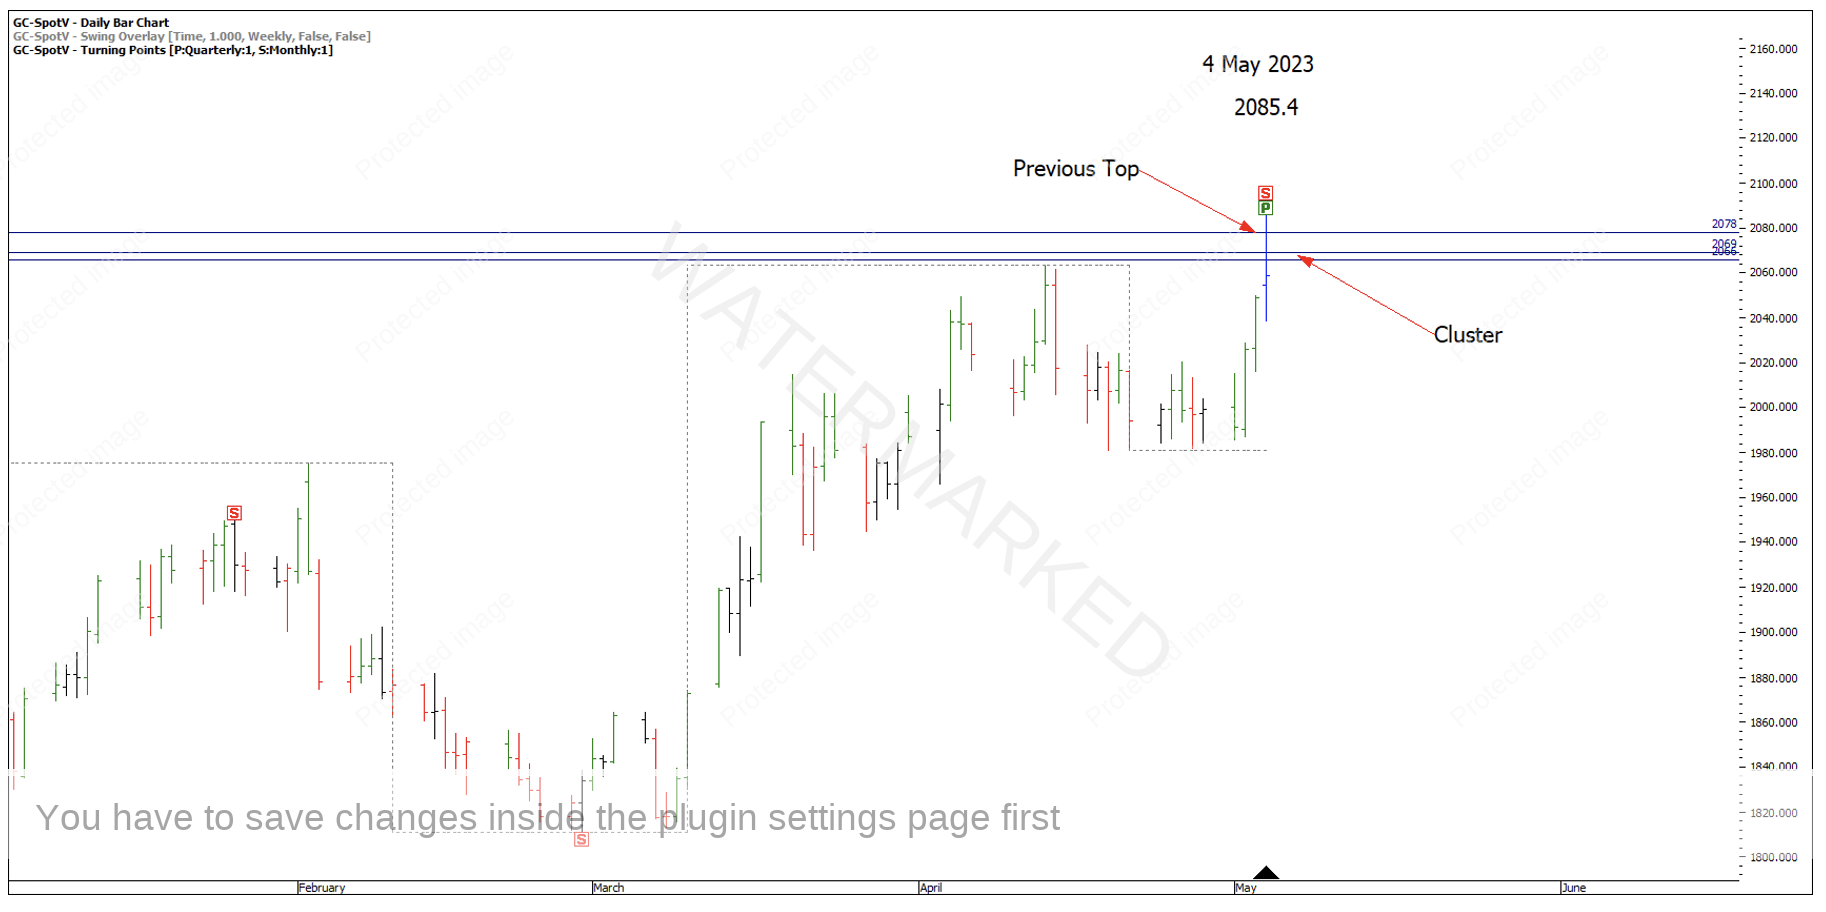
100% of the second weekly swing range gave a price of 2,067 and a three-part, false break Double Top cluster with contracting monthly and weekly swing ranges.
Chart 5 – 3 Part Cluster
On 4 May, Gold broke through the cluster and the old top before closing at 2,058.6. Even though it wasn’t a textbook signal bar, the market was showing weakness with a low close.
Chart 6 – Form Reading
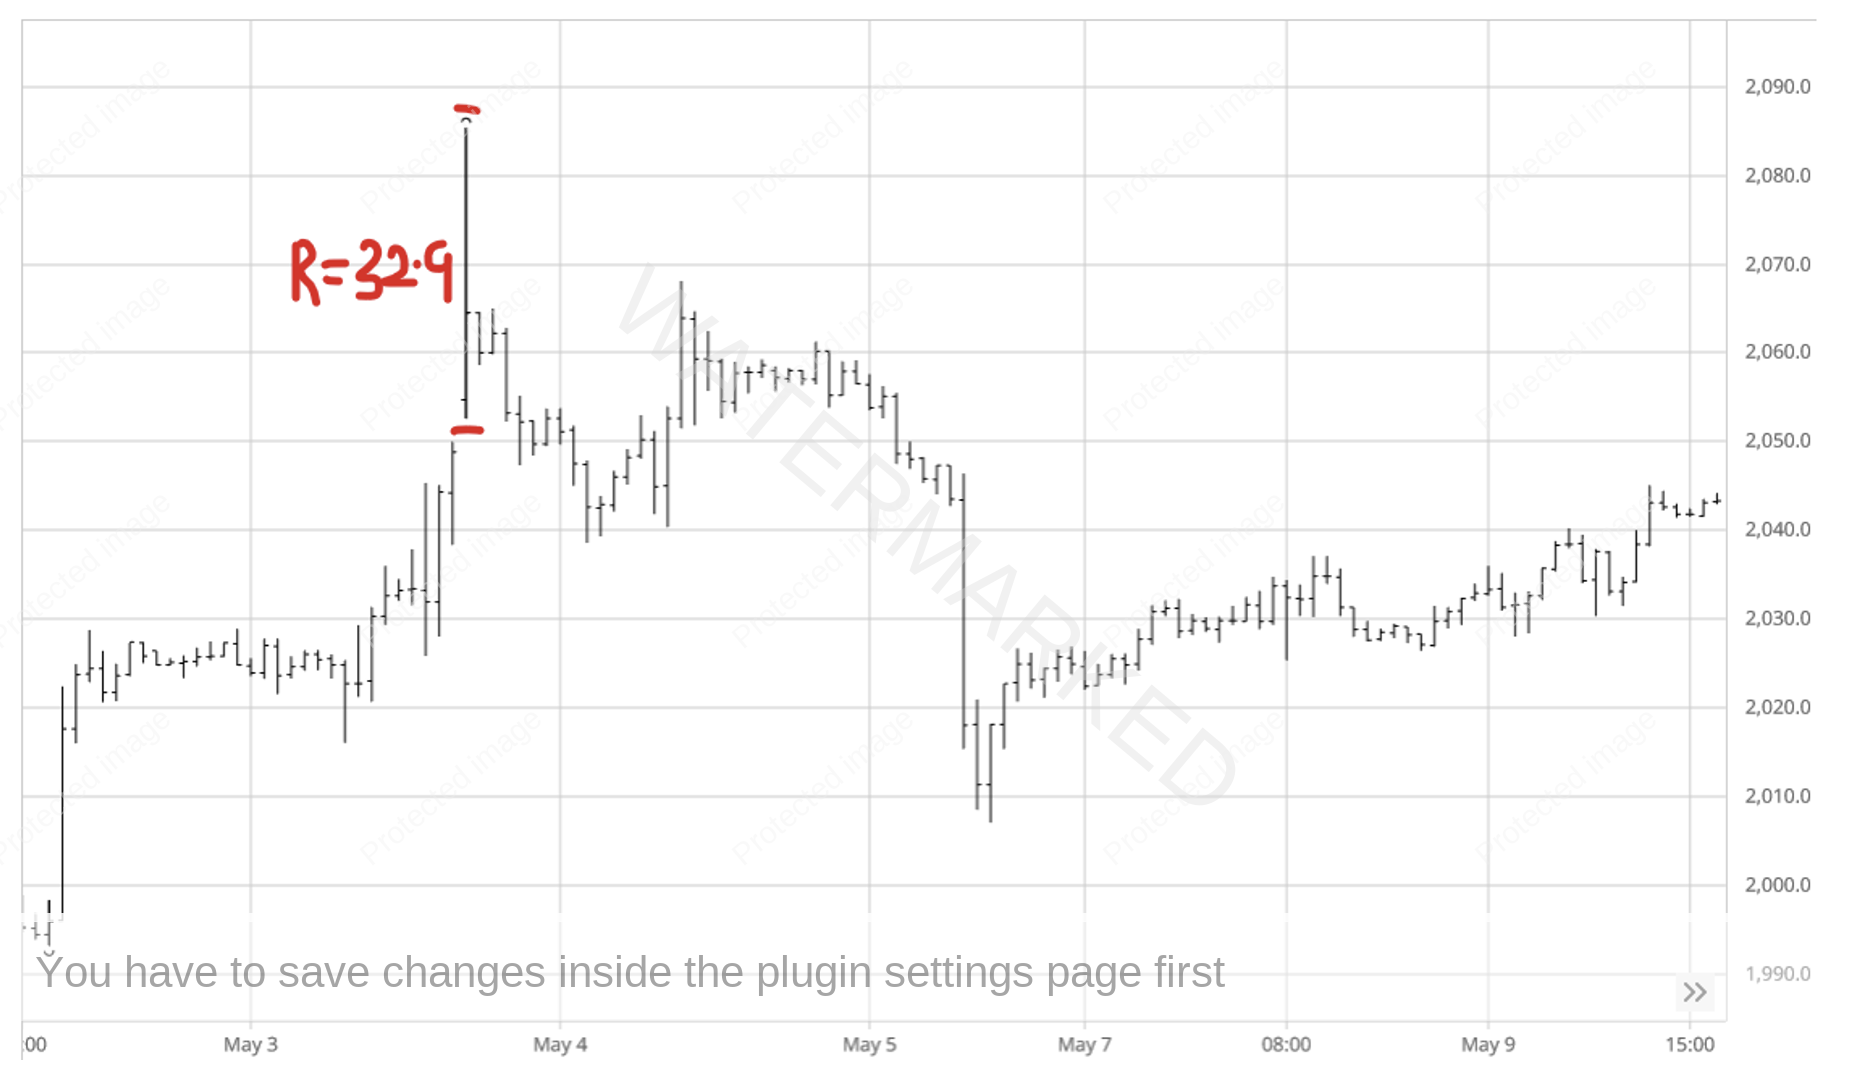
How could you enter into this trade? Looking at the 1-hour bar chart off the June futures contract in barchart.com, you can see the day of the top had a very large range, 1-hour bar of $32.90, making the entry as the 1-hour swing chart turning down. A large risk and a decreased reward.
Chart 7 – 1 Hour Bar Range
Sometimes showing patience and waiting for a better entry can prove very beneficial! In this case, waiting for the 1-hour retest put you in a great position to profit from the trade.
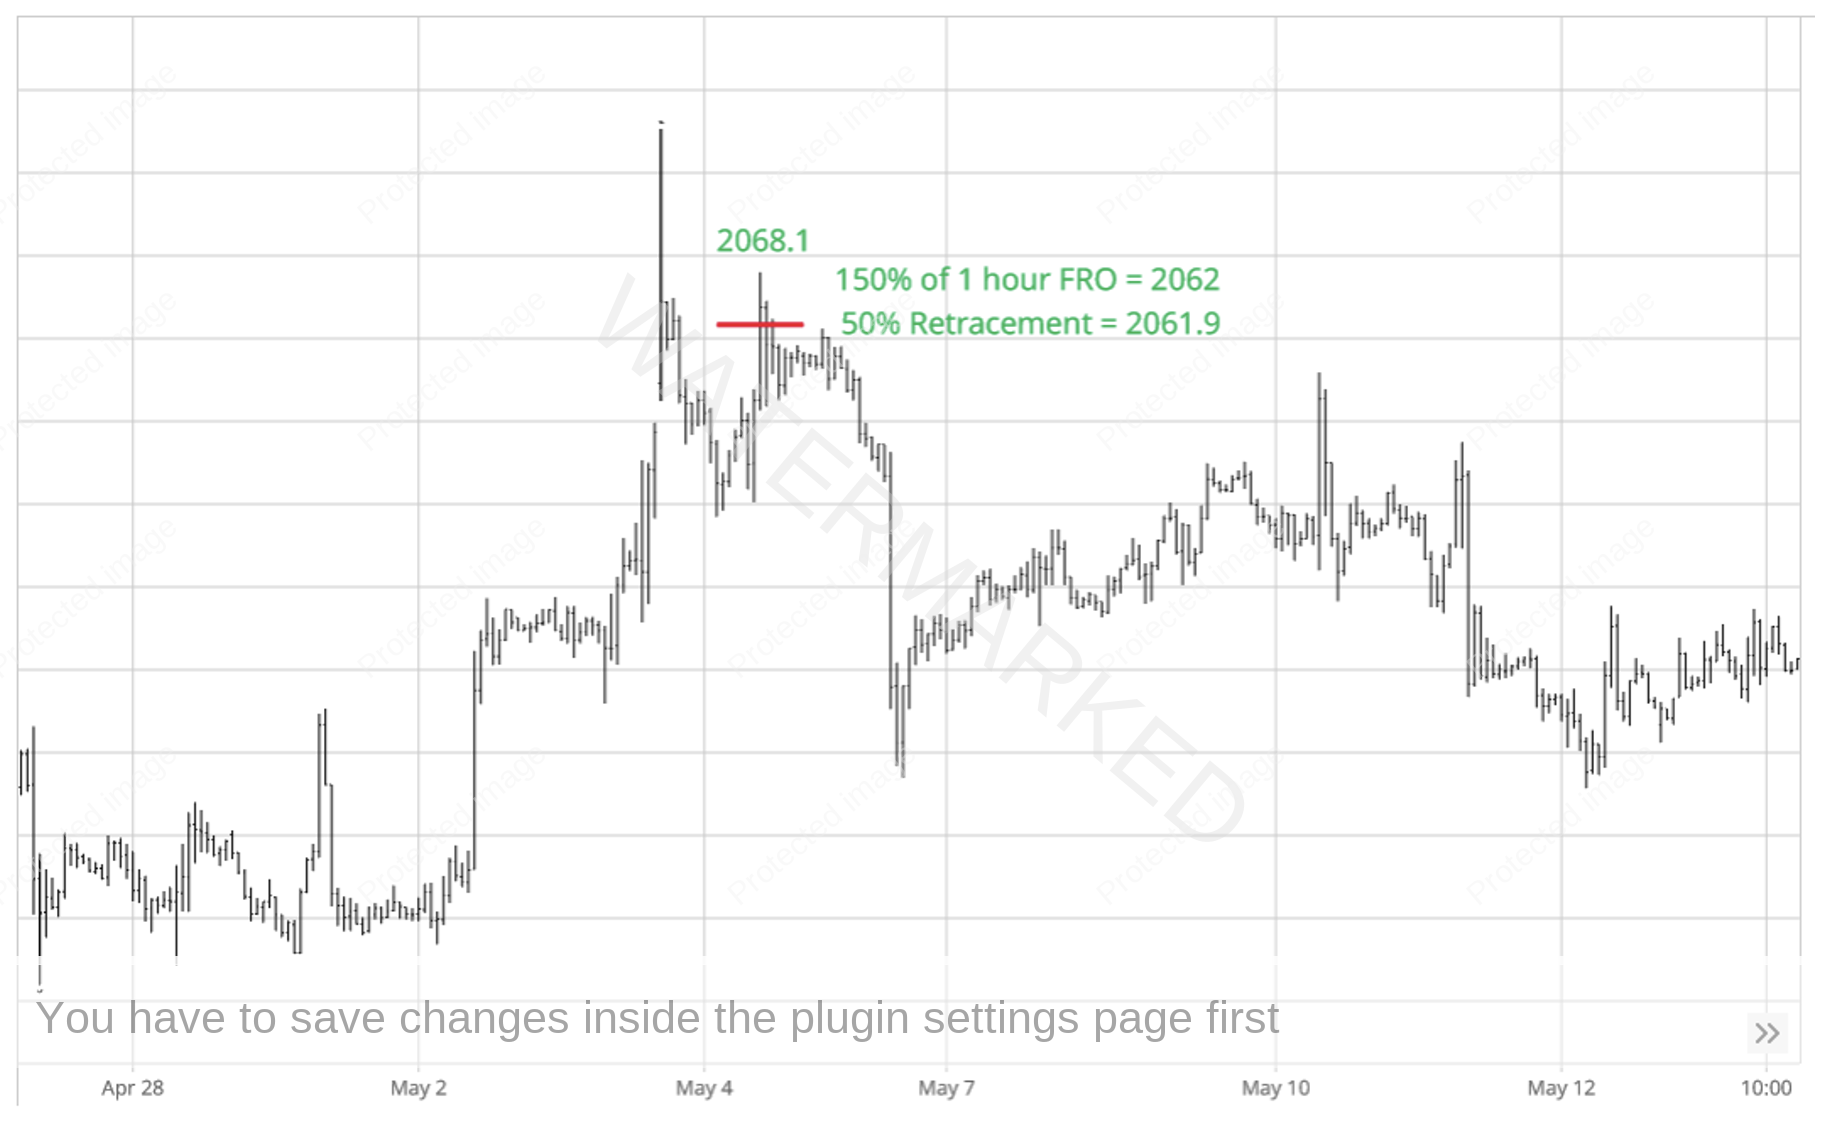
After the First Range Out, Gold retraced to 2,068.1 (part of the original cluster). This time you could also add the 150% milestone off the 1-hour First Range Out at 2,062 and a 50% retracement at 2,061.9
Chart 8 – Retest
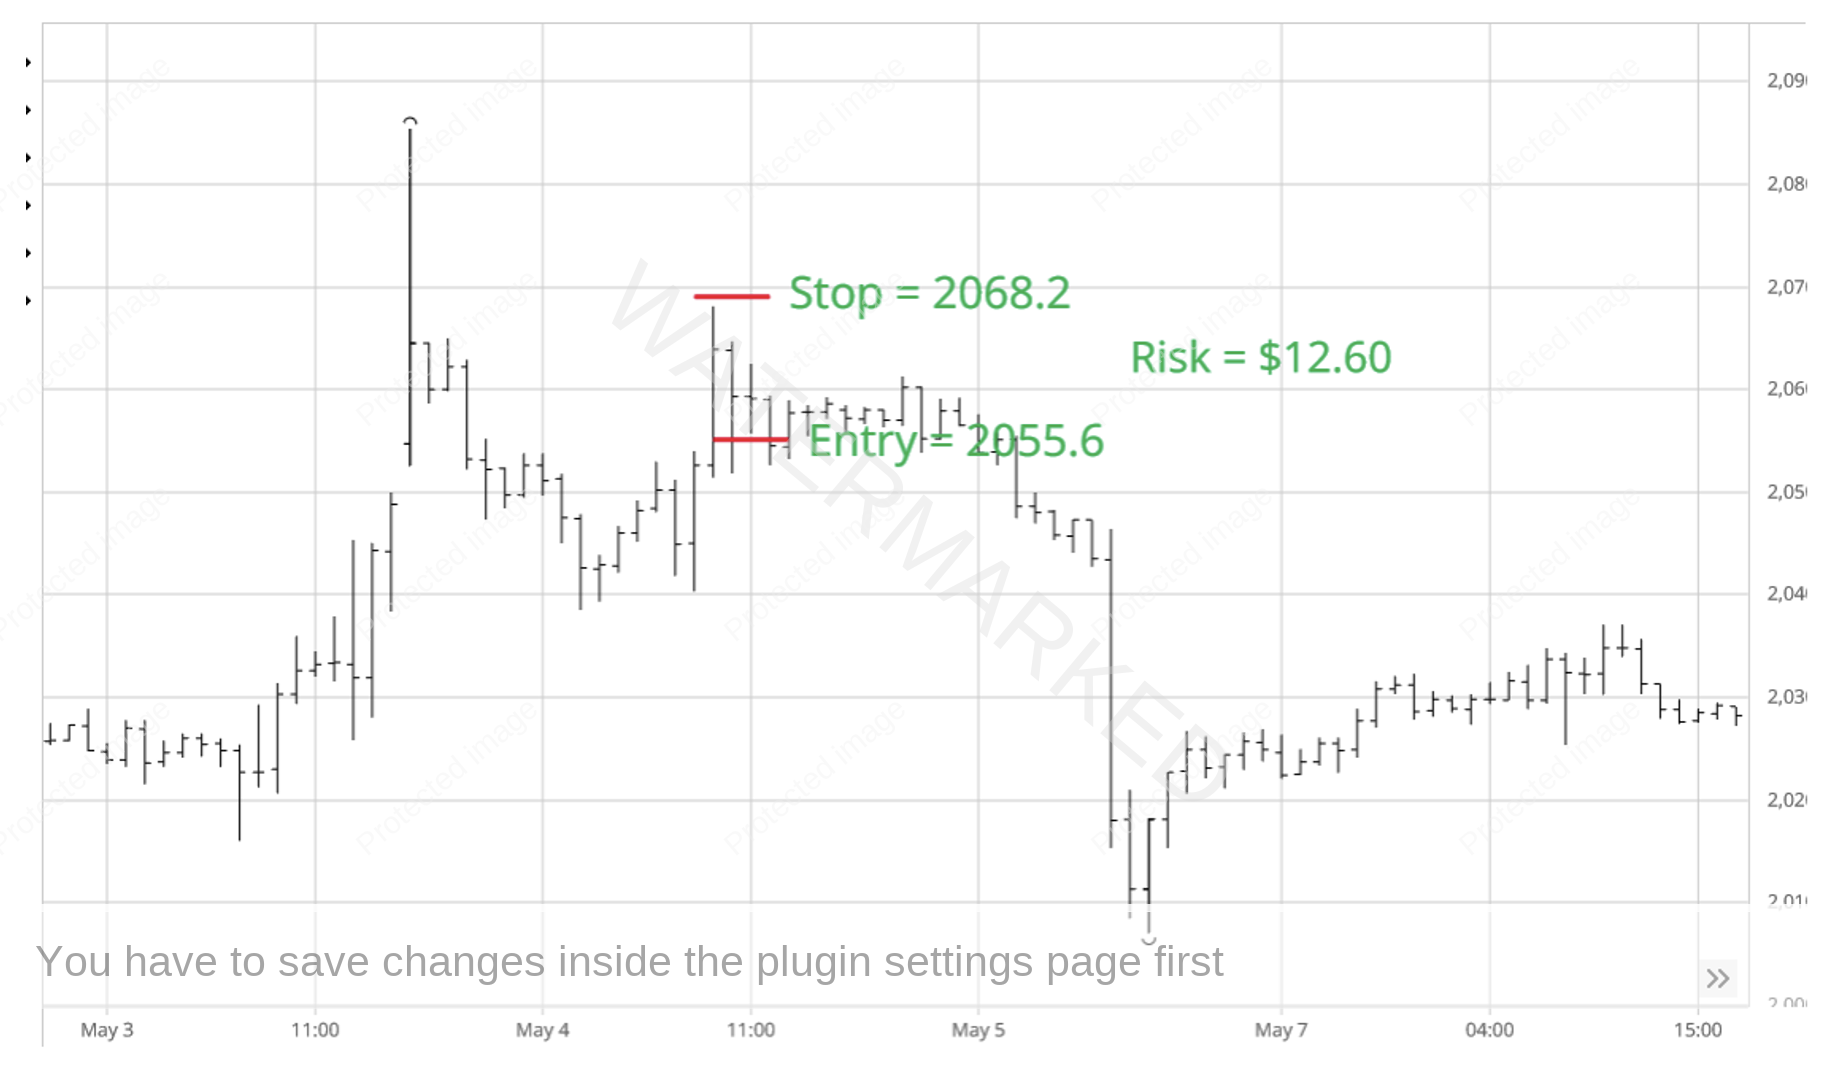
If your entry plan was to enter as the 1-hour swing chart turned down, then you could be in at 2,055.6 with a stop at 2,068.2 with a risk of $12.60. That means the market would have to move $126 from the point of entry at 2,055.6 and hit = $1,929.60
Chart 9 – Entry Parameters
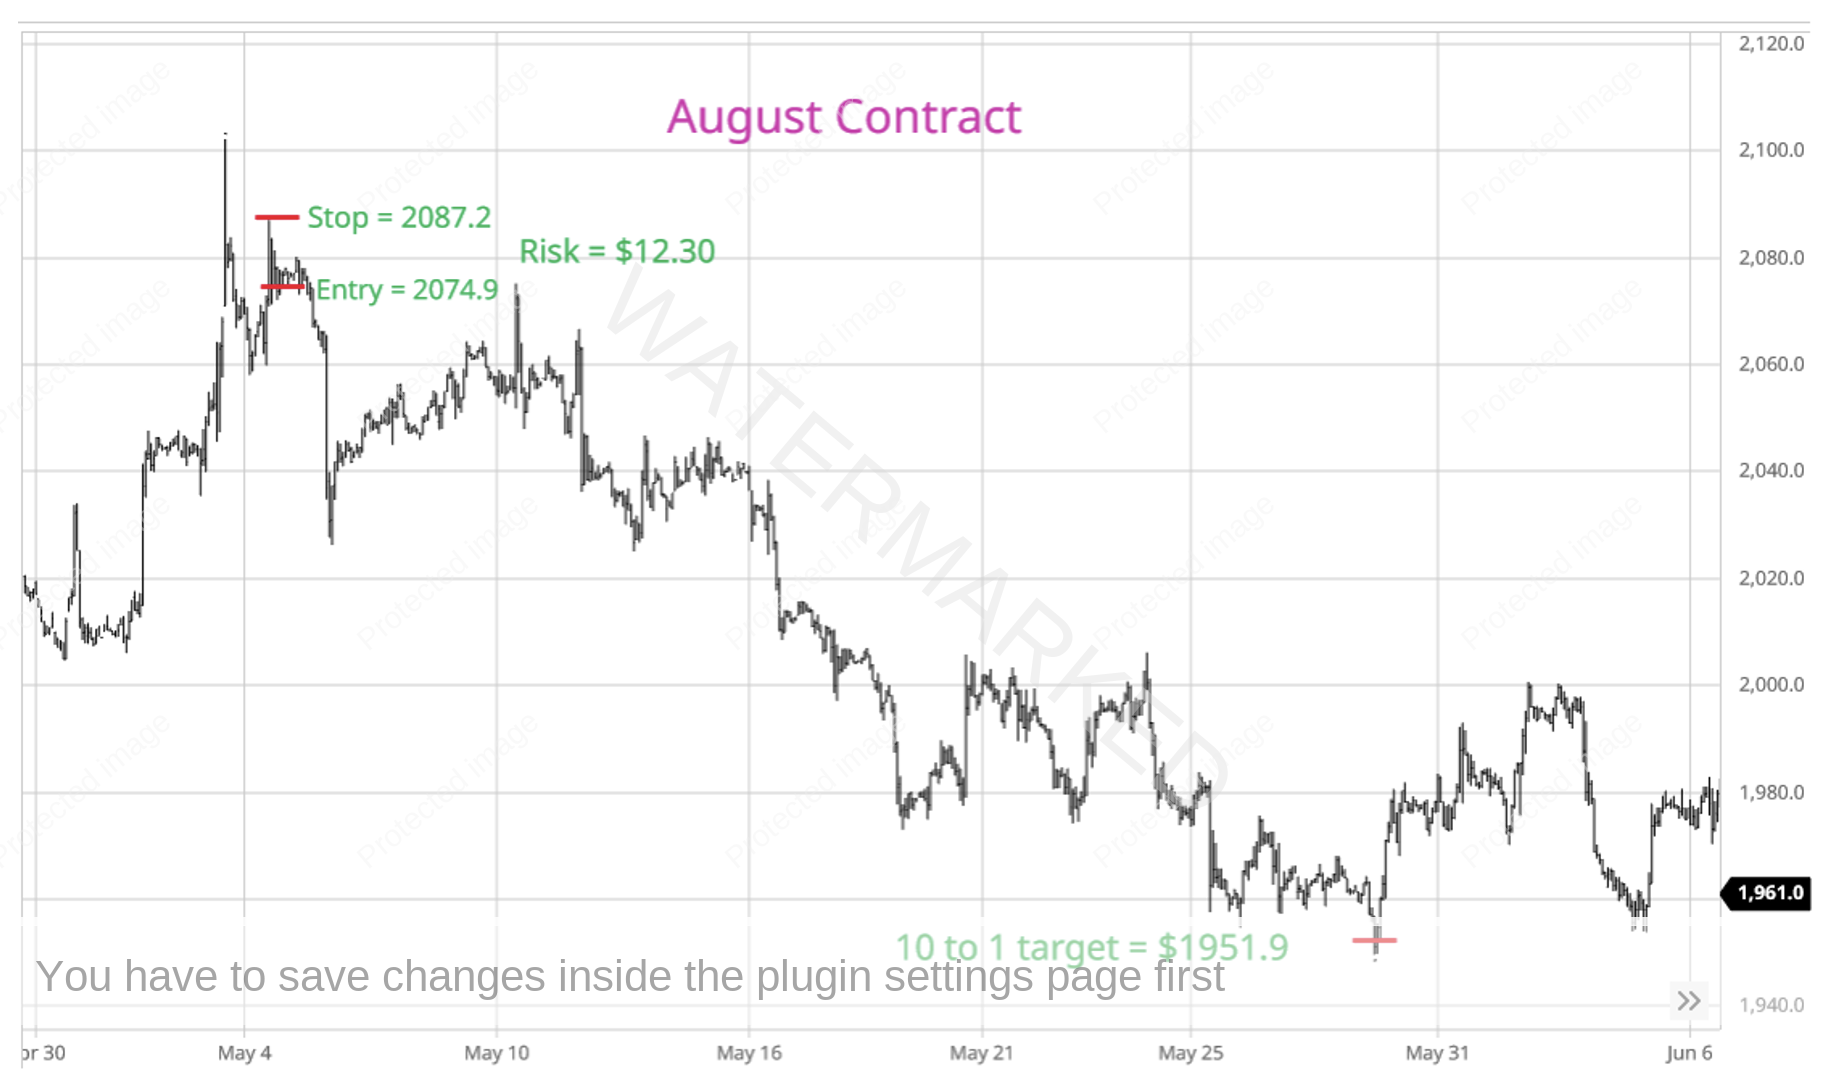
Trading the June contract so close to expiry means you either roll over into the next contract month or trade the forward contract. Using the exact same entry strategy as the above on the August contract would mean the trade hit a 10 to 1 Reward to Risk Ratio on 30 May.
Chart 10 – Trading the Forward August Contract
There are other ways you could have entered this trade or managed this trade so make sure you take the time to look for yourself to see how you might have approached it. As David said, “your hindsight will become your foresight if you use it often enough.”
Happy Trading
Gus Hingeley
