The Other Contracts
When analysing the chart of a commodity the usual approach would be to do most of the work on the continuous SpotV chart. This will be adequate for the majority of the time as it will capture the majority of set ups. But, due to the seasonal nature of some of the commodities, there can and will be considerable price differences from one contract to the next. This can be typical of the agricultural sector (e.g. Corn, Soybeans) or the soft commodities sector (e.g. Cotton, Sugar).
As a result of this it is prudent to also do some extra price analysis on the individual contract charts. And sometimes this can be more than just supportive work! Every now and then one of the “other charts” can offer you a trade which you may have missed if only looking at the SpotV.
The example considered by this article is from the Soybean Meal futures market and shows the type of trade that is within the reaches of a diligent Active Trader Program student. The setup for this trade had presented itself by late June of this year, with an entry signal in early July. At that time of year, as usual, most of the interest in this market had switched straight from its July contract to the December contract, skipping the September contract all together. But the September contract is still liquid enough to trade – and it was the one with the good setup.
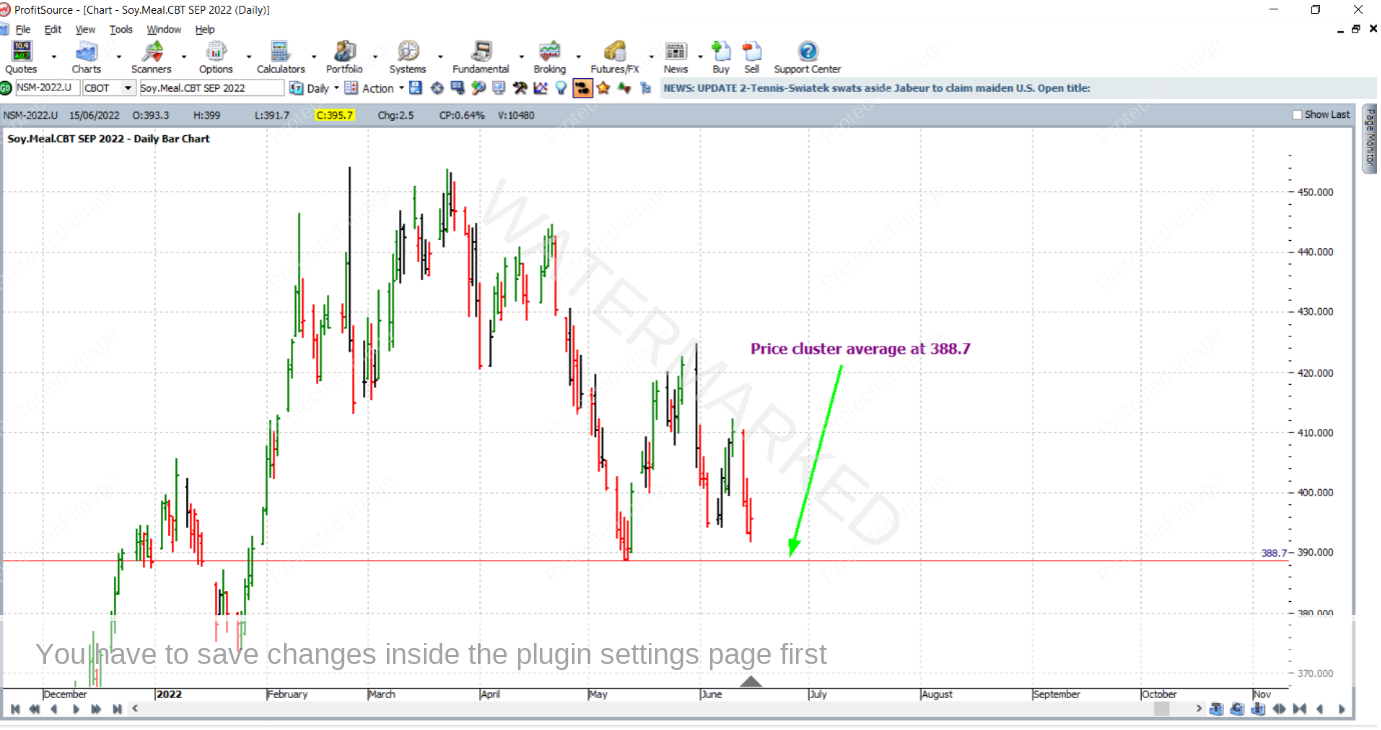
Three price analysis reasons clustered together at an average price of 388.7 USD per tonne, and during June as the market was heading down towards this level, as a technical Safety in the Market trader you would have been anticipating a reversal at this level. This is shown in the ProfitSource chart below, symbol NSM-2022.U – that is for the September 2022 Soybean Meal futures contract.
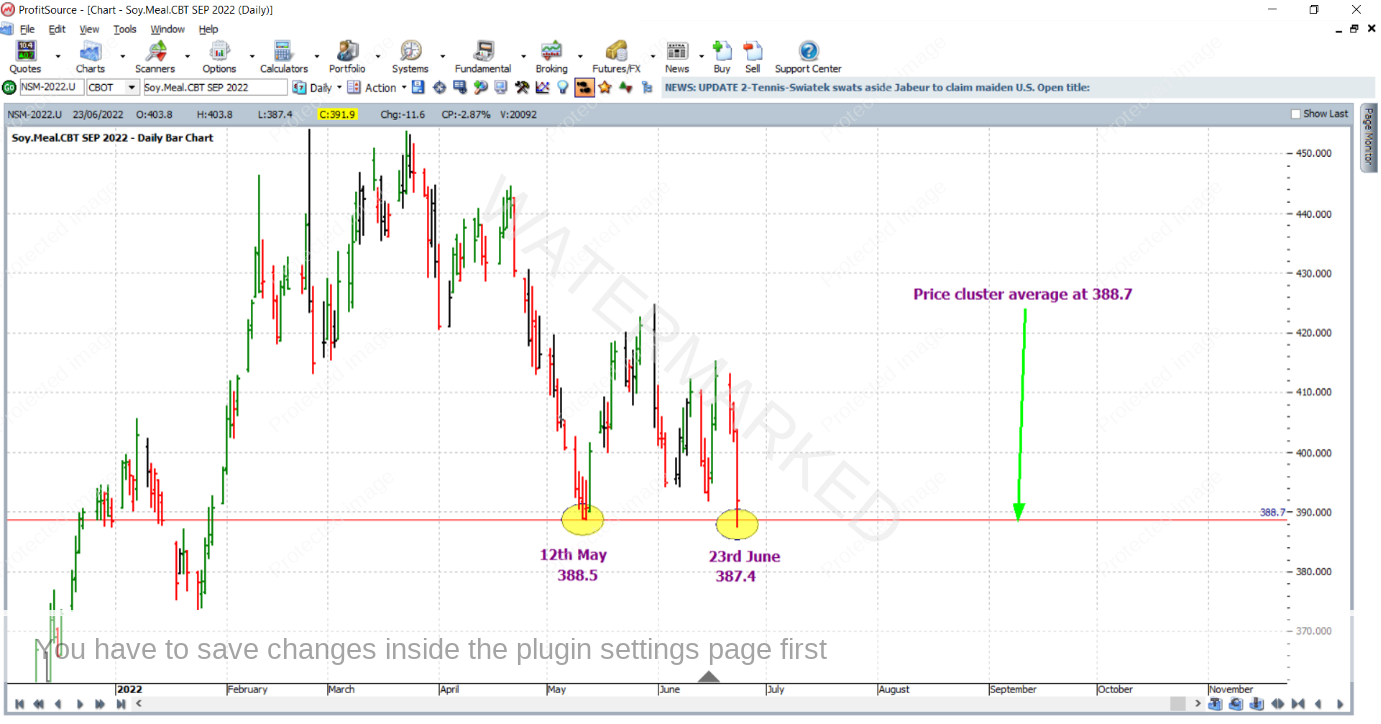
On 23 June 2022, the market lowed at 387.4, obviously false breaking the price cluster, and making a rough double bottom with the 12 May 2022 low (which itself, at 388.5 was one of the three price reasons not mentioned in this article as yet – see if you can find the other two).
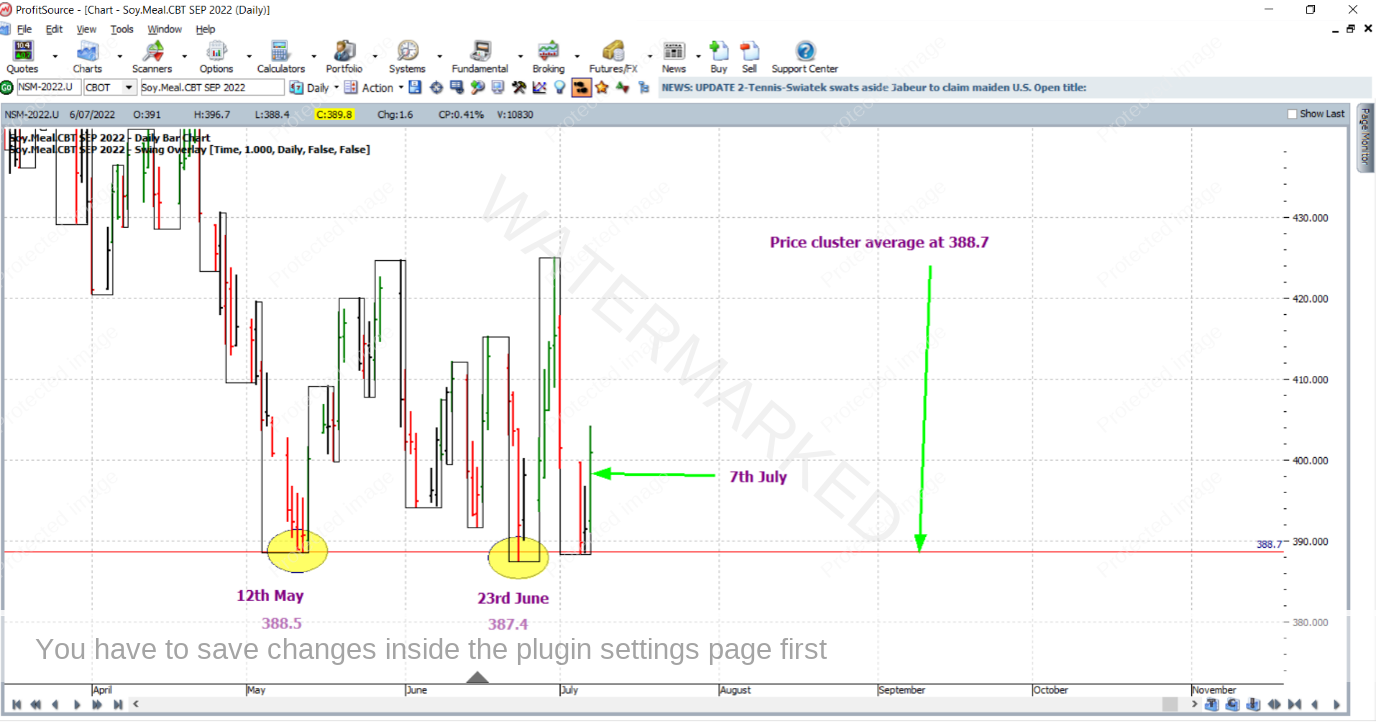
Moving forward a few days in Walk Thru mode, we can see that a first higher swing bottom entry was confirmed with the up day that was 7 July 2022. This would have had you long Soybean Meal at 396.8 with an initial stop loss at 388.2, one point below the low of 5 July 2022 (the point size in this market is 0.1). The inside day that was 6 July 2022 allowed for lower risk, and ultimately a higher Reward to Risk Ratio. See the chart below, which also illustrates with the use of the one day swing overlay.
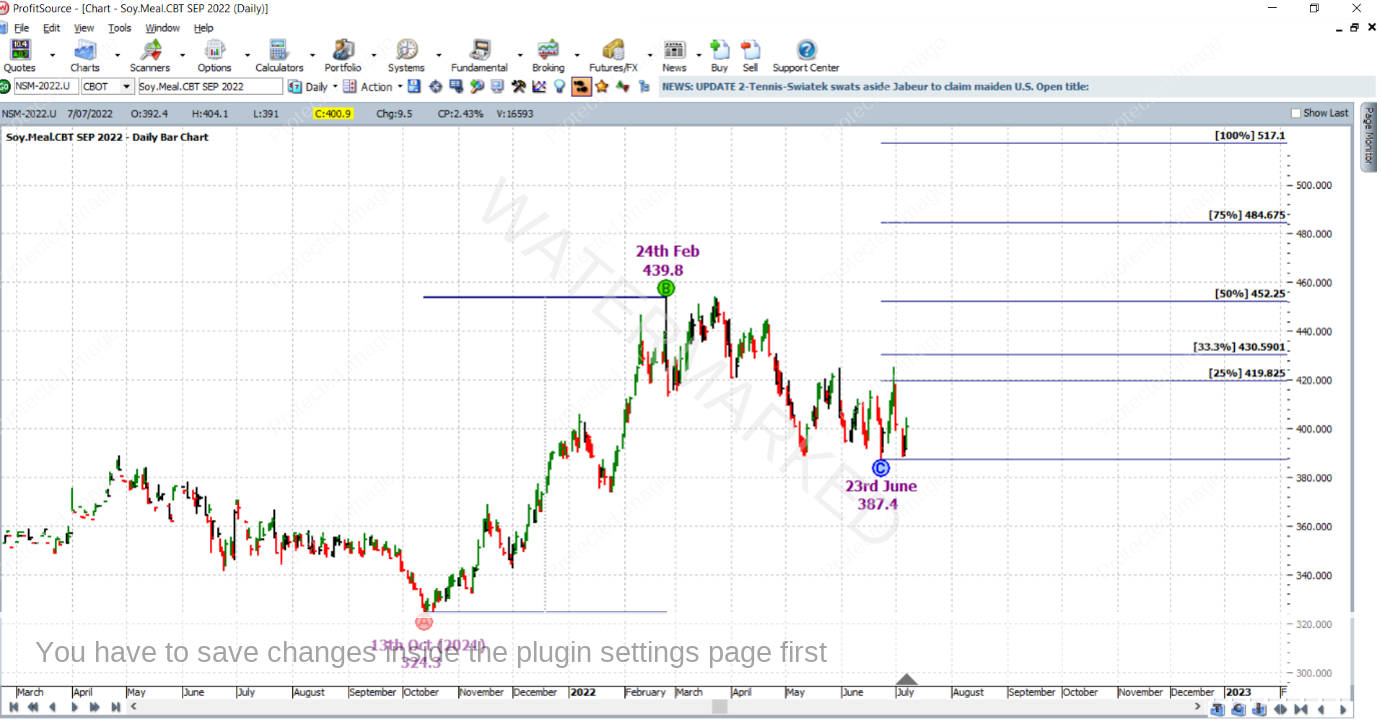
The last monthly swing in the same direction as the trade will be used as a reference range, and stops will be managed stock style, that is exiting at the 75% milestone.
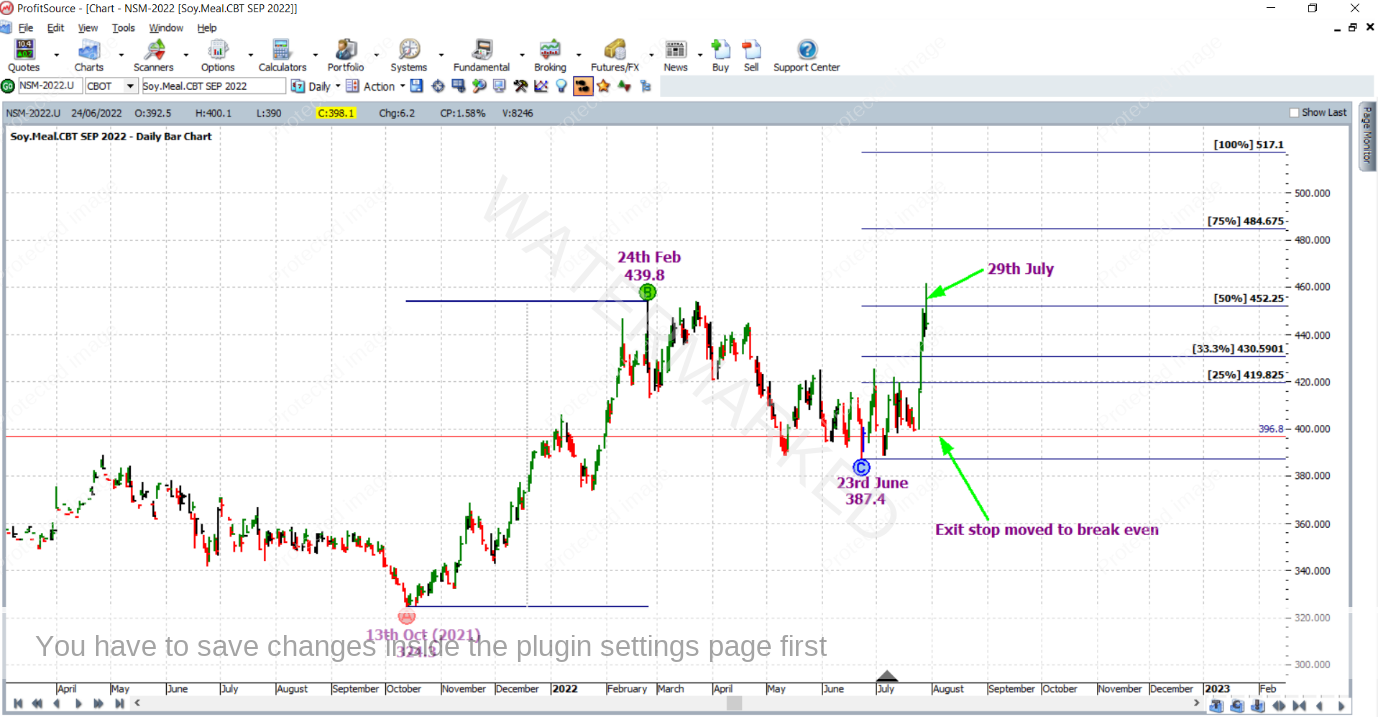
On 29 July 2022, the market reached the 50% milestone and stops were moved to break even.
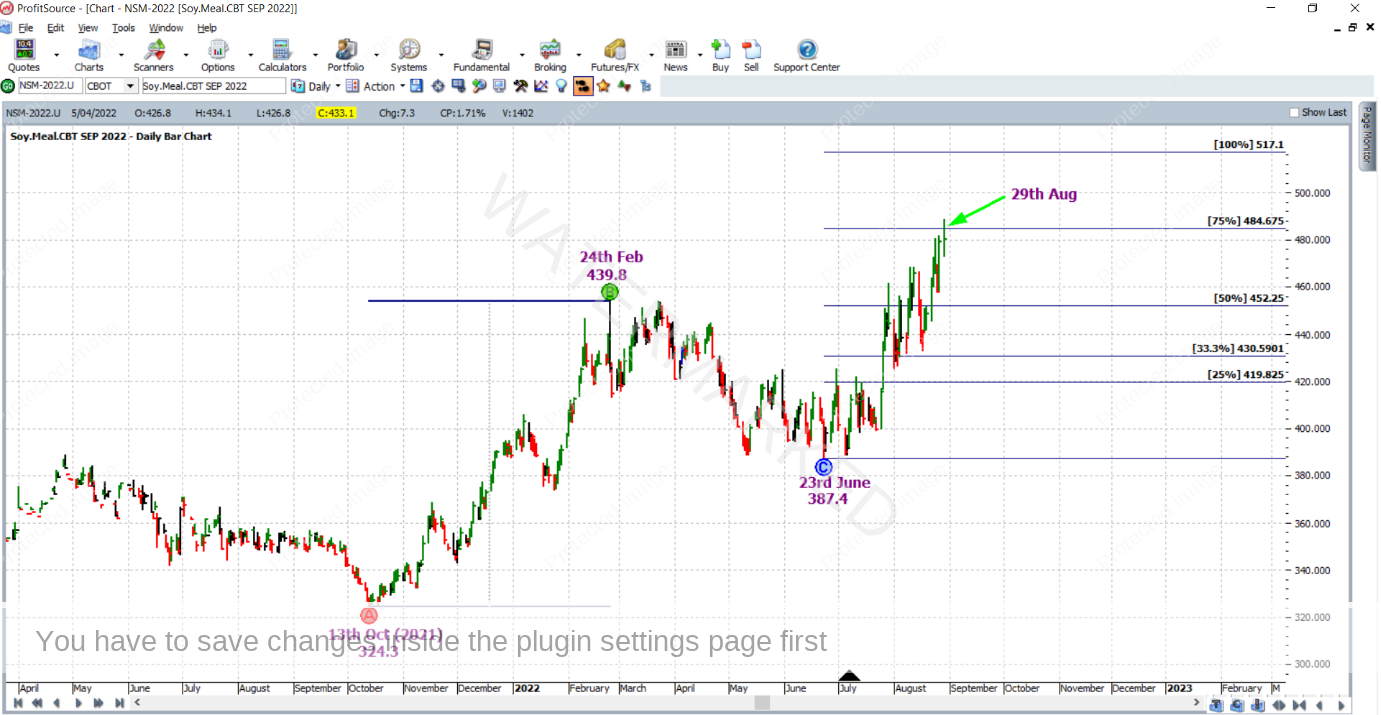
And then on 29 August 2022, the 75% milestone exit target was reached.
And here is a break down of the rewards. In terms of the Reward to Risk Ratio:
Initial Risk: 396.8 – 388.2 = 8.6 = 86 points (point size is 0.1)
Reward: 484.6 – 396.8 = 87.8 = 878 points
Reward to Risk Ratio: 878/86 = approximately 10 to 1
If you look up the specifications on the CME Group website, each point of price movement changes the value of one Soybean Meal futures contract by $10USD. Therefore in absolute USD terms the risk and reward for each trade of the contract was determined as:
Risk = $10 x 86 = $860
Reward = $10 x 878 = $8,780
In AUD terms at the time of trade exit this reward was approximately equal to $12,725.
Risking 5% of the account size for this trade, the resulting percentage change to the account after taking profits would be:
10 x 5% = 50%
Keep an eye on all of the charts.
Work Hard, work smart.
Andrew Baraniak
