The Plus Key
Often throughout the Safety in the Market Course materials, you will hear us talk about engaging the “big picture” in our trading analysis. And this simple article can lend a hand when it comes to that, with just a few little keystrokes. Feel free to open up ProfitSource and take the steps as you read the article.
To demonstrate, let’s use a chart of CBA:ASX. There are a few ways to access a chart in ProfitSource, including Quote Lists. But let’s do it here the very basic way:
Charts -> New Price Chart
Symbol: CBA
Exchange: ASX
We’ll leave the Chart Type as “Bar” for now. Click OK to open the chart.
This will, of course, reveal the daily bar chart…
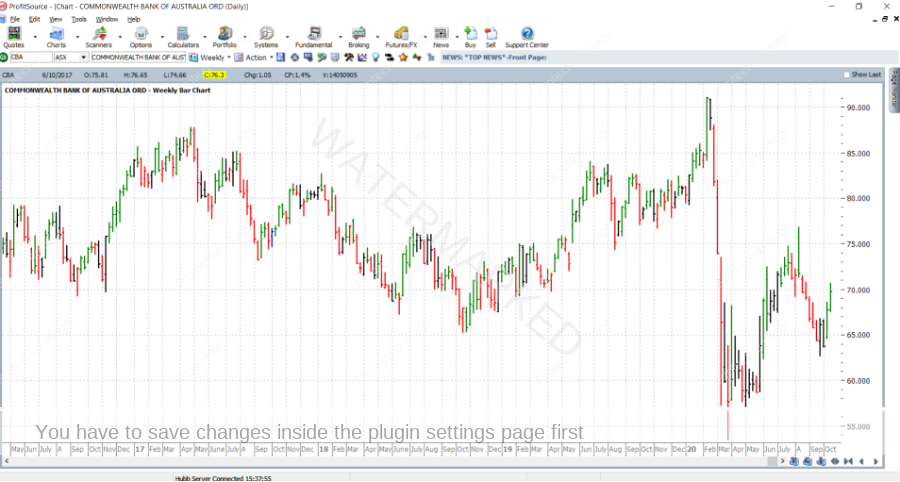
Now press the “+” (plus) key. This will instantly change the resolution of the chart from daily to weekly. In other words, we now have a weekly bar chart.
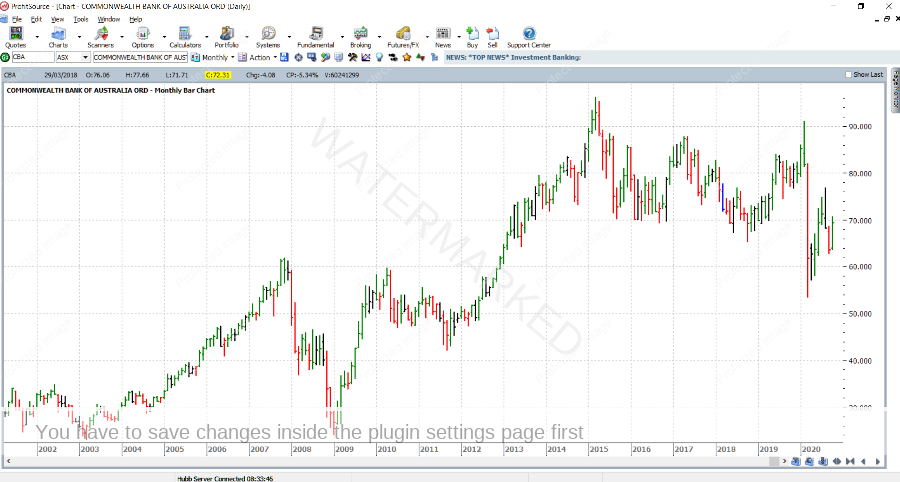
Now press the “+” key again. This will take the resolution of the chart to monthly. In other words, we now have a monthly bar chart.
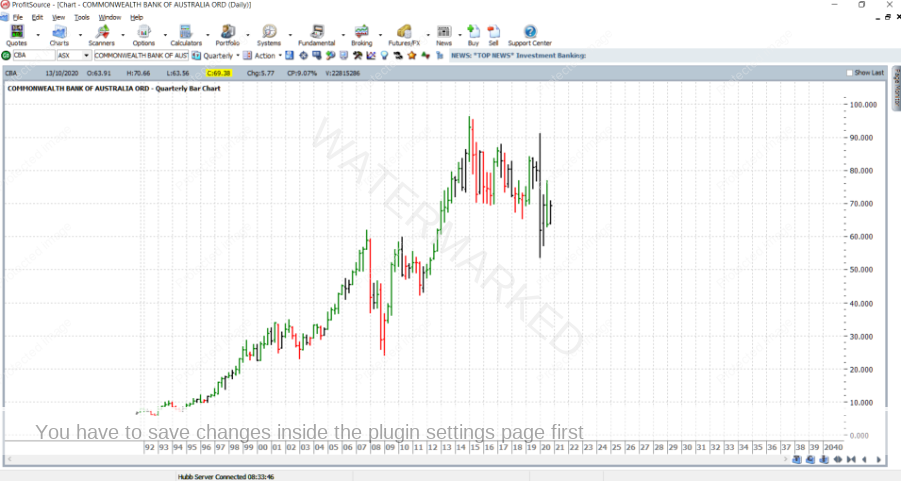
Now press it again for the Quarterly bar chart.
…and once more for the yearly bar chart.
And what about going back? Simply use the “-“ (minus) key. Doing this successively will take you back down to quarterly, monthly, weekly and finally again back to the daily bar chart.
And what else? These key strokes also work in the same way for the swing chart. There are a few ways that we can access a swing chart, but with a daily bar chart already open, let’s do it the following way:
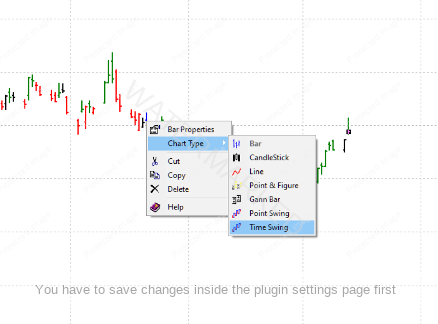
Right click on any bar of the bar chart and select Chart Type -> Time Swing
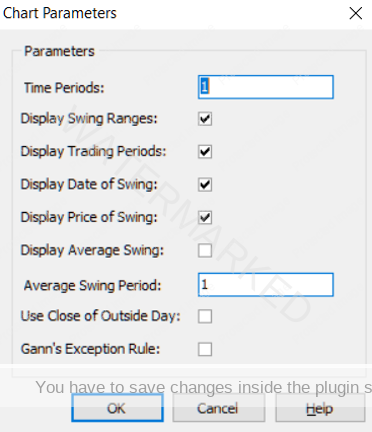
For now, leave the Chart Parameters at their defaults and click OK.
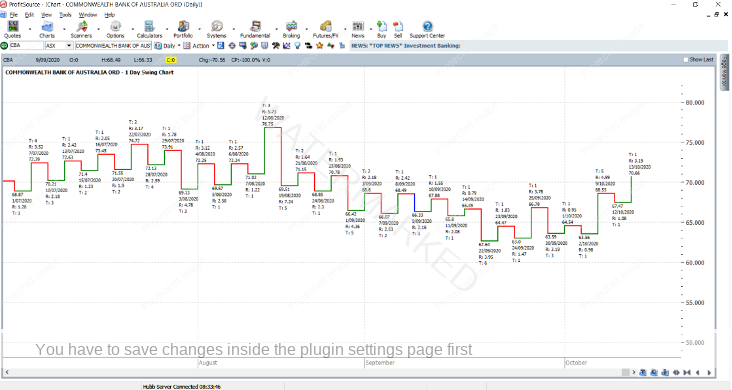
Then you will have opened a daily swing chart.
Like before, press the “+” and “-“ keys to move back and forth between daily, weekly, monthly, quarterly and yearly swing charts.
Work hard, work smart.
Andrew Baraniak


