The Power of Time
I have pondered the best way to share this analysis in such a way that it’s useful, thought provoking and assists in you “moving forward” with the second dimension in your trading plan. This month I am looking to expand on the general newsletter work on BHP. I would suggest you re-read that article which was price based and defined some clusters that it’s fair to say look good, but when the price level of $31 will come next into play is the part of the puzzle that is still unclear.
As Mat embarks on his Market Marathon this weekend, I cannot recommend more highly this initiative to cover the number of markets he has outlined, which will no doubt generate some excellent future trading setups. BHP as we know aligns into the commodities world and I do find myself moving between instruments that cover this space. As a broad commodity business (predominantly iron ore) it can allow for trading activity when other single commodity plays like oil, gas, copper, and the like are in less productive trading times.
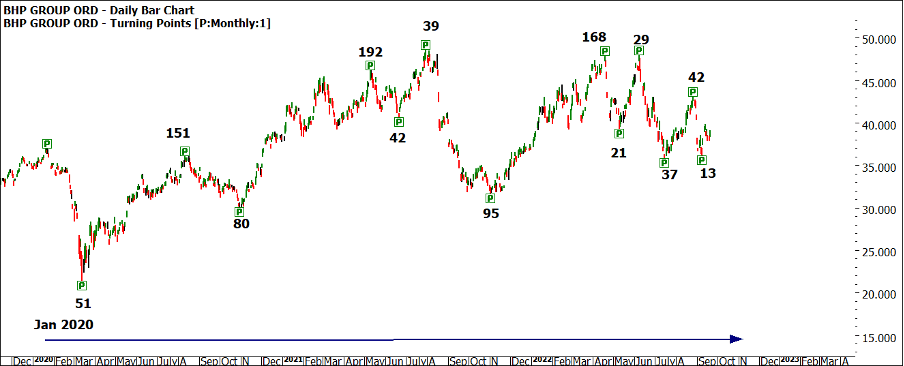
Chart 1 on BHP outlines the last two years of price action with January 2020 being the new cycle date that we can commence from.
Using a calendar day count from the low between the monthly swing tops and bottoms we can see there is a range of time frames we can identify. Keep in mind the last “green P “is not technically a turning point as it is still to be confirmed but the rest of the time counts stack up.
Chart 1 – Daily Bar Chart BHP
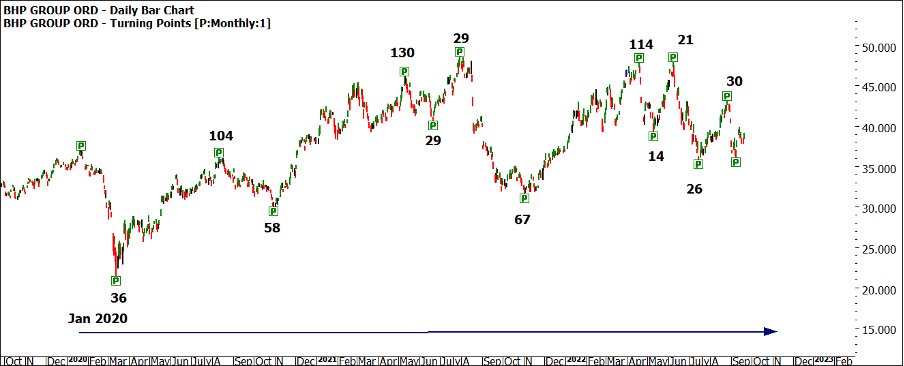
Chart 2 looks at the same reference area but looks at trading day counts, it’s imperative you look at both trading day and calendar days when setting up your markets. I like to think of them as the 2 sides of the same coin. Sometimes when you flip the coin it will be trading days other times calendar days.
Chart 2 – Daily Bar Chart BHP
We see straight away there are references to natural time, the percentages of a circle as well as the numbers David and Gann provide around natural time: 52, 144 and 168. By moving between the two measurements, calendar and trading days, you can identify additional turning points.
Now if we reflect on the article I wrote for the monthly newsletter, we discussed how the area at approximately $31 delivers some price repetition and clusters. The current price of BHP at $39 would deliver an $8 return if we could short the market and ride down to the level of $31 but it would be unwise to do so as we are missing the time option which can guide us to when (if at all) this can occur.
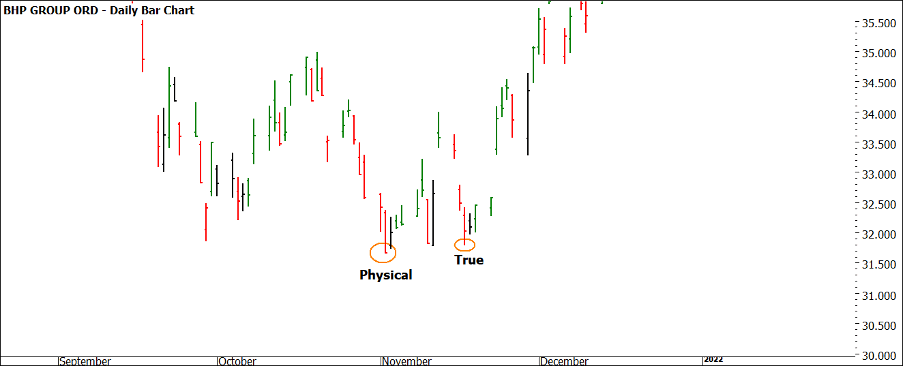
Using the 2021 year as a guide we see a grouping of lows in the month of November. There is some debate as to what the low of that month was in terms of a physical low and where the market moved away from. All can be important, but the 17th of November is resonating for me as the important turning point.
Chart 3 – Daily Bar Chart BHP 2021
Here is where I am unsure on how best to help you develop your skills in the sense of “giving you a fish” or “teaching you how to fish”. The challenge should be to understand what other analysis can assist for the November period outside of a 1-year anniversary and some smaller time counts.
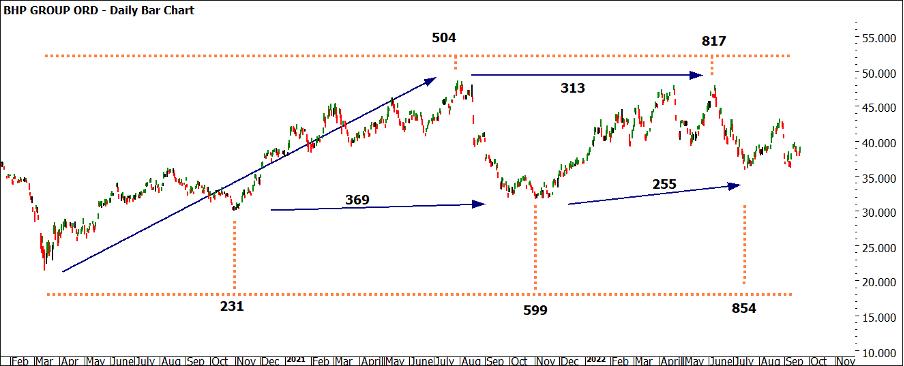
I have included the next chart as some pre-work for larger time counts, this provide us with the larger time frames between tops and bottoms and from lows to lows, highs to highs.
Chart 4 – Daily Bar Chart BHP
From here you may wish to look further back on the history of this market to understand if these time frames are common or outliers, and if they are common where do they commence or terminate? How does that relate to the month of November and what assistance can it provide?
Next month I will continue to examine this process and it will be interesting to see where the price action finds itself.
Good Trading
Aaron Lynch


