The Ripple Effect
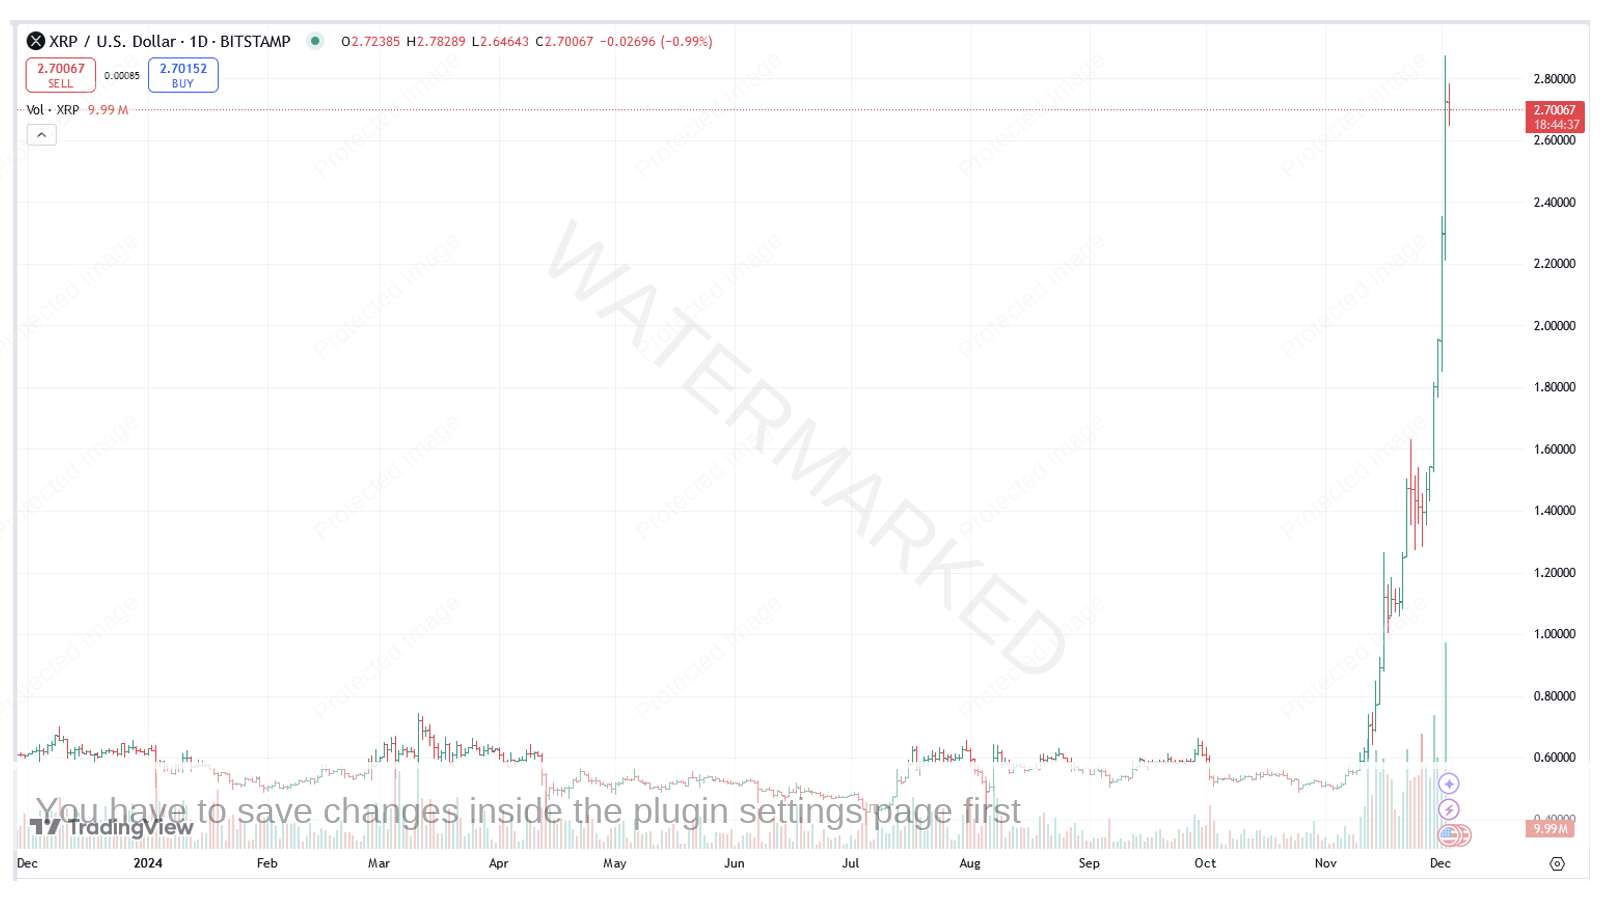
The Ripple Effect could also be coined the crypto effect, but the fact is that these crypto currencies have the potential to give you massive Reward to Risk Ratio returns. Take a look at the currency Ripple (XRP) in Chart 1 below. In just one month it’s more than quadrupled in price.
Chart 1 – XRP on Trading View
If you had just taken a conservative end of day entry and bought Monday, 4 November at 0.5200 with a stop at 0.4800, a total risk on 0.04 cents, then at the time of writing, you would have a Reward to Risk Ratio of around 55 to 1 for one entry in one month.
Of course, there have been many intraday trades with small risk and massive returns, because as you can see, when a crypto market moves, it REALLY goes!
Now I don’t know what this market is going to do, but I do know how I felt last time when Bitcoin skyrocketed and I was on the sidelines telling myself that I didn’t want to trade crypto, it’s a fad, I’ll stick to the conventional markets!
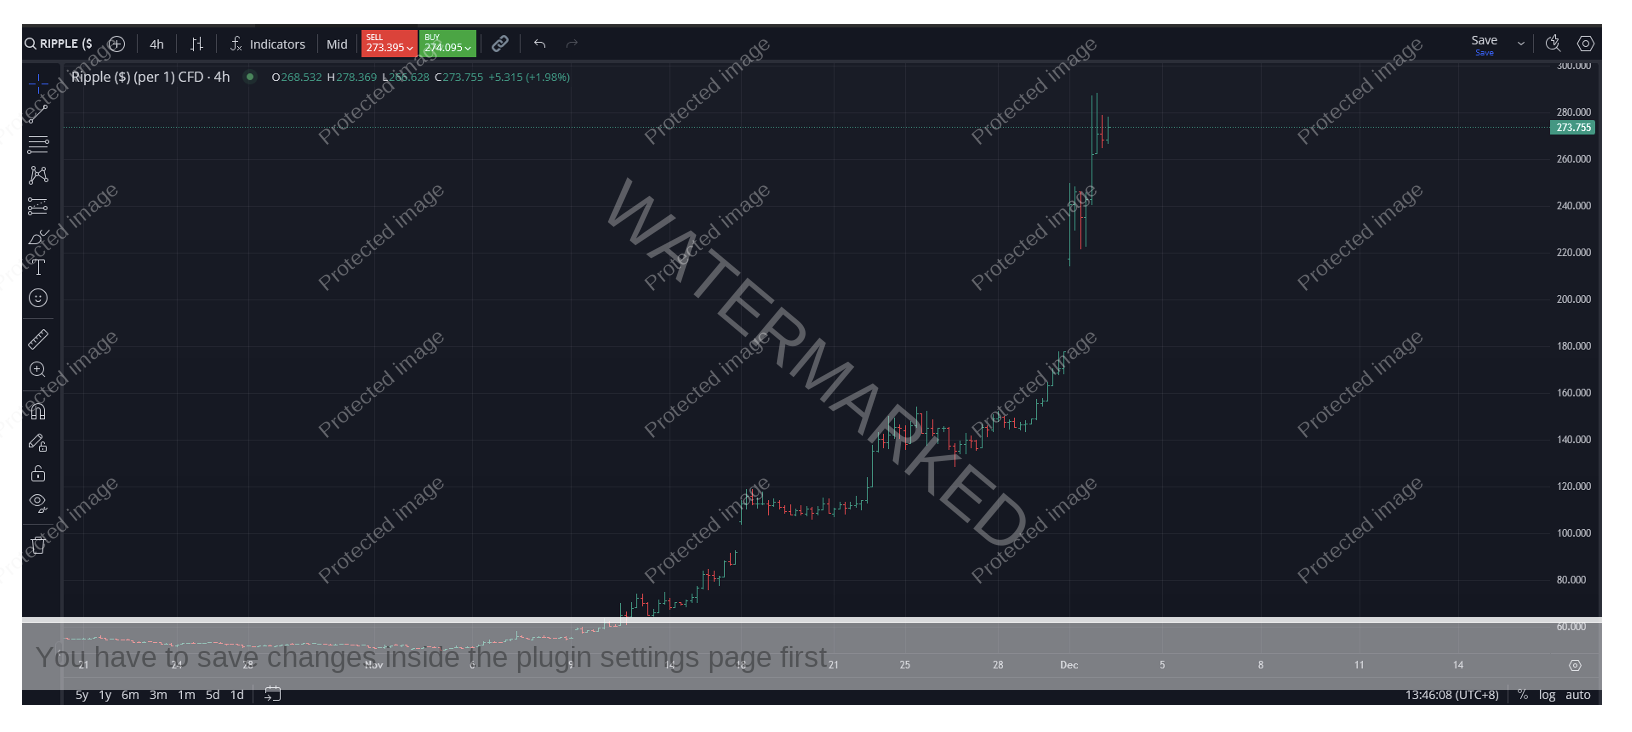
Still, I treat this like any other market, trade entry based on a solid trading plan, stops in place and let the market go. My only word of caution is to only trade the markets that trade seven days per week. You don’t want to get caught trading the version that only trades weekdays only to find the market had a large move on the weekend and gaps on Monday morning! See Chart 2 below.
Chart 2 – City Index Ripple CFD
To me crypto currencies provide an exciting opportunity for potentially building big campaigns and big profits quicker than most other markets. I’ve listened to the Warren Buffets of the world criticize the existence of crypto because it has no physical backing, well I don’t think anyone minds when you get in early, and it goes to $US90,000!
Still, the powerhouse of your trading is your trading plan, whether you trade crypto or a stock index or a commodity. So, let’s breakdown a type of trade you might expect to find in a strongly trending market.
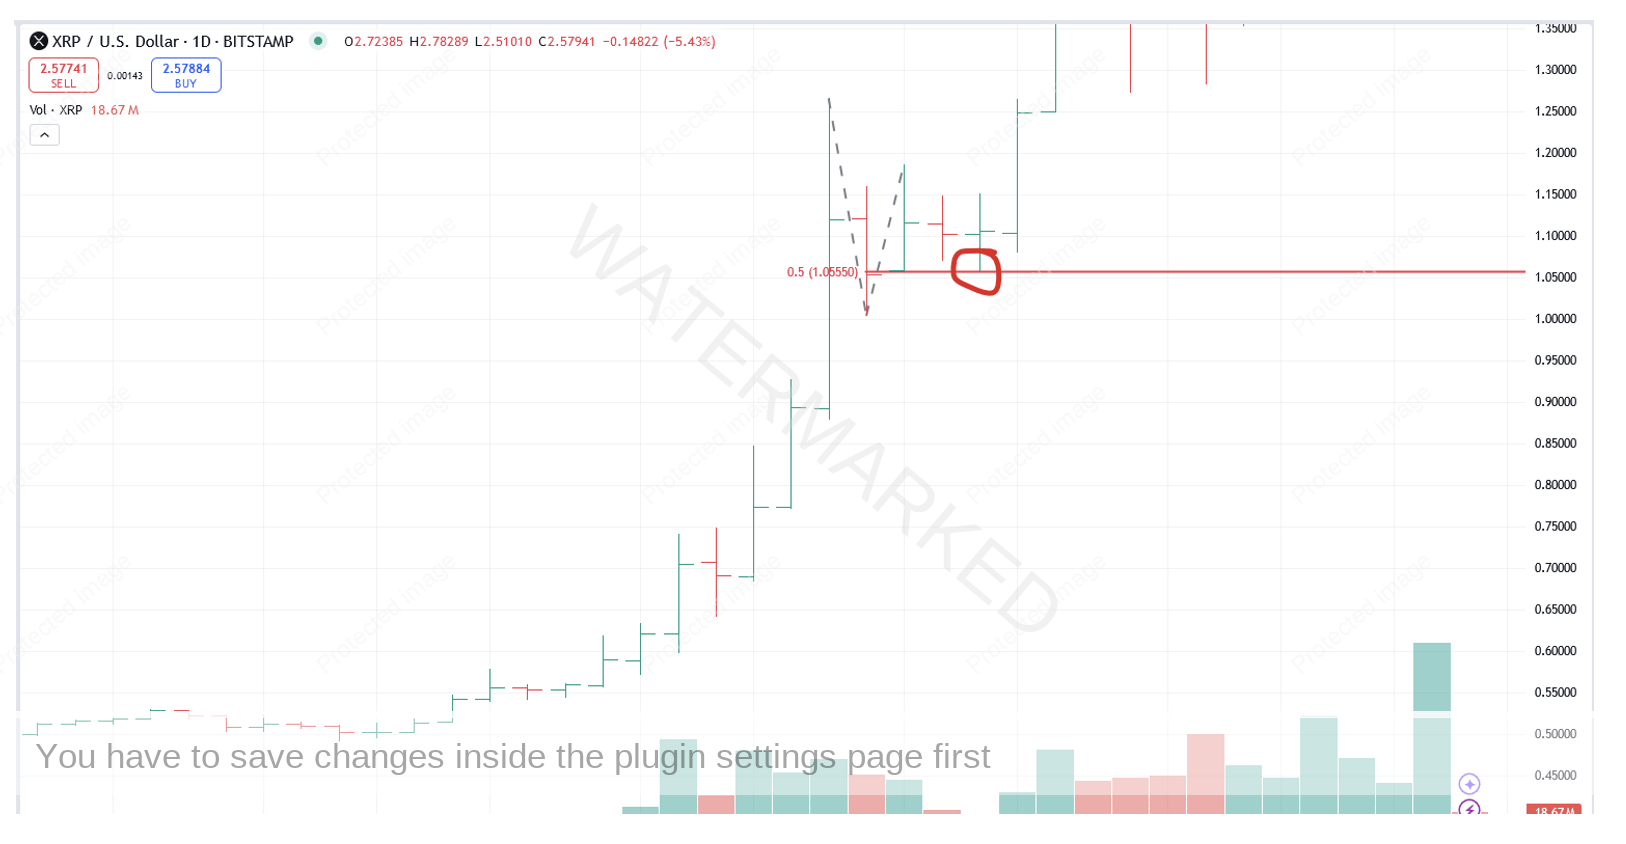
Chart 3 below shows the 1-day swing failed just above the 50% milestone.
Chart 3 – Daily 50% Milestone
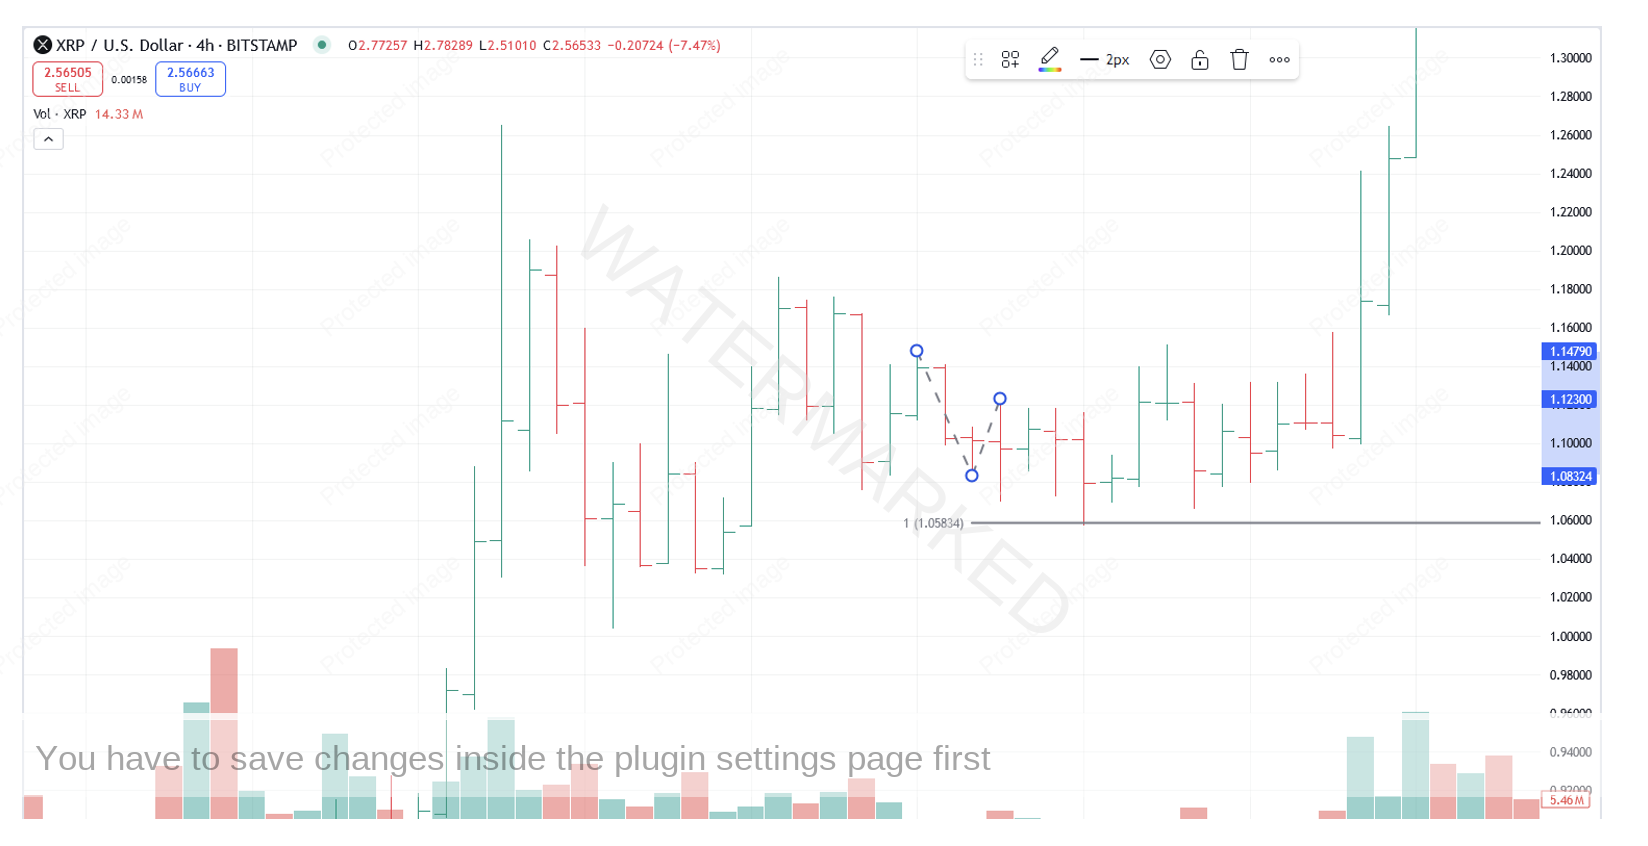
Within the failed daily swing down was four sections on the four-hour bar chart, ending in equal ranges.
Chart 4 – Sections of the Market
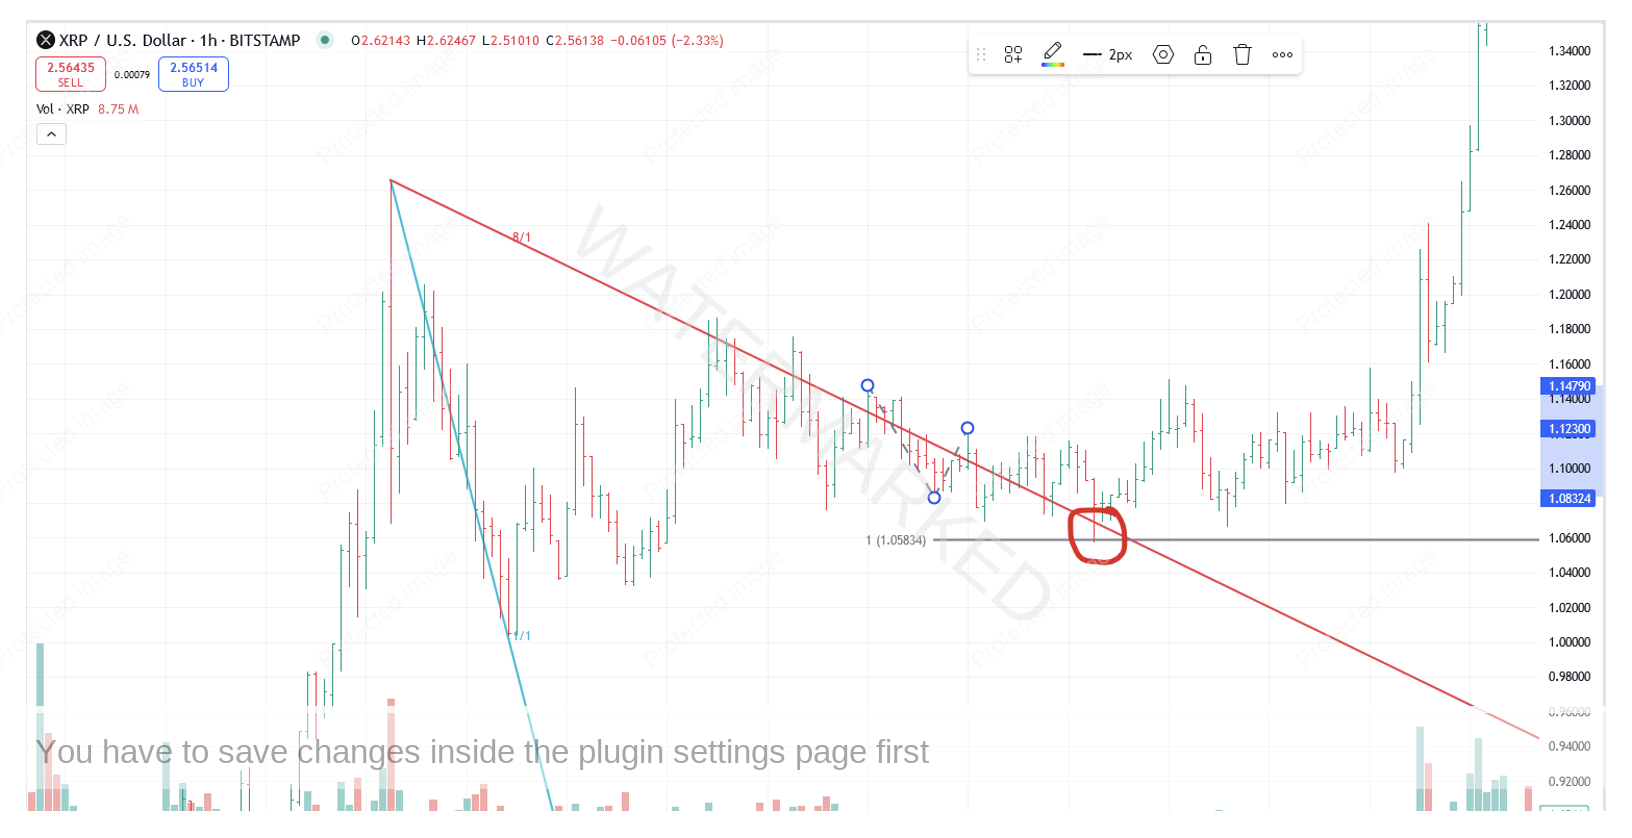
Looking at the 1-hour bar chart, the low also found the 1 x 8 Speed Angle as support that had previously acted as resistance.
Chart 5 – 1 x 8 Speed Angle Support
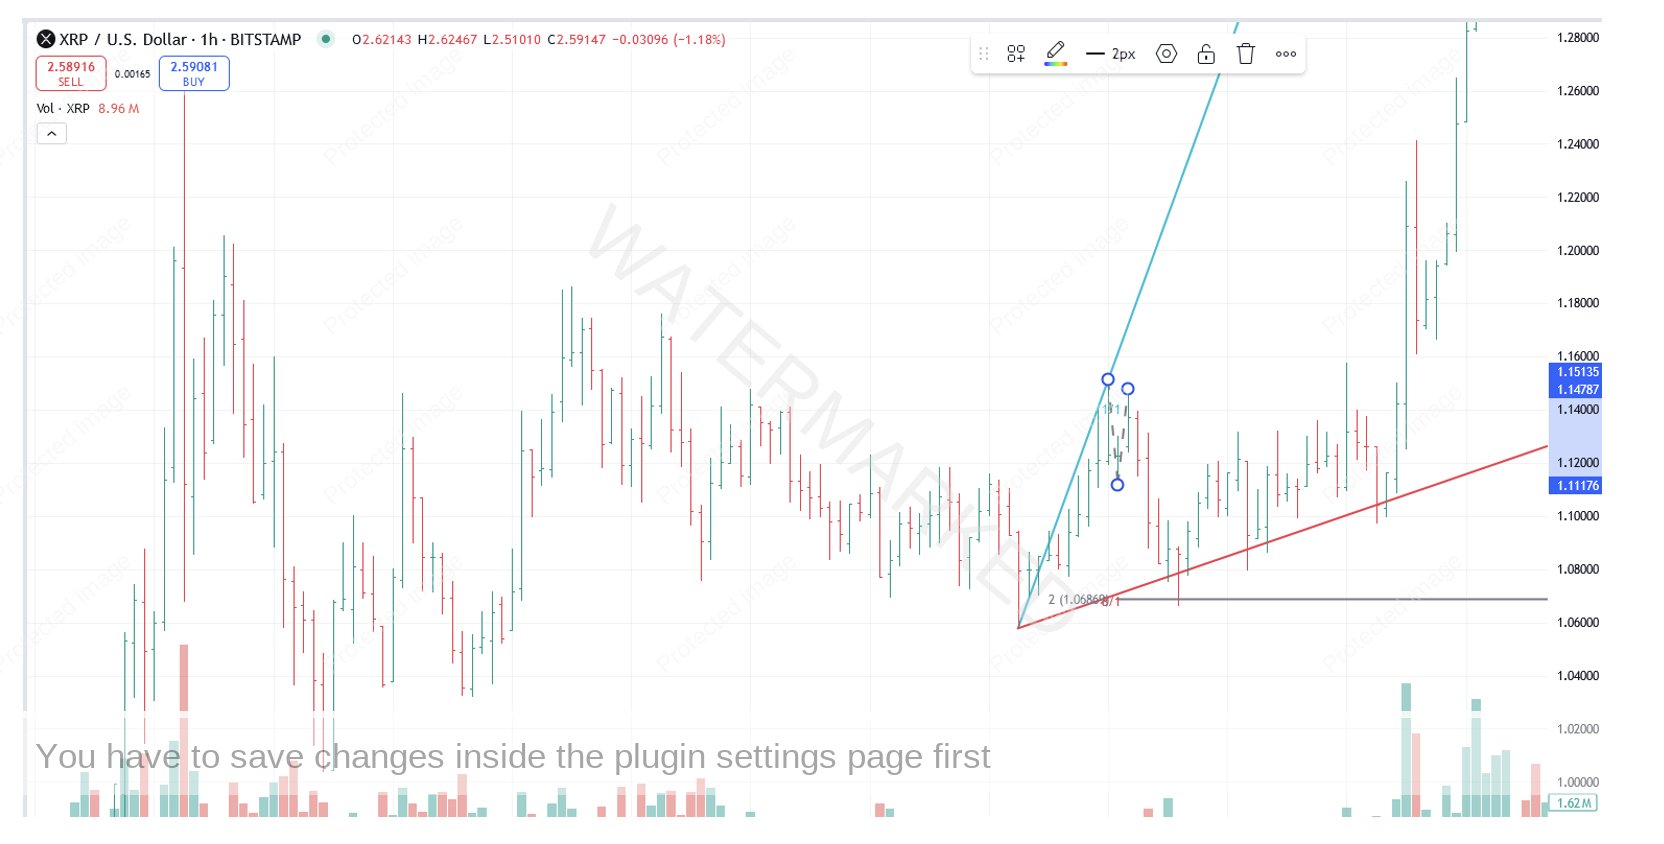
Then came the 4-hour Overbalance in Price and the 4-hour Re-test trade, which made its low right on 200% of the hourly First Range Out and the 1 x 8 speed angle.
Chart 6 – 1 Hour Setup
If you had taken this entry as the 1-hour swing turns up, at 1.0900 with a stop at 1.0630, that gives you a risk of 0.027 cents.
If you were still holding this position and taking the current price of 2.6332, then you’re sitting on a 57 to 1 Reward to Risk Ratio profit for the one entry.
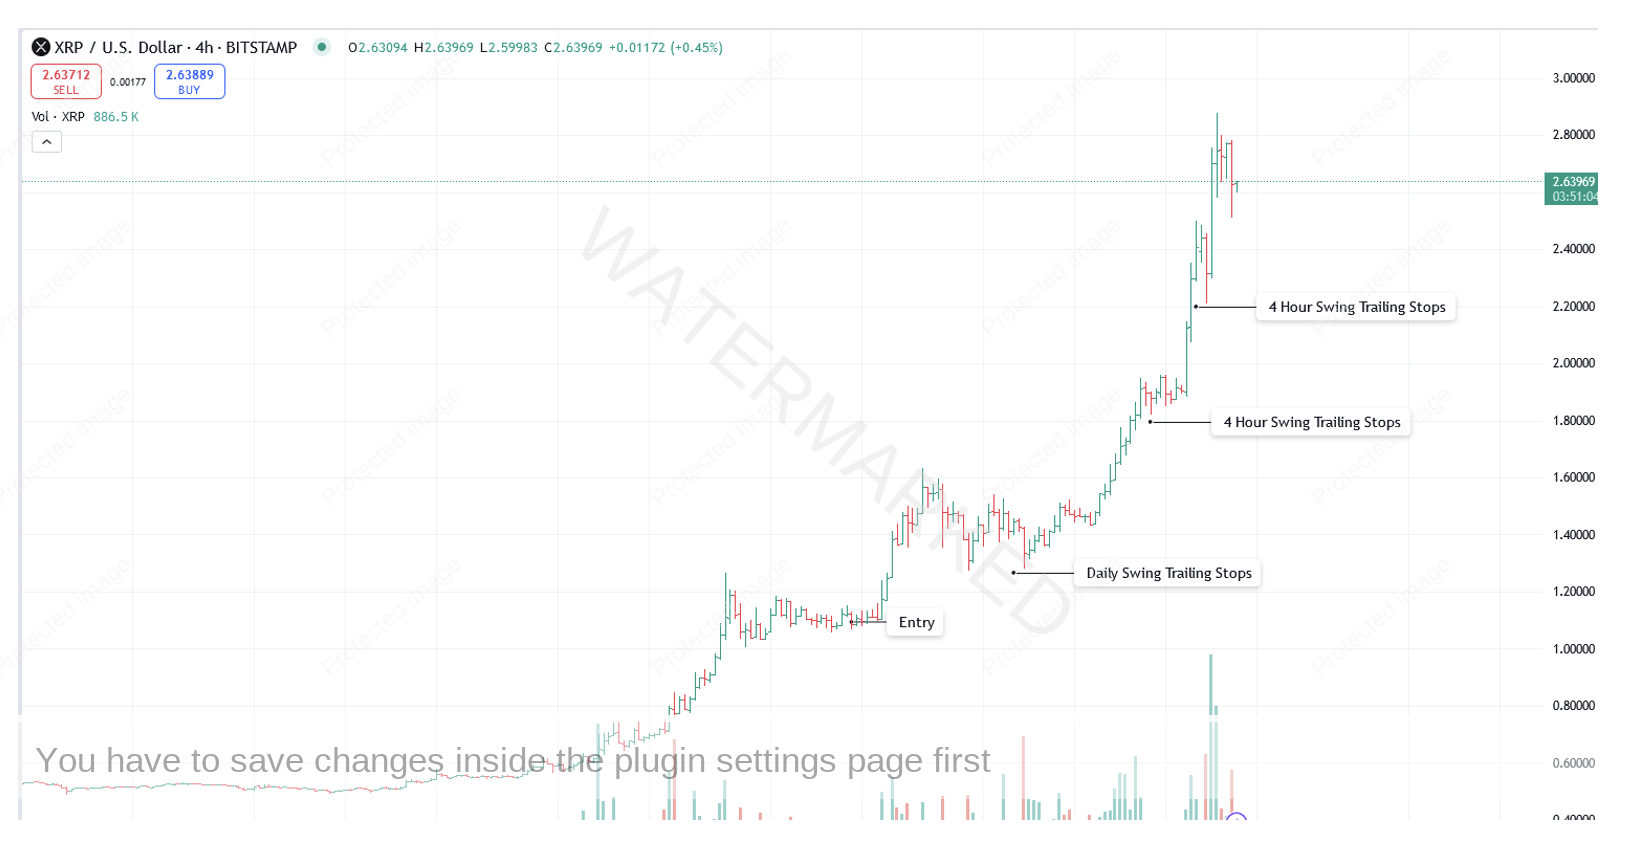
You could easily trail stops behind the last daily swing or the major 4-hour swing lows as old tops are crossed to keep locking in profit.
Chart 7 – Trailing Stop Management
Happy Trading
Gus Hingeley
